
Horizontal Evaluation of the Youth Employment Strategy - Summer Work Experience stream
On this page
Alternate formats

Evaluation of the Youth Employment Strategy – Summer Work Experience stream [PDF - 1.7 MB]
Request other formats online or call 1 800 O-Canada (1-800-622-6232). If you use a teletypewriter (TTY), call 1-800-926-9105. Large print, braille, audio cassette, audio CD, e-text diskette, e-text CD and DAISY are available on demand.
Main findings and recommendation
Four main findings were drawn from this evaluation:
- The program enjoys a very high level of satisfaction among both participating organizations (79%) and students (89%)
- Over 90% of students indicated that their experience helped them develop key competencies and traits linked to addressing complex challenges and adapting to a changing environment
- The average duration of work placements provided to students slightly decreased from 2016 to 2018
- On average, students were paid above the minimum wage in effect in their province or territory and most summer students felt that it helped pay for school expenses
This evaluation report identifies one recommendation for the Department:
- The department should explore ways to better leverage administrative and participant data to inform policy and design of the program
Introduction
In accordance with the Policy on Results and in fulfillment of the Financial Administration Act obligations, this evaluation report is one of three individual reports on the Youth Employment Strategy. This report focuses on the Summer Work Experience stream of the Strategy, which provides wage subsidies to Canadian employers to create summer work opportunities.
In addition to the Summer Work Experience stream, the Strategy also consisted of two other separate streams: Skills Link and Career Focus. Although all streams involved youth aged 15 to 30, their respective objectives and segment of youth targeted were different, resulting in the need to present findings in separate reports
Employment and Social Development Canada (ESDC) is the lead department working in collaboration with ten other departments and agencies on this horizontal initiative.
In 2017 to 2018, the most recent year for which data are publicly available, close to 85% of the funding for Summer Work Experience stream was allocated to the Canada Summer Jobs program delivered by ESDC
From the program design and delivery perspective, every department is accountable for the management and implementation of their respective programs to achieve results. As the lead department, ESDC performed an oversight role, which included the coordination for an evaluation.
To that end, this report provides an overview of the different initiatives delivered by the various contributing departments and agencies, for which the information was available. These results are then supplemented by a descriptive analysis of the students and employers who took part in ESDC's Canada Summer Jobs program, as well as their responses to complementary surveys to inform their experiences and perspective on the program.
Given the similarities between the target population of the various initiatives under the Summer Work Experience umbrella, participating organizations can draw from key findings and recommendation from this report to inform their own initiative; considering their respective policy, design and delivery features.
Program background
About Summer Work Experience
Summer Work Experience was a stream of the Youth Employment Strategy and contributed to the federal government's commitment to help young people between the ages of 15 and 30 to gain the skills, work experience and abilities they need to transition successfully into the labour market.
This stream involved four departments and one agency who delivered specific initiatives under different names:
- At Employment and Social Development Canada (ESDC), this initiative was—and will remain under the new Youth Employment and Skills Strategy—the Canada Summer Jobs program and will be referred to as “program” hereafter
- Parks Canada, an agency within the federal government, contributed with the Young Canada Works initiative
- Canadian Heritage (PCH) contributed with two specific summer initiatives: The Young Canada Works in Both Official Languages and Young Canada Works in Heritage Organizations
- Indigenous and Northern Affairs Canada (INAC) contributed through the First Nations and Inuit Summer Youth Work Experience initiative for secondary and post-secondary students
- Innovation, Science and Economic Development Canada (ISED) contributed through the Youth Internships at Community Access Site initiative. As of 2016 to 2017, the initiative was discontinued
With the exception of Parks Canada who hired - and continue to hire - participants directly, the remaining four departments listed above involved third parties.
Regarding ESDC's Canada Summer Jobs program, more information on organizations that received funding and the associated number of created jobs, can be found at Youth Employment and Skills Strategy.
In 2017 to 2018, the bulk of the funding for the Summer Work Experience stream was allocated to ESDC (close to 85%) for the Canada Summer Jobs initiative. Commensurate with the funding allocation, close to 90% of participants received a job placement under the Canada Summer Jobs initiative delivered by ESDC.
Funding allocated to certain initiatives markedly increased in recent years. For example:
Funding allocated to the First Nations and Inuit Summer Youth Work Experience increased from about $10M in 2015 to 2016 to about $16M in 2017 to 2018. As a result, the number of participants went from about 3,800 students to about 5,000.
Funding allocated to Parks Canada (Young Canada Works) increased from about $2M in 2015 to 2016 to about $14M in 2017 to 2018. As a result, the number of participants went from about 200 in 2015 to 2016 to about 1,500 in 2017 to 2018.
ESDC's Canada Summer Jobs initiative was also enhanced (see section "ESDC's Canada Summer Jobs program").
| Department | Initiative | Participants (#) | Percentage of total participants | Spending ($M) | Percentage of total spending |
|---|---|---|---|---|---|
| ESDC | Canada Summer Jobs | 68967 | 89% | 215 | 84% |
| INAC | the First Nations and Inuit Summer Youth Work Experience | 4934 | 6% | 15.7 | 6% |
| Parks | Young Canada Works | 1484 | 2% | 14.4 | 6% |
| PCH | Young Canada Works in Both Official Languages and Young Canada Works in Heritage Organizations |
1708 | 2% | 11.1 | 4% |
| All | Total | 77093 | 100% | 256.2 | 100% |
Source: TBS Horizontal Initiatives Database as well as ESDC's Data Collection System and Common System for Grants and Contributions 2017 to 2018 (including departmental annual Year-End reports when available). Information regarding the First Nations and Inuit Summer Youth Work Experience was supplied directly by Indigenous and Northern Affairs Canada.
Transitioning from the Youth Employment Strategy to the Youth Employment and Skills Strategy
As part of the modernization of the Youth Employment Strategy, all three streams - Summer Work Experience, Skills Link and Career Focus - underwent a re-design to respond to a range of labour market challenges faced by youth, particularly those facing barriers to employment, under a new Youth Employment and Skills Strategy (YESS) that came into effect in June 2019.
The new Strategy continues to be delivered by 11 departments and agencies across the Government of Canada. It aims to provide more flexible employment services tailored to each individual and enhanced supports for all young Canadians as well as to broaden eligibility and offer a wider range of programs to help young people gain the skills, abilities and experience they need to get good-quality jobs.
The transition from the Youth Employment Strategy to a modernized Youth Employment and Skills Strategy took place during the preparation of this evaluation report for Summer Work Experience. Preliminary evidence for this and the other reports on the components of the Strategy were shared with the program area in order to support policy development as it became available.
Changes in program design
Under the modernized strategy, the Summer Work Experience stream no longer exists independently but has been merged with the Skills Link and Career Focus streams in order to offer a more integrated and flexible set of program interventions that would be more responsive to the needs of individual youth. Some YESS federal partner departments will continue to deliver initiatives similar in design to those that were previously offered under Career Focus. As part of this modernization however, ESDC's Canada Summer Jobs program was taken out from under Summer Work Experience and made into a distinct stream. Lastly, the Goal Getters program has also been added as an additional program area to help youth facing barriers to complete high school and transition to post-secondary education and/or employment.
Changes to the performance framework
In addition, the modernized Strategy includes a new performance framework whereby all YESS federal partners will track common, standardized outcomes that are indicative that a youth is moving along a continuum towards employment. New outcomes include job-readiness and career advancement, which involve tracking if young Canadians are acquiring the skills employers are looking for through modernized YESS programming. The new performance framework also focuses on collecting more in-depth information about the types and combinations of interventions youth receive.
ESDC's Canada Summer Jobs program
The program is designed to create work opportunities for youth by supporting organizations from various sectors, while taking into consideration community needs and priorities. More information can be found at Canada Summer Jobs.
Student eligibility
Eligible students are legally entitled to work in Canada in accordance with relevant federal, provincial or territorial legislation and regulations. Eligible students must be registered as full-time students in the previous academic year and intending to return to school on a full-time basis in the next academic year. They must be 15 to 30 years old at the start of the employment.
- Legal status includes Canadian citizens or permanent residents or of refugees' status in Canada under the Immigration and Refugee Protection Act
Starting summer 2019, outside the scope of the evaluation, all youth aged 15 to 30 can participate regardless of their status as students.
Employer eligibility
Eligible employers included and continue to include not-for-profit organizations, public and private sectors preferably small businesses with 50 or fewer full-time employees.
Employers must commit to provide a duration of six to 16 weeks of work experience.
Excluded as employers were and continue to be the House of Commons, the Senate, all federal, provincial and territorial departments and agencies.
Starting summer 2019, outside the scope of the evaluation, employers must demonstrate that they provide quality work experiences for summer students.
Members of Parliament (MPs)
- Funding was and continues to be allocated at the level of the Federal Electoral Districts
- Employers' applications continue to be assessed for eligibility and then prioritized according to how they respond to the program's objectives
- Following Service Canada's assessment and ranking of all eligible applications, MPs were and will be provided with a list of recommended projects within their Districts
- MPs continue to be engaged by providing feedback based on their knowledge of local labour market needs
Scope and questions covered by the evaluation
- Is there a demand for Summer Work Experience?
- Did Summer Work Experience participants access and use labour market information and Employment Assistance Services intended for career decision making?
- What is the nature of the work experience provided to Summer Work Experience participants?
- Did Summer Work Experience reach its eligible participants?
- To what extent did the Summer Work Experience employment income support returning to school?
- Following their participation in Summer Work Experience did participants return to school or continue to work?
- How satisfied are youth participants with Summer Work Experience?
- What is the average cost per participant?
Data limitations and evaluation considerations
The evaluation report is highly descriptive in nature with a focus on immediate outcomes observed for the summer of 2018. This limits the value of the evaluation findings and reflects the extent of the available data to conduct the evaluation.
Data on the program participants are entered into the Common System for Grants and Contributions database, which is also referred to as administrative data. The database consists of two modules, one for participating organizations and one for participating students.
- Administrative data is limited to the profile of participants as per the completed participant information form (for example, birth date, gender, demographic group) and provides basic information on the work experiences created by participating organizations (for example, wage level, start date, end date and number of weekly hours)
Nevertheless, administrative data is not sufficient to inform the employers' and students' respective experiences and perspectives on the program. To make up for these limitations, complementary exit surveys have been conducted starting in 2015. The exit survey was designed to get more information about the program on a year-over-year basis.
- In 2015, 2016 and 2017, only 20% of students could be surveyed and the response rates were very low. As a result, this evaluation excluded survey results for summer 2015, 2016, and 2017
As of the summer 2018, the design and delivery of the complementary survey was changed to address, in part, gaps identified as part of previous evaluations. Therefore, a more comprehensive survey was implemented to collect additional information from both employers and students.
- About 9,400 employers (37% response rate) and approximately 22,600 students (38% response rate) responded to their respective survey
While the make-up of survey respondents could be better aligned with the entire population of participating students and despite the fact that some questions were subject to non responses (see Annex B, for a more detailed description), results are still considered to be sufficiently reliable to inform this evaluation.
In summer 2018, the program created more than 70,000 employment opportunities - twice what had been created in the summer 2015.
As a result of Budget 2016, the number of work opportunities funded by the Program doubled from about 35,000 in the summer 2015 to slightly over 70,000 in the summer 2018 (see Figure 1).
- In the summer 2018, employers received an average funding of about $3,000 per job created
- In every single summer, employers continue to be eligible to receive funding for different jobs to hire different students, regardless of whether they receive funding in prior years
The funding model takes into consideration the youth unemployment rate at the electoral district level. Employers located in Quebec and Ontario accounted for the largest shares followed by those observed in the western provinces (BC and AB) and in the Atlantic (NL, NB and NS). (see Table 2).

Text description of Figure 1
| Funding and jobs | Summer 2015 | Summer 2016 | Summer 2017 | Summer 2018 |
|---|---|---|---|---|
| Funding (in $ millions) | $M 107 | $M 215 | $M 215 | $M 215 |
| Number of jobs | 34,179 | 65,874 | 68,967 | 70,083 |
- Source: Administrative data, Common System for Grants and Contributions.
| Province/Territory | Distribution Percentage |
|---|---|
| Alberta | 7.6 |
| British Columbia | 9.5 |
| Manitoba | 2.8 |
| New Brunswick | 4 |
| Newfoundland and Labrador | 5.4 |
| Nova Scotia | 4 |
| Ontario | 39 |
| Prince Edward Island | 0.9 |
| Quebec | 24 |
| Saskatchewan | 2.4 |
| Northwest Territories | 0.2 |
| Nunavut | 0.1 |
| Yukon | 0.1 |
- Source: Administrative data, Common System for Grants and Contributions.
From summer 2016 to summer 2018, an average of 22,200 Canadian employers received funding annually to create work opportunities for students.
Each year, applications for funding to the program exceeded the available funding. For example, in the summer 2018, total requests for funding was more than three times the program's budget of $215 M. As a result, an employer may have submitted several projects though only projects meeting all eligibility requirements were recommended by Service Canada for MPs' review.
- Approximately 1-in-6 projects were not funded due to a limited program budget or project ineligibility
Figure 2 indicates that most employers were in the not-for-profit sector, which consisted of local communities, charitable, voluntary and provincial non-governmental organizations (NGOs).

Text description of Figure 2
| Sector | Share of organizations |
|---|---|
| Not-for-profit | 75% |
| Private | 15% |
| Public | 10% |
From the 2018 Survey for the Canada Summer Jobs Program
Employers' key motivation for participation
- Wage Subsidy
- Corporate Social Responsibility
- Access to Students
Most common recruitment methods by employers
- Social Media (e.g., Facebook, LinkedIn)
- Referrals / Word of Mouth
- Returning students from previous years
- Advertisement
- Job Bank
Most of Canada Summer Jobs' participants were women, and were between the age of 20 to 24 years old.
Relative to the profile of eligible students in the spring of 2018, participants in the Canada Summer Jobs (CSJ) program during the summer of 2018, were more likely to be women:
- As shown in Figure 3, in the summer of 2018, women represented about 66% of participating students. Comparatively, women represented about 51% of full-time students in the spring of 2018
- Students aged between 20 to 24 years old represented about 60% of participants, while they represented about 34% of full-time students in the spring of 2018
The representation of youth under the age of 20 was significantly lower compared with the profile of eligible full-time students in the spring of 2018.

Text description of Figure 3
| Sub-group | CSJ students (summer 2018) | Full-time students (spring 2018) |
|---|---|---|
| Women | 66% | 51% |
| Men | 34% | 49% |
| 25 to 30 years old | 13% | 9% |
| 20 to 24 years old | 60% | 34% |
| 15 to 19 years old | 27% | 57% |
- Sources: Common System for Grants and Contributions and Labour Force Survey (March 2018).
- Note: Values do not add to 100% due to rounding.; Age determined by subtracting participants' year of birth from 2018.; Gender shares determined based on participants' self-identification as men or women. For the summer 2018, gender was unspecified for about 1% of participants.
Close-up on the gender profile of program's participants
As previously noted, a relatively high share of program's participants in the summer of 2018 are women (representing about 66% of participants).
As shown in Figure 4, a similar profile was observed for the 2016 and 2017 summers.
As shown in Figure 5, the predominance of women varied depending on the sector of the economy, in which the participating employer was. In particular, both in the not-for-profit and the public sectors, women represented a relatively higher proportion of participants. In contrast, the proportion of women working in the private sector was more in line with the share of women studying on a full-time basis aged between 15 and 30.
Given the observed predominance of women among program's participants, consideration could be given to conduct a review and analysis of the type of work experiences created under the program from an occupational and gender perspective.

Text description of Figure 4
| Period | Men | Women |
|---|---|---|
| Summer 2016 | 34% | 66% |
| Summer 2017 | 35% | 65% |
| Summer 2018 | 34% | 66% |
- Sources: Common System for Grants and Contributions
- Note: Shares determined based on participants' self-identification as men or women. Gender was unspecified for about 16% of participants in summer 2016, about 4% of participants in summer 2017 and about 1% of participants in summer 2018.

Text description of Figure 5
| Sector | Summer 2016 | Summer 2017 | Summer 2018 |
|---|---|---|---|
| Public | 67% | 68% | 67% |
| Private | 53% | 53% | 54% |
| Not-for-profit | 68% | 67% | 68% |
- Sources: Common System for Grants and Contributions
- Note: Shares determined based on participants' self identification as men or women.
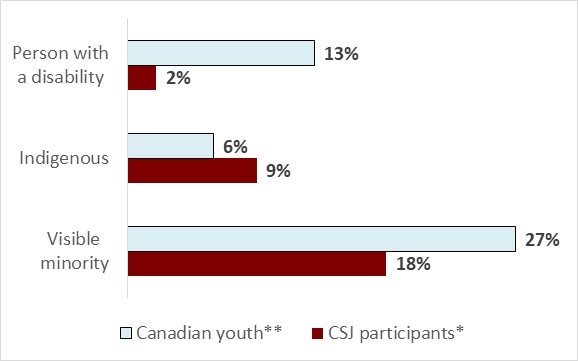
In line with the portrait of the Canadian youth, close to a quarter of all participating students self-identified as a member of an Indigenous group, as a visible minority, or as a person with a disability.
As per the Applicant Guides for summer jobs in 2017 and 2018, one of the program's priorities was to hire youth who were part of underrepresented groups, including Indigenous youths, new immigrant youth / refugees, youth with disabilities and youth belonging to a visible minority group. To that end, as part of the assessment criteria, organisations were awarded points if they express the intent to hire youth who self-identify as being part of unrepresented groups.
The shares of Canada Summer Jobs' participants who self-identify as belonging to unrepresented groups are largely in line with those observed for the Canadian youth at large.
As shown in Figure 6, in the summer of 2018:
- The share of participants who self-identified as a visible minority was relatively lower, at about 18% compared to about 27% for the Canadian youth at large (Statistics Canada, 2019)
- Similarly, the share of participants who self-identified as a youth with a disability was relatively lower, at about 2% compared to about 13% for the Canadian youth at large (Statistics Canada, 2019)
- On the other hand, the share of participants who self-identified as Indigenous was relatively higher at about 9% compared to about 6% for the Canadian youth at large (Census 2016) - with half of those who self-identified as Indigenous participants were non-status First Nations
- Among Indigenous participants, there were four groups: On-Reserve Registered First Nations, Off-reserve, Métis and Inuit students
Text description of Figure 6
| Sub-group | CSJ participants* | Canadian youth** |
|---|---|---|
| Visible minority | 18% | 27% |
| Indigenous | 9% | 6% |
| Person with a disability | 2% | 13% |
- Source: Common System for Grants and Contributions and 2016 Census
- *Based on the number of students who self-identified. Participants may belong to more than one category.
- **Note that for the Canadian youth at large, the population is not limited to students. Canadian youth may belong to more than one category.
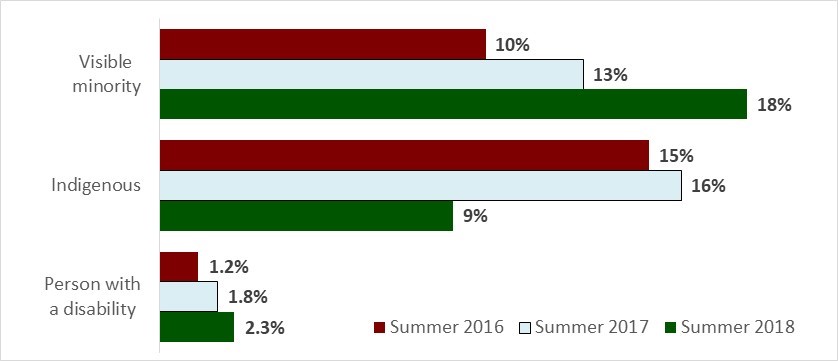
Close-up on students who self-identified as being either an Indigenous people, a visible minority, or a person with a disability
- Among participating students who self-identified as being part of an underrepresented group:
- the shares of those who self-identified as a visible minority or a person with a disability increased between summer 2016 and summer 2018
- the shares of those who self-identified as an Indigenous person remained above their demographic representation of the Canadian youth population (about 6% as per Census 2016)
- Still, it should be noted that when students were asked to self-identify as a visible minority, Indigenous person or a person with disability, a relatively large portion declined or did not answer, particularly among the summer 2016 and 2017 participants. Therefore, caution should be exercised when examining trends over time
Text description of Figure 7
| Sub-group | Summer 2016 | Summer 2017 | Summer 2018 |
|---|---|---|---|
| Visible minority | 10% | 13% | 18% |
| Indigenous | 15% | 16% | 9% |
| Person with a disability | 1% | 2% | 2% |
- Source: Common System for Grants and Contributions
- Note: figures are based on the number of students who self-identified. Participants may belong to more than one category.
HUMA report #12 on Experiential Learning and Pathways to Employment for Canadian Youth
Six specific recommendations for the Canada Summer Jobs Program
In 2018, the Standing Committee on Human Resources, Skills and Social Development and the Status of Persons with Disabilities (HUMA) tabled a report entitled “Experiential learning and pathways to employment for Canadian youth”.
As part of this report, the Committee made a specific recommendation for ESDC's Canada Summer Jobs program , so that it:
- supports jobs year-round
- supports both full-time and part-time hours, that can last between eight and sixteen weeks
- provides significantly more information to Members of Parliament, and more information about employers applying to the Canada Summer Jobs program
- ensures a priority is placed on younger students, to help them get their first work experiences
- institutes a trusted employer mechanism to enable multi-year funding
- includes a priority for younger students (high-school aged)
- is available both to full-time and part-time students, and recent graduates
- is easy to navigate for employers and young people
The Government responded to this recommendation and outlined its action plan on February 19, 2019. To avoid duplication, this evaluation takes into consideration on-going and planned activities to address specific recommendations from the report and puts forward recommendations intended to complement the Government's response in addressing issues identified by HUMA.
A copy of the Huma Committee Report can be found at the House of Commons web site.
The Government's response to the Huma Committee Report can be found at the House of Commons web site.
Main findings
Main finding #1: The program enjoys a very high level of satisfaction among both participating organizations (79%) and students (89%).
Most employers (79%) were either satisfied or very satisfied with the summer job placements.
- Not-for-profit employers, who received a subsidy equivalent to 100% of the provincial or territorial minimum wage, expressed the highest levels of satisfaction.
- Based on 2018 experience, most (93%) organizations intended to participate again.
In spite of the overall high level of satisfaction among participating employers, Figure 8 shows that one-in-five reported being dissatisfied and very dissatisfied (19%) with the program.
Among employers who provided reasons for their dissatisfaction, longer job duration and late notification of approved projects were identified as key issues.
Approximately 1-in-3 employers retained or hired a student on a part-time basis after their summer 2018 work experience was completed.
Employers offering part-time positions had to ensure that students hired from the program would not replace existing employees or volunteers, including employees temporarily laid-off and /or awaiting recall, or, employees absent due to a labour dispute.
- Without wage subsidies and long-term needs for additional employees, most employers did not consider keeping their summer students.
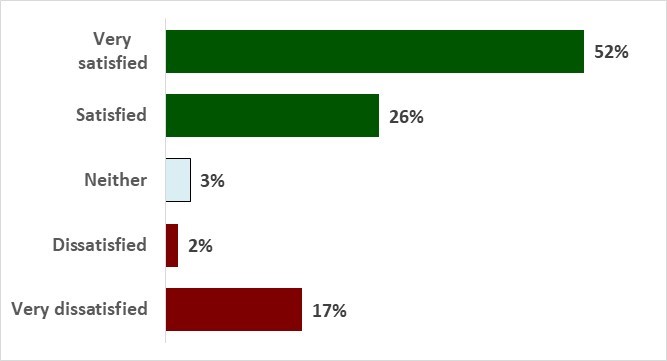
Text description of Figure 8
| Employers satisfaction | Response share |
|---|---|
| Very satisfied | 52% |
| Satisfied | 27% |
| Neither | 2% |
| Dissatisfied | 2% |
| Very dissatisfied | 17% |
- Source: Complementary exit surveys, Summer 2018
Skills most valued by employers who provided feedback in 2018
Employers more frequently cited the following skills as those they most valued:
- Initiative
- Written and Oral Communication Skills
- Positive Professional Relationships
- Decision-Making Skills
- Creativity and Originality
Note on the program's employer and student surveys
For summer 2018, Service Canada sent two survey questionnaires to 25,100 participating employers. Employers were expected to send the students' questionnaire to all participating students in their organization for a self-assessment at the end of the work term. This new method of administering the survey improved the response rate. About 9,400 employers responded to the employer survey (37% response rate) and approximately 22,600 students responded to the student survey (38% response rate).
Looking forward and starting summer 2019, employers are required to complete their respective survey questionnaire.
As shown in Figure 9, most students (89%) expressed their satisfaction with the program.
The level of satisfaction (satisfied and very satisfied) among post-secondary students was similar to secondary students.
- Among post-secondary students who indicated they were dissatisfied or very dissatisfied, longer job duration, higher hourly wage, lack of training provided and conflicting priorities were identified as key challenges
- Similarly, among secondary students who indicated they were dissatisfied or very dissatisfied, their primary reason was related to the lack of support or training provided
- Students who provided suggestions indicated that the job description and responsibilities should have been better communicated by employers, and that employers should be assessed for providing a good work environment

Text description of Figure 9
| Students satisfaction level | response share |
|---|---|
| Very satisfied | 58% |
| Satisfied | 31% |
| Neither | 4% |
| Dissatisfied | 1% |
| Very dissatisfied | 5% |
- Source: Complementary exit surveys, Summer 2018
Main finding #2: Over 90% of students indicated that their experience helped them develop key competencies and traits linked to addressing complex challenges and adapting to a changing environment.
One of the program's primarily goals is to ensure that summer work experiences facilitate future transitions from school to work.
To determine the effectiveness of the program, the students' survey had questions that took into considerations skills that meet the needs of a 21st-century marketplace, as presented in the World Economic Forum's model for students and skills. These skills were grouped under three broad categories:
- Foundational Literacies
- Competencies
- Personality Attributes
Roughly half of respondents indicated that their foundational literacies skills, as shown in Figure 10, were further developed during their summer work experience.
Several factors may have influenced students' self-assessment such as their highest level of educational attainment (most respondents had elementary or secondary education), the nature of their tasks and responsibilities, as well as the duration of their work experience.
Students who previously worked part-time prior to their 2018 job placement felt that their literacy and abilities to work with computer or digital technologies were more developed compared to students with little work experience.

Text description of Figure 10
| Foundational skills | Response share |
|---|---|
| Literacy (reading, writing and document use) | 54% |
| Financial literacy | 51% |
| Computer-related or digital technologies | 48% |
| Numeracy | 44% |
- Source: Complementary exit surveys, Summer 2018
According to the World Economic Forum, by developing competencies and personality traits, students would be able to address complex challenges and adapt to a changing environment.
- Based on this conceptual model, competencies include students' abilities to communicate orally, to think critically, to collaborate and to be able to show creativity. These skills are represented in Figure 11.
- The same model refers to personality attributes as students who take initiative, learn from their mistakes, adaptable and able to develop leadership and positive relationships. These personality attributes are represented in Figure 12.
Most students reported that they had the opportunity to develop their competencies and personality traits during their summer work experience.
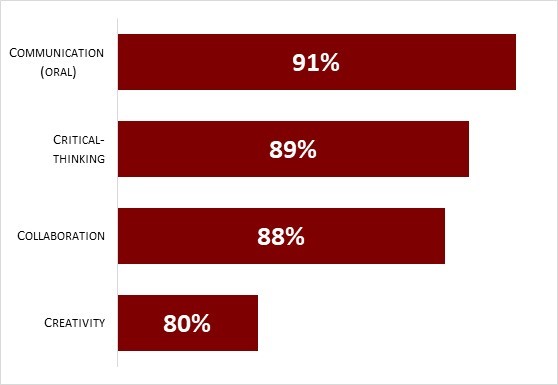
Text description of Figure 11
| Competencies | Response share |
|---|---|
| Communication (oral) | 91% |
| Critical-thinking | 89% |
| Collaboration | 88% |
| Creativity | 80% |
- Source: Complementary exit surveys, Summer 2018
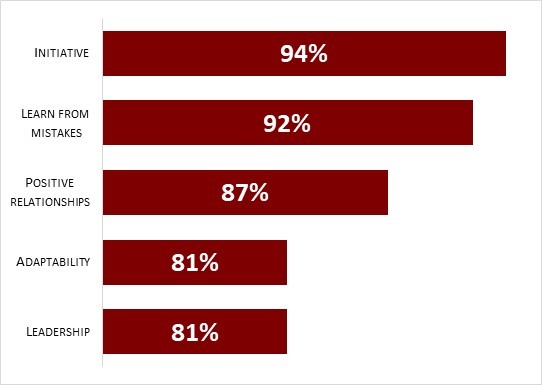
Text description of Figure 12
| Personality attribute | Response share |
|---|---|
| Initiative | 94% |
| Learn from mistakes | 92% |
| Positive relationships | 87% |
| Adaptability | 81% |
| Leadership | 81% |
- Source: Complementary exit surveys, summer 2018
Experiential learning and pathways to employment for Canadian youth
In October 2018, members of the Standing Committee on Human Resources, Skills and Social Development and the Status of Persons with Disabilities (HUMA) tabled a study entitled “Experiential learning and pathways to employment for Canadian youth”.
This study concluded that experiential learning, such as apprenticeships and co-ops, make significant contributions to the development of skills that Canadian youth need to successfully integrate the labour market, and share one key requirement: the close collaboration of employers and unions, educational institutions, governments and community stakeholders.
Most employers provided a career-related work experience that aligned with students' fields of study or provided an early work experience for a high school students.
- Overall 2-in-3 summer students believed they were working in their field of study
- 9-in-10 students who have identified themselves as belonging to an under-represented group—visible minority, Indigenous, or persons with a disability—reported that their summer work experience was in their field of study
According to the administrative data, roughly 3-in-4 employers at the time of application for financial support expressed a preference to hire students with a post-secondary degree and were awarded additional points if the job opportunities had a direct link with the targeted fields of study of the participant.
- Employers located in Atlantic Canada and the three territories hired as many secondary as post-secondary students
One-on-one training was the most prevalent type provided to summer students.
Employers supervising summer students found that students were able to develop key competencies to perform the tasks at hand.
- A number of employer respondents who directly supervised summer students indicated that the students frequently demonstrated initiative, positive relationships, learning from mistakes and strong communication skills
Top five skills employers look for in entry-level hires
- Collaboration / Teamwork / Interpersonal / Relationship-Building Skills
- Communications Skills
- Problem-solving Skills
- Analytical Capabilities
- Resiliency
2018 Survey responses on Labour Market Information
- Though many employers reported that students were provided with career and/or labour market information, most students did not recall receiving information to access the Government of Canada career tool on the Job Bank website
- Among students who have received information, some believed it was useful in helping them make informed decisions about their career or educational choices
- As for the “Are you in Danger” brochure, it made a positive impact on students and increased their level of awareness of health and safety issues in the workplace
A majority of eligible students were in the process of completing their secondary or post-secondary degrees at the time of participation.
- Though the completion of a degree is not mandatory, students must have been registered as a full-time student in the previous academic year and intend to return to school on a full-time basis in the following academic year
- Starting in summer 2019—and outside the evaluation period—the program expanded its eligibility to include all youth aged 15 to 30, and no longer limits the program to students
- Among under-represented groups, most visible minority students had a post-secondary degree at the commencement of the 2018 job placement, and most Indigenous students and students with a disability had a secondary degree
- Based on the 2018 survey, about 9-in-10 students returned to school full-time, while roughly 1-in-10 volunteered for an organization on a full-time basis
For only a small share of students, the work experience consisted of their first job experience.
- As shown in Figure 13, for only about 14% of students the work experience provided was their first job experience.
- Similar shares were found for the summer of 2016 with about 15% of students and the summer of 2017 with about 12% of students.
- Among all students who participated into the program in the summer 2018, the share of participants for whom it was their first job experience were relatively comparable across gender and underrepresented groups. In particular, the work experience was a first work experience for:
- A slightly higher proportion of men relative to women
- A slightly higher proportion of participants who self-identified as a visible minority or a person with disabilities relative to all participants
- Work experiences were generally more likely to be a first work experience for younger students aged between 15 and 19. Students in this age group are more likely to be in high school.
- For instance, in the summer of 2018, work experiences consisted of a first job experience for 29% of participants age between 15 and 19 relative to about 9% for participants age 20 to 24 and 7% for those age 25 to 30.
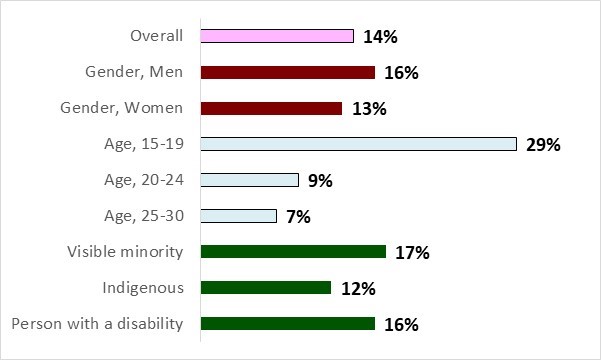
Text description of Figure 13
| Sub-group | Share of first experience |
|---|---|
| Overall | 14% |
| Gender, Men | 16% |
| Gender, Women | 13% |
| Age 15 to 19 | 29% |
| Age 20 to 24 | 9% |
| Age 25 to 30 | 7% |
| Visible minority | 17% |
| Indigenous | 12% |
| Person with a disability | 16% |
- Source: Common System for Grants and Contributions
- Note: Whether the work experience was a first work experience was not specified for about 2% of participants.
Main finding #3: The average duration of work placements provided to students slightly decreased from 2016 to 2018.
As a wage-subsidy program, employers must demonstrate that they provided work experiences for summer students with a view to eventually develop and improve their skills in the labour market.
In addition, employers must commit to provide a duration of 6 to 16 weeks of work experiences.
- As shown in Figure 14, during the summer of 2018, about 47% of work experiences lasted eight to nine weeks. This duration represents the summer breaks that high-school students normally get, starting in late June up to mid-August. This is slightly higher than for the summer of 2016
- In the summer of 2018, about half of post-secondary students who completed the complementary survey recalled being employed beyond the funded period or at least 9 weeks or more. In 2016, more students had work placements of longer duration (that is, 10 weeks or more)
- Most students with a high-school education were satisfied with work experiences lasting up to eight weeks. Most post-secondary students also found the duration of their 2018 summer job placement appropriate
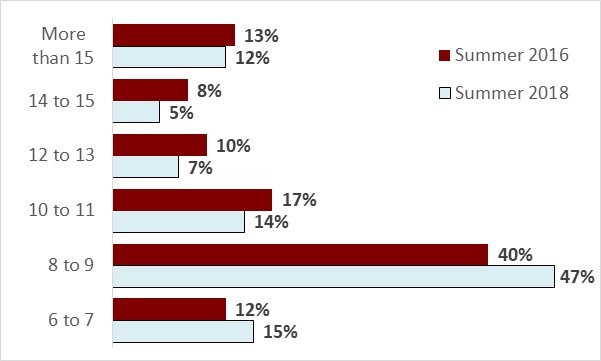
Text description of Figure 14
| Duration (in weeks) | Summer 2018 | Summer 2016 |
|---|---|---|
| 6 to 7 | 15% | 12% |
| 8 to 9 | 47% | 40% |
| 10 to 11 | 14% | 17% |
| 12 to 13 | 7% | 10% |
| 14 to 15 | 5% | 8% |
| More than 15 | 12% | 13% |
- Source: Common System for Grants and Contributions
- Note: Duration, in weeks, is estimated by determining the number of calendar days between the start and end date of a work experience divided by 7 and rounded up to the next integer (for example, 2.4 weeks rounded up to 3 weeks).
Main finding #4: On average, students were paid above the minimum wage in effect in their province or territory and most summer students felt that it helped pay for school expenses.
When asked if earnings from the 2018 summer job helped with school expenses, 8-in-10 students believed that it did.
- In addition to savings from the summer job, students depended on other sources of financial support such as personal savings, parental and family members' support and government student loan
The perception of savings towards school expenses varied by education level.
- As shown in Figure 16, the largest share of post-secondary students (40%) saved between 25% and 49% of their earnings towards their school expenses while the largest share of secondary students (33%) saved less than 25% of their earnings

Text description of Figure 15
| Category of funding | share of participants (in percentage) |
|---|---|
| Parental or other family members support, including spouse or partner | 59% |
| Savings from 2018 summer work placement | 57% |
| Government student loan | 39% |
| Personal savings | 35% |
- Note: Students may have selected more than one source of funding for school expenses.
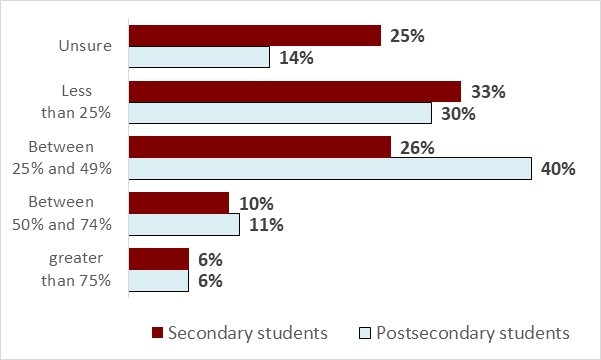
Text description of Figure 16
| Estimated savings | Postsecondary students | Secondary students |
|---|---|---|
| greater than 75% | 6% | 6% |
| Between 50% and 74% | 11% | 10% |
| Between 25% and 49% | 40% | 26% |
| Less than 25% | 30% | 33% |
| Unsure | 14% | 25% |
- Source: Complementary exit survey, summer 2018
Employers participating to the program generally offered students an hourly rate above the minimum wage set by provinces and territories.
Figure 17 reports an actual average hourly wage consistently higher than the minimum hourly wage set by provinces and territories. This figure is showing that employers were more inclined to offer a higher hourly rate to students.
According to the administrative data, employers in the North region — the Northwest Territories, Nunavut and Yukon — were predominantly not-for-profit organizations and were subsidized up to 100% of the minimum hourly wage by the program. This may explain, in part, why relatively higher hourly rates of pay were observed in the North region, along side their unique labour market conditions.
- For example, employers participating to the program in the North have offered students an average of about $18.00 per hour rather than a minimum wage ranging from $11.32 to $13.00 per hour
A majority of employers in the Atlantic region were predominantly from the public and private sectors with a subsidy up to 50% of the minimum hourly wage. Despite a lower subsidy, participating employers in this region offered students an average hourly rate of pay above the minimum wage.

Text description of Figure 17
| Province / Territory | Minimum wage (as of November 2017) |
Average hourly rate (summer 2018) |
|---|---|---|
| Northwest Territories | $12.50 | $18.73 |
| Nunavut | $13.00 | $18.00 |
| Yukon | $11.32 | $17.08 |
| British-Columbia | $11.35 | $14.44 |
| Alberta | $13.60 | $15.53 |
| Saskatchewan | $10.96 | $13.92 |
| Manitoba | $11.15 | $12.53 |
| Ontario | $14.00 | $14.64 |
| Québec | $11.25 | $13.02 |
| Prince-Edward-Island | $11.25 | $12.65 |
| New-Brunswick | $11.00 | $12.03 |
| Nova-Scotia | $10.85 | $12.00 |
| Newfoundland-and-Labrador | $11.00 | $11.55 |
- Source: Common System for Grants and Contributions
As shown in Figure 18, among all students who participated into the program in the summer 2018, the average hourly rates of pay were relatively comparable across gender, age groups and by sector. In particular:
- Women and men earned about the same
- Students who were under the age of 20, earned less than their older counterparts
- The rates of pay of students working in the not-for-profit sector were lower compared with those earned by students working in the private or public sector
In fact, the variation observed across gender, age groups and by sector (ranging from $13.13 per hour to $14.39 per hour) is significantly narrower compared to the one observed across provinces and territories (see Figure 17).
- The hourly rates of pay ranged between $11.55 per hour in Newfoundland and Labrador and $15.53 in Alberta
- In the North, the hourly rates of pay ranged between $17.08 in Yukon and $18.73 in the Northwest territories

Text description of Figure 18
| Sub-group | Hourly rate |
|---|---|
| Overall | $13.85 |
| Gender, Men | $13.85 |
| Gender, Women | $13.86 |
| Age 15 to 19 | $13.13 |
| Age 20 to 24 | $14.06 |
| Age 25 to 30 | $14.39 |
| Sector, not-for-profit | $13.71 |
| Sector, private | $14.18 |
| Sector, public | $14.35 |
- Source: Common System for Grants and Contributions
- Note: Excludes the few instances where the hourly rate of pay is less than $10 per hour.
Participating students earned, on average, a total of about $4,205 from their summer work placement (See Figure 19, for 2018 job placements).
- The average summer earnings are estimated using information provided by the organization on the work placement (that is, hourly rates of pay, the number of weekly hours per week and the duration of the work placement in weeks).
From a gender perspective, the estimated average summer earnings of men and women was roughly comparable, with men earning slightly more than women.
On the other hand, the summer earnings of students who were under the age of 20 were relatively lower than those of their older counterparts, consistent with the shorter summer breaks of secondary students.
Similarly, the estimated summer earnings of students who found a work placement in the not-for profit sector ($3,940) was lower compared with students who found a work placement in the private ($4,995) or public sector ($4,950).
As for the hourly rates of pay, there was a significant variation in the estimated average summer earnings of students depending on their province/territory of residence (not shown on the chart).
- Estimated average summer earnings varied between about $2,700 in Newfoundland and Labrador and about $5,645 in Alberta, while they ranged between $6,895 (Northwest Territories) and $7,445 (Nunavut) in the North.

Text description of Figure 19
| Sub-group | Average earnings |
|---|---|
| Overall | $4,205 |
| Gender, Men | $4,295 |
| Gender, Women | $4,160 |
| Age 15 to 19 | $3,460 |
| Age 20 to 24 | $4,425 |
| Age 25 to 30 | $4,705 |
| Sector, not-for-profit | $3,940 |
| Sector, private | $4,995 |
| Sector, public | $4,950 |
- Source: Common System for Grants and Contributions
- Note: Work experiences for which the start date and end date were unknown are excluded. Average summer earning are rounded to the nearest 5. For estimation purposes, average summer earnings were calculated for summer jobs with weekly hours ranging from 30 to 40 hours.
Canada Summer Jobs program co-exist with similar summer work programs in provinces and territories.
A review of some provincial and territorial government programs aimed at supporting youth employment and skills development during summer period indicates that though the Canada Summer Jobs program appears to overlap with others being delivered by some provinces and territories. Canada Summer Jobs has some unique aspects including, but not limited to, hiring students to support communities in acting on local and national priorities.
| Program title |
Province/territory |
Eligible employers |
Duration |
Wage contribution |
|---|---|---|---|---|
| Student Summer Employment Programs (Secondary and Post-Secondary) | Newfoundland and Labrador | Not-for-Profit (NFP) organizations; public sector | 4 to 12 weeks | For NFP and the public sector, the province covers 100% of its minimum wage and provides an additional 15% to help with mandatory employment related costs. For the private sector, the province covers up to 50% of its minimum wage. |
| Student Summer Skill Incentive | Nova Scotia | NFP organizations | 8 to 14 weeks | In early 2019, the province subsidized $8.85 per hour for wages paid to student employees. The minimum wage was $10.70. |
| Summer Experience Program | Ontario | NFP organizations, Public and Private sectors | Minimum 7 weeks | Employer must pay the student employee at least the applicable Ontario minimum wage and the maximum funding per position was capped at $3,658 in 2018. |
| Summer Temporary Employment Program | Alberta | NFP organizations; Public and Private sectors | 4 to 16 weeks | Employer must pay the student employee at least the applicable Alberta minimum wage; The province will provide a wage subsidy of $7 per hour for a minimum of 30 hours per week and for a maximum of 37.5 hours per week. The minimum wage was $12.20. |
| Student Training and Employment Program | Yukon | NFP organizations; Public and Private sectors | 12 to 16 weeks | The Territory subsidizes $7.20 per hour for 450 to 600 hours of employment. The minimum wage was $11.07. |
Conclusion and recommendation
Canada Summer Jobs program has met its objectives by providing work experiences for students as a wage subsidy program with the participation of not-for-profit, public and private organizations.
Following enhancements announcement Budget 2016, the number of work experiences supported by the program (via a wage subsidy) doubled, from just below 35,000 in summer 2016 to reach over 70,000 in summer 2018. For summer 2018, the total requests for funding was more than three times the program's budget of $215 million. As a result, an employer may have submitted several projects, though only projects meeting all eligibility requirements were recommended by Service Canada for MPs' review.
In general, employers were satisfied with the wage subsidy program and motivated to carry out their corporate social responsibility and to access students. Most employers provided a career related work experience that aligned with students' fields of study or provided an early work experience for high school students. Based on 2018 experience, most (93%) organizations intended to participate again. Still, 1 in 5 employers expressed dissatisfaction with the program, pointing to the late notification of approved projects and perceived too short of duration for work opportunities.
Over 90% of summer students were highly satisfied with the program and generally felt that their work experience provided them with opportunities to improve on specific competencies and traits that will potentially help them to successfully approach complex challenges and to adapt to a changing environment. Still, a small portion of students were dissatisfied or very dissatisfied with the program. For instance, among secondary students who indicated they were dissatisfied or very dissatisfied, their primary reason was related to the lack of support or training provided.
This evaluation report offers the following recommendation:
The department should explore ways to better leverage administrative and participant data to inform policy and design of the program.
Management response / Action plan
Recommendation: Explore ways to better leverage administrative and participant data to inform policy and design of the program.
Management response and action plan
The Canada Summer Jobs program is intended to help young Canadians get the initial job experience and skills to help them transition to the labour market. The longstanding program is also well recognized by not-for-profit and small employers as a way to support summer work demands in their communities.
The evaluation examined the demographic characteristics of student participants and employers, the kind of work experience being provided for student participants through the CSJ and whether or not participants returned to school or were employed after their summer experience. As evidenced from 2018 data, the program is helping youth gain quality work experiences and skills. In 2019, program eligibility for CSJ was expanded to include any youth between 15 and 30, even if they were not students, in order to ensure the program could support youth facing more barriers to employment.
Management agrees with the evaluation recommendation. The data collected through participant surveys and administrative data can be harnessed to inform policy and program design more effectively moving forward. Similarly, insights from the assessment of proposals, jobs funded and the CSJ Employer and Employee Declaration can inform priorities for the following year.
Actions planned
1.1. The Skills and Employment Branch and the Program Operations Branch will collaborate to analyse Employer Employee Declaration and Participants Survey results as well as other sources of administrative data to provide timely information for policy and design of the program (e.g., gender related issues).
Anticipated completion date
Annual assessment of the participant data in November of each year, starting in fall 2020.
1.2. Use findings from annual assessment of proposals and jobs funded to inform priorities for the following year (i.e., address any gaps).
Anticipated completion date
Annual process prior to the launch of the CFP, starting in fall 2020
Annexes
Annex A: Bibliography
Data sources:
- Service Canada. Canada Summer Jobs Survey of Students
- Service Canada. Canada Summer Jobs Survey of Employers
- Employment and Social Development Canada. Administrative data known as the Common System for Grants and Contributions
External sources:
- Alberta Government. Summer Temporary Employment Program. Retrieved from: https://www.alberta.ca/step.aspx
- Business Council of Canada (Spring 2018). Navigating change: 2018 Business Council Skills Survey
- Casner-Lotto, J., & Barrington, L. (2006). Are They Really Ready to Work? Employers' Perspectives on the Basic Knowledge and Applied Skills of New Entrants to the 21st Century US Workforce. Partnership for 21st Century Skills. 1 Massachusetts Avenue NW Suite 700, Washington, DC 20001. Pp.16. Retrieved from: https://www.conference-board.org/publications/publicationdetail.cfm?publicationid=1218
- Conference Board of Canada. Employability Skills. Retrieved from: https://www.conferenceboard.ca/edu/employability-skills.aspx
- Department of Finance Canada. Growing the Middle Class, Budget 2016
- Employment and Social Development Canada. (2016 to 2017). Departmental Results Report
- Employment and Social Development Canada. Canada Summer Jobs: Applicant Guides for 2015, 2016, 2017 and 2018
- Employment and Social Development Canada (2015). Understanding Essential Skills. Retrieved from: https://www.canada.ca/en/employment-social-development/programs/essential-skills/definitions.html
- Horizontal Initiative Database - Open Datasets, information for 2016 to 2017 to 2017 to 2018. Retrieved from: https://www.canada.ca/en/government/system/finances/horizontal-initiatives-database/horizontal-initiative-database-open-datasets.html
- Newfoundland Labrador Government. Student Summer Employment Program High School. Retrieved from: https://www.aesl.gov.nl.ca/students/ssep_high_school.html
- Newfoundland Labrador Government. Student Summer Employment Program Post-Secondary. Retrieved from: https://www.aesl.gov.nl.ca/students/ssep_post_secondary.html
- Nova Scotia Government. Student Summer Skill Incentive (SKILL). Retrieved from: https://novascotia.ca/programs/student-summer-skills-incentive/
- Ontario Government. Summer Experience Program. Retrieved from: http://www.grants.gov.on.ca/GrantsPortal/en/OntarioGrants/GrantOpportunities/OSAPQA005131
- Statistics Canada (2019). A Portrait of Canadian Youth
- World Economic Forum, Industry Agenda. Prepared in collaboration with The Boston Consulting Group. New Vision for Education - Unlocking the Potential of Technology. Retrieved from: https://widgets.weforum.org/nve to 2015/
- Yukon Government. Student Training and Employment Program. Retrieved from: https://yukon.ca/en/doing-business/funding-and-support-business/apply-subsidy-hire-summer-student#apply-for-a-subsidy-to-hire-a-step-student
Annex B: Evaluation approach
The evaluation looks at aspects of the program design and delivery using administrative data and outcomes identified by surveys of participants and participating organizations.
Quantitative lines of evidence are developed using Departmental administrative data from the Common System for Grants and Contributions (CSGC). In addition, two exit surveys were conducted to gain an understanding from both the employers and students perspective.
Document reviewed are listed in Annex A. Where appropriate, these lines of evidence were enriched with other external sources of data and relevant literature to provide context to the analysis.
Data limitations and evaluation considerations
- There was an over-representation of survey respondents with a secondary degree with 72% compared to 21% from the administrative data
- There was an under-representation of participants who self-identified as a member of a visible minority in the survey was 11% compared to 17% from the administrative data
- Age and regions were not always provided by students who responded to the survey
- It is unclear whether employers encouraged summer students to complete their self-assessment or self-identified
- Over 80% of employers who completed the survey did not directly supervise their summer students — limiting their assessment of students' skills development during the 2018 summer work placement
- Given that students were assessing themselves, they may have over-rated or under-rated their foundational skills, competencies and personal attributes
- The fact that employers administered the survey to the youth could introduce a bias, which would translate in higher rate of positive answers from students concerning their summer work placement
Evaluation approach
The overall evaluation approach and methodology rely on administrative data, two surveys from employers and students as well as reviews of internal and external documents. Ideally, surveys results would have complemented information found in the departmental administrative data sources. Yet several factors related to the program design such as national and local priorities that changed from summer to summer, and the way the surveys were administered, made it difficult for the evaluation to rely on a consistent set of data.
Annexes B, C and D provide information on the evaluation approach, data sources, data limitations and evaluation considerations, such as the fact that ESDC collected information from about 20% of summer students, rather than via employers.
Scope
This evaluation looks at aspects of the program design and delivery using administrative data and the outcomes identified by surveys of youth and participating organizations. It uses information collected from late January 2015 (the application deadline for summer 2016) until December 2018, after the summer months to allow for data entries.
Administrative data
Most quantitative analysis found in the report used 2017 to 2018 departmental administrative data to complement with survey results provided by employers and students in 2018.
At the time of this evaluation, more student's information were added to the administrative database as the Department continues to make efforts to improve data collection and analysis.
The summer 2018 surveys
Two key lines of evidence supporting the outcomes-based findings are Service Canada's 2018 employer and student surveys. Past surveys were originally designed as a pilot in 2016 to test the feasibility of administering them online to participants of the program.
- Surveys were sent directly to students by Service Canada using contact information captured via the Employer-Employee Declaration form. Given that the administrative database only captures personal information for only 20% of youth, during these pilots about half of that 20% provided email addresses and therefore response rates for the first three years of the survey were between 8% and 15%.
- To improve response rates, the survey was administered differently via employers in 2018. This approach resulted in significant improvements to both the sample size and the response rate (38%), albeit reducing comparability across surveys. In fact, 2018 was also the first year that employers were invited to complete a complementary survey.
Annex C: Surveys
Background
Initially starting in 2015, the survey was designed in order to get more information about the program year over year, and was not necessarily intended to be used as the sole source for an evaluation of the program.
Students from summers 2015, 2016 and 2017 were solicited to provide feedback.
Sampling for this survey was limited as Service Canada only had access to 20% of the all students and the survey was administered by sending directly to summer students using email address provided to the employers as the primary contact with Service Canada.
Survey response rates were also low. The response rates for 2015, 2016 and 2017 were 14.3%, 8.2% and 14.6%, respectively.
Due to these significantly lower response rates, this evaluation excluded survey results for summers 2015, 2016 and 2017 to rely on survey results collected for summer 2018.
- This exclusion reflects a consideration that was brought to members of the Performance and Evaluation Committee in October 2017 during the approval of the evaluability assessment of the Youth Employment Strategy
Summer 2018 surveys
For summer 2018, Service Canada changed the way it administered the surveys. Service Canada sent two survey questionnaires to 25,100 participating employers. Employers were expected to send the students' questionnaire to all participating students in their organization for a self-assessment at the end of the work term.
For summer 2018, it was the first time that employers were surveyed with students.
As such, this evaluation is based on survey results collected from:
- the questionnaire designed for the employers
- the questionnaire designed for students to assess themselves
About 9,400 employers responded to the employer survey (37% response rate) and approximately 22,600 students responded the student survey (38% response rate).
Page details
- Date modified: