2015-16 Management Accountability Framework government-wide report
Table of Contents
Introduction
Established in 2003, the Management Accountability Framework (MAF) is a framework of excellence for management in the public sector that also functions as a framework for Treasury Board policy expectations. The MAF assessment by the Treasury Board of Canada Secretariat (TBS) involves an annual review of management practices and performance in most large and small departments and agencies across the federal government.
A renewed MAF was launched in 2014-15 following extensive engagement with Deputy Heads through the Public Sector Management Advisory Committee. MAF 2015-16 was the second year of a three-year cycle.
MAF results provide information about internal services based on composite year-over-year data. TBS uses the results to gain a broad perspective on the state of management practices and challenges in the federal government and to monitor key areas of policy compliance and implementation across government.
The Government-Wide Report provides a summary of the overall results for the departments and agencies that participated in the MAF 2015-16. Thirty-seven large and 23 small departments and agencies (60 in total) participated in the assessment process. In the report, observations are made on each MAF Area of Management (AoM), identifying any cross-cutting trends that came to light through the MAF 2015-16 assessment process. The report also profiles select indicators that were part of the MAF 2015-16 methodologies. The assessment results provide insight into progress on government-wide management priorities and the state of policy implementation in areas such as controls over financial reporting, progress on open government and the management of people and human resources.
The core AoMs are considered central to good management. All organizations participating in the MAF process are assessed annually on four management areas:
- Financial Management;
- People Management;
- Information Management and Information Technology (IM/IT) Management; and
- Management of Integrated Risk, Planning and Performance.
In addition, select organizations are assessed on one or more of the department-specific management areas, when there is a strong alignment between a department’s operations and the AoM:
Small departments and agencies are assessed on a subset of the core AoM indicators and accordingly are only represented in the core AoM sections, while large departments and agencies are profiled throughout the report.
Performance by core area of management
Financial management
Overall observations
Of note, MAF results for Financial Management are generally stable when compared to last year. Significant progress has been observed in the area of internal control management, with close to 80% of organizations having put in place an ongoing monitoring program to support the effectiveness of their internal controls over financial reporting, compared to only 44% last year.
Areas requiring government-wide improvement include: the timing of financial system allocation of approved budgets; payment on due date and automatic payment of interest; and the management of accounts receivable.
Key Findings
Resource management
Overall adjusted lapse
The lapse amount, as a percentage of annual voted authorities, can provide insight into an organization’s planning, budgeting, monitoring and reporting practices. A lapse refers to the amount of funding on programs that has not been spent. As such, it is an indicator of forecasting and the degree that forecasting guides effective and timely expenditure management decisions. Generally, the lapse is expected to be between 2% and 5% of voted authorities.

Figure 01 - Text version
Adjusted lapse at year-end as a percentage of annual voted authorities for large departments and agencies was:
- 5.4 per cent in the 2011 to 2012 fiscal year;
- 6.0 per cent in the 2012 to 2013 fiscal year;
- 3.8 per cent in the 2013 to 2014 fiscal year; and
- 3.0 per cent in the 2014 to 2015 fiscal year.
Adjusted lapse at year-end as a percentage of annual voted authorities for small departments and agencies was:
- 3.1 per cent in the 2011 to 2012 fiscal year;
- 2.8 per cent in the 2012 to 2013 fiscal year;
- 2.1 per cent in the 2013 to 2014 fiscal year; and
- 2.1 per cent in the 2014 to 2015 fiscal year.
The amount of funds lapsed at year-end has continued to decline for large departments and agencies (LDAs), dropping from 3.8% of annual voted authorities (in 2013-14) to 3.0% in 2014-15. For small departments and agencies (SDAs), the 2014-15 lapse remained stable at 2.1%.
Operating and grants and contributions adjusted lapses have followed the same three-year downward trend as the overall adjusted lapse, while the Capital adjusted lapse has been rising for the last four years, reaching 7.4% in 2014-15. Overall, the majority of organizations assessed have minimal lapses.
Budget allocations
Earlier access to budget enables managers to plan their program and financial implementation effectively. Department or agency managers should have access to their budget within 30 days of the start of the fiscal year.
MAF results suggest that departmental practices vary. While most departments allocate budgets within 30 days of the start of the fiscal year, several organizations take well beyond 30 days to allocate approved budgets within the financial system to managers with delegated authorities.

Figure 02 - Text version
In 2014, 25 departments and agencies gave approved budgets to their managers at the lowest levels within 30 days, 6 within 60 days and another 6 within 90 days. In 2015, 26 large departments and agencies gave approved budgets to their managers at the lowest levels within 30 days, 7 within 60 days and 4 within 90 days.
Internal control management
Internal controls refer to a set of means that organizations put in place to mitigate risks and provide reasonable assurance in the following broad categories:
- The effectiveness and efficiency of programs, operations and resource management, including safeguarding of assets;
- The reliability of financial reporting; and
- Compliance with legislation, regulations, policies and delegated authorities.
In practice, the set of means that represent internal controls can include those elements of an organization such as its resources, systems, processes, culture, structure and tasks that, taken together, support people in managing risks in order to achieve an organization’s objectives.
Implementation of a risk-based ongoing monitoring program

Figure 03 - Text version
In 2014, 16 organizations answered “Yes” to implementing a risk-based ongoing monitoring program for all 3 control areas, while 20 of the organizations answered “No.” In 2015, 27 large departments or agencies answered “Yes” to having implemented a risk-based ongoing monitoring program for all 3 control areas, while 8 large departments and agencies answered “No.”
There has been a significant improvement in this area, with close to 80% of organizations having put in place an ongoing monitoring program to support the effectiveness of their internal controls over financial reporting, compared to only 44% last year. Organizations that have not yet implemented a risk-based ongoing monitoring program may be facing challenges related to the size and complexity of their organization.
The Treasury Board of Canada Secretariat (TBS) will pursue discussions with organizations to validate their progress and provide specific advice in support of government-wide compliance.
Payments to suppliers
The Treasury Board Directive on Payment Requisitioning and Cheque Control requires that suppliers of goods and services are paid on the due date and that interest is paid on payments made later than the due date. The late payment of invoices is an issue that negatively impacts suppliers and, in particular, small businesses.
This is an area requiring government-wide improvement. Only a small number of departments pay their suppliers on time at least 98% of the time and several organizations do not automatically pay interest.
To increase the number of organizations that automatically pay interest, TBS will work with organizations to enable the automatic payment of interest functionality within departmental financial systems.
Outstanding accounts receivables
The outstanding accounts receivables represent debts due to the Crown excluding debts classified in other sections of the Public Accounts of Canada such as taxes receivable.
The Treasury Board Directive on Receivables Management requires that departments recognize and record all receivable transactions in departmental accounts and the Public Accounts of Canada and take appropriate, timely and cost-effective collection actions or debt deletions when the receivable is not settled in full. The aging of accounts receivable indicates the length of time that money has been owed to the Crown.
This is the first year for this MAF indicator, with the results serving as a baseline for future year comparison purposes. Of note, 45% of the accounts receivable for LDAs has been outstanding for more than 365 days (17% for SDAs); representing $1.6B.

Figure 04 - Text version
For large departments and agencies:
- 36 per cent of accounts receivable had been outstanding for 0 to 30 days,
- 5 per cent had been outstanding for 31 to 60 days;
- 4 per cent had been outstanding for 61 to 90 days;
- 10 per cent had been outstanding for 91 to 365 days; and
- 45 per cent had been outstanding for more than 365 days.
Overall outstanding accounts receivable for large departments and agencies totalled $3.5 billion.
For small departments and agencies:
- 59 per cent of accounts receivable had been outstanding for 0 to 30 days,
- 2 per cent had been outstanding for 31 to 60 days;
- 1 per cent had been outstanding for 61 to 90 days;
- 20 per cent had been outstanding for 91 to 365 days; and
- 17 per cent had been outstanding for more than 365 days.
Overall outstanding accounts receivable for small departments and agencies totalled $90 million.
Reasons vary by departments and include overpayments related to program delivery, defaults in projects funded through repayable contributions, interest owing on loans, and accounts under litigation or legal review. In some instances, recovery of funds is dependent on specific, governing legislation.
Departments are being encouraged to actively pursue the collection of all accounts receivables and to charge interest on overdue accounts. When the debts are deemed uncollectible, departments are encouraged to take timely action in seeking the appropriate authorities for the write-off, remission, forgiveness or waiving of debts. In some instances, program design should be reviewed to ensure that overpayments are minimized.
Transfer payments
In accordance with the Treasury Board Policy on Transfer Payments, transfer payments are transfers of money, goods, services or assets, made on the basis of an appropriation, to a third party, that does not result in the acquisition by the government of any goods, services or assets in return.
Service standards for grant and contribution programs

Figure 05 - Text version
In 2014, 15 organizations answered “Yes” to measuring performance against service standards annually, while 9 answered “No.” In 2015, 18 large departments and agencies answered “Yes” to measuring performance against service standards annually, while 4 answered “No.”
The Treasury Board Policy on Transfer Payments requires departments to establish reasonable and practical service standards for transfer payment programs. A service standard is a public commitment to a measureable level of performance that clients can expect under normal circumstances. Progress on this element has a direct impact on applicants and recipients and is an important part of the Government Action Plan to Reform the Administration of Grant and Contribution Programs.
Almost all departments have established service standards for their transfer payment programs and make them publicly available on the department or agency website. While most measure performance on an annual basis, a few do not.
External financial reporting
Accuracy of financial information
Canadians and parliamentarians expect timely and reliable reporting that provides transparency and accountability for how government spends public funds to achieve results.
Government-wide, the total number of errors identified in the financial information submitted to the Receiver General and the Office of the Comptroller General, for the preparation of the Public Accounts of Canada and the Fiscal Monitor, has declined over the past couple of years. For example, the average number of in-year and year-end post-closing entries for large departments and agencies declined since MAF 2014-15 from 0.95 to 0.57 in MAF 2015-16. For SDAs, this number dropped to 0.35 (from the MAF 2014-15 average of 0.45). Some organizations, however, need to further examine their reporting routines to increase the reliability of the information they provide.
Most Departmental Financial Statements were compliant with the specific reporting requirements for departmental and agency financial statements for the fiscal year ended .
People Management
Overall Observations
Across large and small departments and agencies, implementation of the Directive on Performance Management is progressing well and there has been improvement since last year in meeting the requirements. Most organizations are addressing performance issues however more focussed efforts are needed in managing talent, with less than 75% of employees identified to have a talent management plan having one in place.
There is stability of the executive cadre across the public service as evidenced by the average time at level, in substantive positions and in organizations.
Areas for improvement include the time to staff key vacant positions, which remain very high, at 98.8 days. Furthermore, there is a high variability in the time taken to staff internal AS-01 and EX-01 positions.
Representation and recruitment of members of the visible minority groups are below their availability in the workforce in almost half of large organizations assessed.
Key Findings
Workforce and work culture
Values and Ethics
In addition to serving as the terms and conditions of employment, the Values and Ethics Code for the Public Sector and Organizational Codes of Conduct describe the values and ethical practices that guide decision-making and behaviour for public servants at all levels. Organizations have a responsibility for promoting public sector values and expected behaviours by integrating the codes into activities throughout the organization so that the values become living principles.
All organizations assessed employ multi-faceted approaches to informing employees of the Values and Ethics Code and Organizational Code of Conduct. This includes mandatory training for all employees, the establishment of a values and ethics program and taking administrative or disciplinary measures when values have been breached.
Employee Retention, Mobility and Work Culture
The following chart provides an overview of mobility within and outside of large and small departments and agencies.

Figure 06 - Text version
Total Internal Mobility: Large departments and agencies average internal mobility rate of indeterminate employees for promotions, horizontal transfers and downward movement was 5.4, 5.6 and 0.3, respectively. The average internal mobility rate of indeterminate employees in small departments and agencies for promotions, horizontal transfers and downward movement was 4.3, 4.1 and 0.5, respectively.
Total Outflow: For large departments and agencies, the average mobility rate of indeterminate employees for retirements, deployment to other organizations, and other separations was 2.9, 3.8 and 2.2, respectively. For small departments and agencies, the average mobility rate of indeterminate employees for retirements, deployment to other organizations, and other separations was 2.5, 4.0 and 2.8, respectively.
Total Inflow: For large departments and agencies, average mobility rate of indeterminate employees for deployment from another organization and external hires was 3.8 and 3.4, respectively. For small departments and agencies, the average mobility rate of indeterminate employees for deployment from another organization and external hires was 4.4 and 3.1, respectively.
The average departure rate for LDAs, at 8.9% exceeds the hiring rate of 7.2%. The gap is slightly bigger for SDAs with a departure rate of 9.3% and hiring rate of 7.4%. Departures are mainly due to deployments to other organizations and retirements, while hiring rates include deployments from other organizations and external hires.
For large departments, the promotion rate is 5.4% and the rate of lateral transfers is 5.6%. For SDAs the promotion rate is 4.3% and the rate of lateral transfers is 4.1%. Mobility within organizations supports agility in the workforce and enables rapid deployment and access to skills and expertise to respond to emerging needs. Planned mobility in the context of talent management, strategic workforce planning and informed employee career paths is a best practice as it contributes to broadening employees’ perspectives, improving workforce capability and strengthening workforce management practices, while ensuring that the right people are placed in the right job at the right time.
Sick Leave
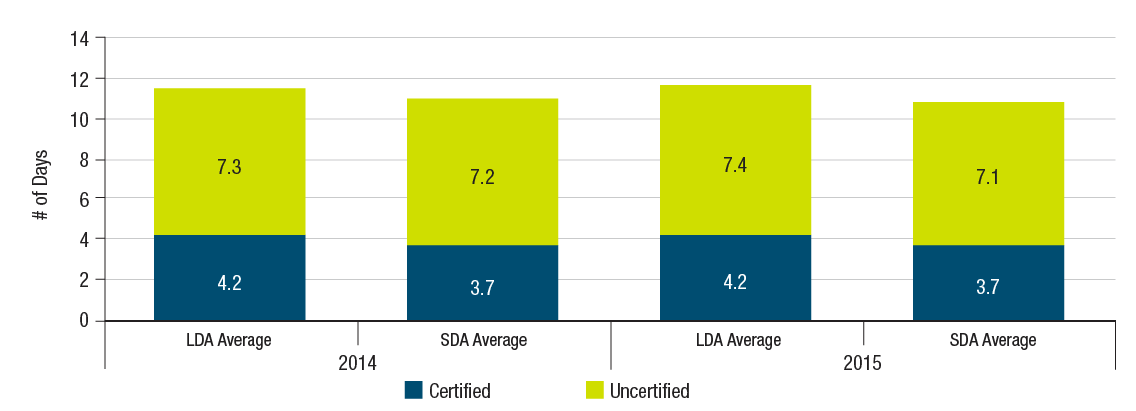
Figure 07 - Text version
In 2014, the average number of paid certified and paid uncertified sick days per full-time equivalent was 4.2 and 7.3 days for large departments and agencies, respectively. For small departments and agencies, the average number of paid certified and paid uncertified sick days per full-time equivalent was 3.7 and 7.2 days, respectively.
In 2015, average number of paid certified and paid uncertified sick days per full-time equivalent for large departments and agencies was 4.2 and 7.4 days, respectively. For small departments and agencies, the average number of paid certified and paid uncertified sick days per full-time equivalent was 3.7 and 7.1 days, respectively.
The average number of paid sick days has remained stable for both large and small departments and agencies compared with the previous year. SDAs have a slightly lower average of 10.8 days, while the LDA average is 11.6 days.
Succession planning and employment equity
Vacancy Rate
The number of days key positions remain vacant provides an indication of the effectiveness of succession planning practices in departments and agencies. Across government, the average number of days that key positions remain vacant is high, at 98.8 days.
Employment Equity Representation, Recruitment, Promotion, and Turnover of Designated Groups
The Employment Equity Act requires employers to monitor and, where necessary, enhance the representativeness of its workforce for the four designated groups: women, Aboriginal peoples, persons with disabilities, and visible minorities. Workforce availability (WFA) estimates allow federal organizations to compare the representation of the employment equity designated groups in their organizations with the WFA by designated group in the labour pool from which they can recruit.
For federal public service purposes, WFA is based on the population of Canadian citizens who are active in the workforce and work in those occupations that correspond to the occupations in the public service. The estimates are derived from the 2011 National Household Survey and the 2012 Canadian Survey on Disabilities. As a result of these new figures, the evaluation of the representation of designated groups in departments has changed since last year.
Overall representation and recruitment for women and Aboriginal people exceed their availability in the workforce in over 75% of organizations assessed. The representation of persons with disabilities also exceeds their availability in the workforce in 85% of the organizations assessed. In some departments, however, Aboriginal peoples and persons with disabilities are under-represented.
In almost half of the LDAs assessed, the representation and recruitment of members of the visible minority group are below their availability in the workforce.
Leadership and employee engagement
The depth and breadth of the knowledge and experience of executives has an impact on their ability to deliver on government priorities as well as on their organization’s mandate. The following leadership measures provide information on the stability of the executive cadre in an organization.
Performance Management, Talent Management and Employee Learning
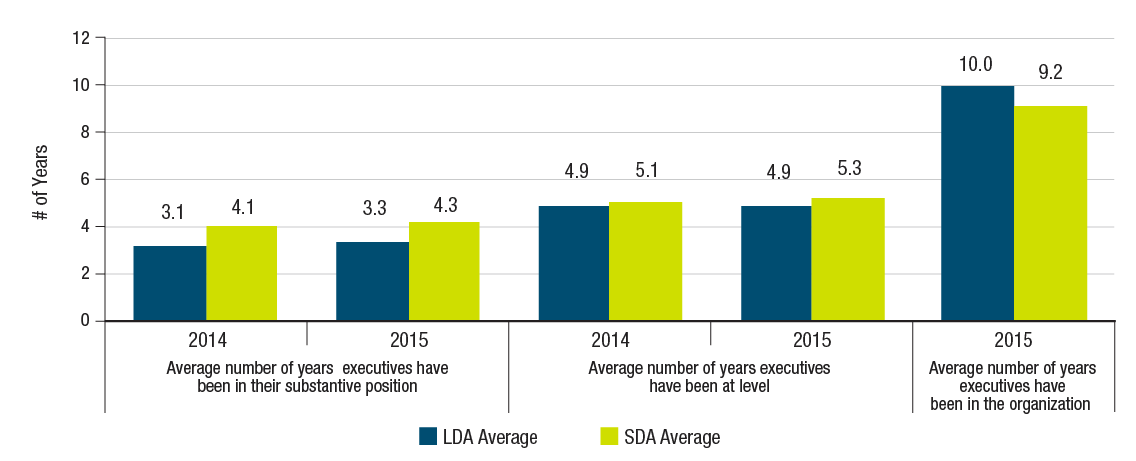
Figure 08 - Text version
In 2014, the average number of years executives have been in their substantive position in large departments/agencies and small departments/agencies was 3.1 and 4.1 years, respectively. In 2015, the average number of years executives have been in their substantive position in large departments/agencies and small departments/agencies was 3.3 and 4.3 years, respectively.
In 2014, the average number of years executives have been at level in large departments/ agencies and small departments/agencies was 4.9 and 5.1 years, respectively. In 2015, the average number of years executives have been at level in large departments/agencies and small departments/agencies was 4.9 and 5.3 years, respectively.
In 2015, the average number of years executives have been in the organization in large departments/agencies and small departments/agencies was 10 and 9.2 years, respectively.
Performance Management helps employees understand their individual contribution to the business objectives of the government. It is a comprehensive approach that includes setting commitments, performance objectives and expected behaviours, assessing results, and providing continuous feedback and coaching. An effective performance management program aligns individual work with departmental and government-wide strategic and operational goals where strong performance is recognized and unsatisfactory performance is addressed promptly.
The Directive on Performance Management, effective , requires all employees to have documentation setting performance objectives, a learning plan, a mid-year conversation and a completed annual written performance assessment. Successful performance management facilitates the effective delivery of strategic and operational goals.
Overall, implementation of the Directive is progressing well. In large departments, employees with documentation setting performance objectives rose from 89% in 2014-15 to 94% in 2015-16. Eighty-five percent of LDA (87% of SDA) employees have a completed annual written performance assessment.
While most organizations are managing employee performance, greater efforts should be focused towards managing talent government-wide, as only 72% of employees identified to have a talent management plan have one in place. Addressing performance and managing talent in organizations contributes to supporting a skilled, agile and competent workforce.
Service standards
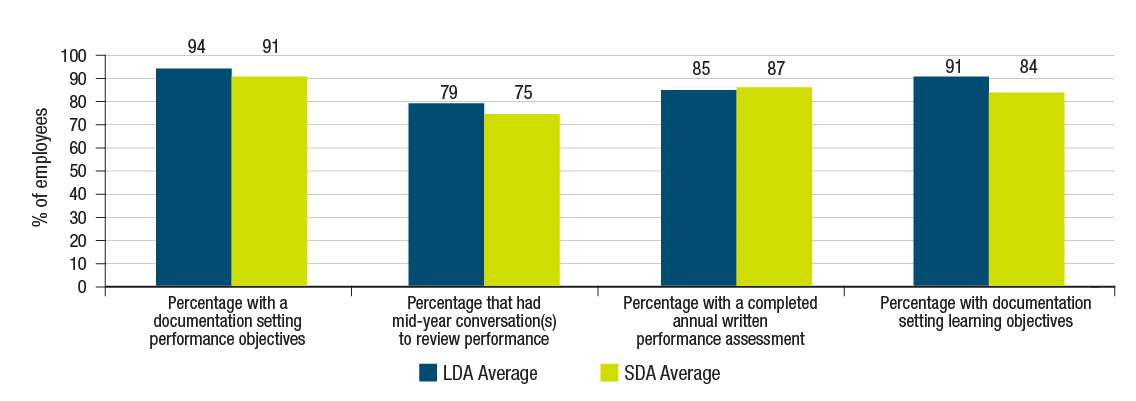
Figure 09 - Text version
The average number of large department/agency and small department/ agency employees with documentation setting performance objectives was 94 and 91 per cent, respectively.
The average number of large departments/agencies and small departments/agencies employees that had mid-year conversations to review performance was 79 and 75 per cent, respectively.
The average number of large departments/agencies and small departments/agencies employees with a completed annual written performance assessment was 85 and 87 per cent, respectively.
The average number of large departments/agencies and small departments/agencies employees with documentation setting learning objectives was 91 and 84 per cent, respectively.
With multiple transformational changes in people management and HR occurring simultaneously, sustained and coordinated efforts will be required to continue shifting the focus of HR to strategic, value-added activities, while maximizing efficiencies. Service standards are essential for maintaining efficient and effective client-centred services that support the achievement of program delivery objectives.
Time to staff an AS-01 and EX-01
The time to staff measure represents the average number of days elapsed between the day the HR division was contacted to initiate the staffing action to the day the letter of offer was issued for staffing of positions.
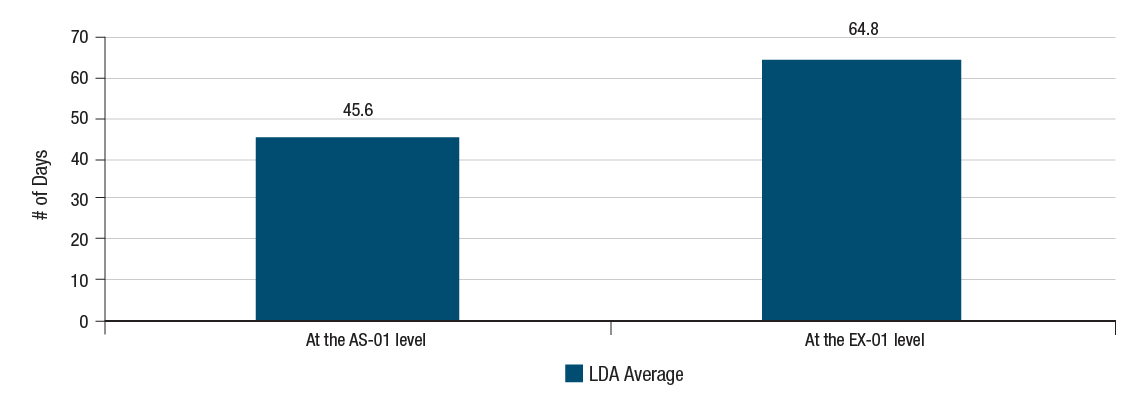
Figure 10 - Text version
For large departments and agencies, the average number of days taken to staff indeterminately a vacant position using an internal hiring process at the AS-01 level was 45.6 days.
For large departments and agencies, the average number of days taken to staff indeterminately a vacant position using an internal hiring process at the EX-01 level was 64.8 days.
Across government, there are standard requirements for entry level AS-01 and EX-01 positions (employees occupying positions in the Administrative Services and Executive Group, respectively), making their staffing times more comparable.
The average number of days to staff an AS-01 is 45.6 days and 64.8 days for an EX-01.
Information Management and Information Technology (IM/IT) Management
Overall Observations
Recordkeeping maturity is improving across the government with 24 departments reporting compliance or near compliance to the Directive on Recordkeeping (compared to 10 last year).
While departments are managing their paper information resources well, there is much progress to be made with managing information in a digital environment. Designated corporate repositories are not being used to manage unstructured electronic information. Consequently, departments are not completing planned electronic disposition activities resulting in holdings that are growing. Progress on implementing Enterprise Priority Initiatives (including Email transformation, My GCHR and GCDOCS) across the government is limited. This is a reflection of the relatively early stage of most initiatives and timelines that are not fully within departmental control.
Most departments are well positioned to move forward on the Directive on Open Government, with 244, 605 datasets available on open.canada.ca.
Key Findings
IM Stewardship
The Directive on Recordkeeping aims to ensure that departments create, acquire, capture, manage and protect the integrity of information resources of business value in the delivery of Government of Canada programs and services.
Recordkeeping Maturity
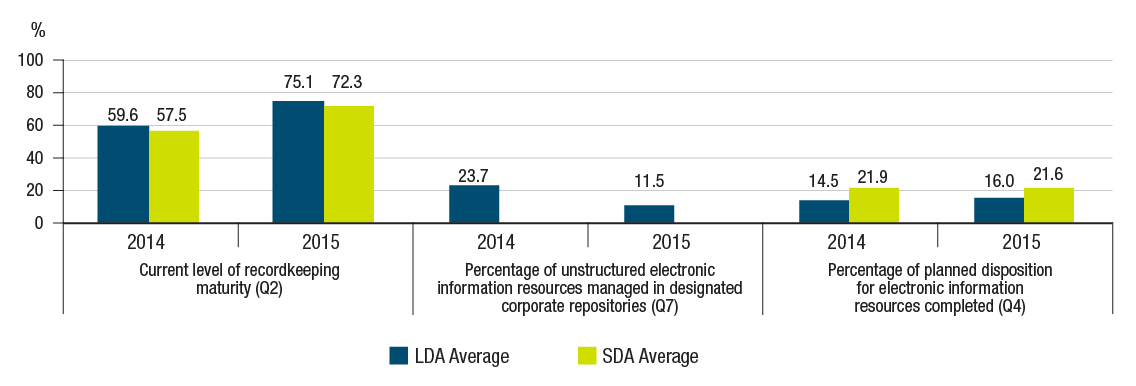
Figure 11 - Text version
In 2014, the average current level of recordkeeping maturity for large departments/agencies and small departments/agencies was 59.6 and 57.5 per cent, respectively. In 2015, the average level of maturity for large departments/agencies and small departments/agencies was 75.1 and 72.3 per cent, respectively.
Average percentage of unstructured electronic information resources that were managed in designated corporate repositories for large departments and agencies was 23.7 per cent in 2014 and 11.5 per cent in 2015.
The average percentage of planned disposition for electronic information resources completed in 2014 was 14.5 per cent for large departments and agencies and 21.9 per cent for small departments and agencies. In 2015, the average for large departments and agencies was 16 per cent, and the average for small departments and agencies was 21.6 per cent.
There has been a significant increase in compliance to the Directive, with the 2015-16 level of maturity at 75% for large departments and 72% for small departments compared to 60% (LDAs) and 58% (SDAs) in 2014-15.
Designated Corporate Repositories
Designated corporate repositories support departmental recordkeeping requirements throughout the information life cycle. A repository is a preservation environment for information resources of business value. It includes specified physical or electronic storage space and the associated infrastructure required for its maintenance. Business rules for the management of the information resources captured in a repository (ies) need to be established, and there must be sufficient control for the resources to be authentic, reliable, accessible and usable on a continuing basis.
The Directive on Recordkeeping requires that departments identify, establish, implement and maintain repositories in which information resources of business value are stored or preserved in a physical or electronic storage space. Only 12% of LDA unstructured electronic information resources are maintained in designated corporate repositories.
Planned disposition for paper and electronic information resources
Record disposition is the disposal of records which no longer have operational value, either by permitting their destruction (at the discretion of institutions), by requiring their transfer to Library and Archives Canada, or by agreeing to their alienation from the control of the Government of Canada.
Both large and small departments and agencies results for the completion of planned disposition of paper records declined since fiscal year 2013-14, with 43% completed in 2014-15 for LDAs (compared to 50% in 2013-14); and 34% for SDAs completed in 2014-15 (compared to 64% in 2013-14). While departments are managing their paper information resources, they are struggling with managing information in a digital environment. Consequently, electronic holdings are growing. Only 15% of electronic records were disposed of as planned for LDAs, while 22% was completed for SDAs. Implementation of an enterprise-wide solution (such as GCDOCS) will enable improved recordkeeping maturity and support electronic disposition activities.
IM Program/service enablement
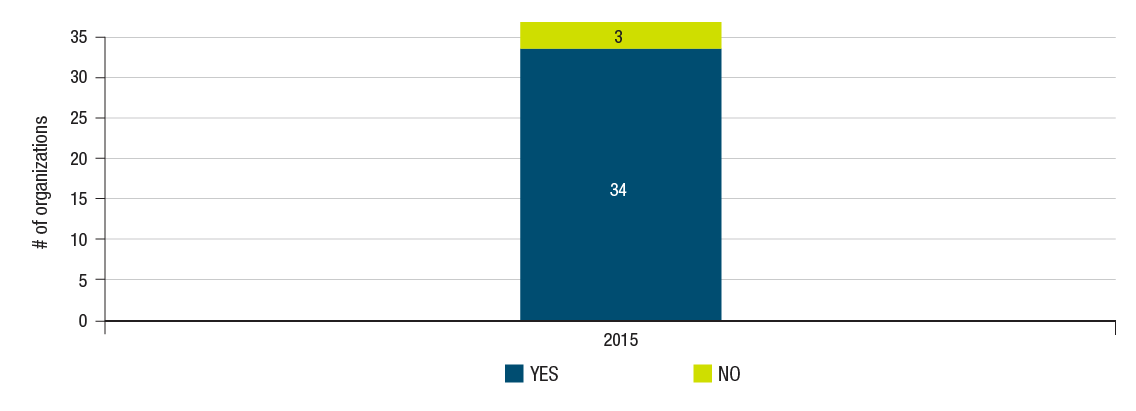
Figure 12 - Text version
Thirty-four large departments and agencies answered “Yes” to having an approved Open Government Implementation Plan, while 3 answered “No.”
The Directive on Open Government requires the development of a departmental Open Government Implementation Plan (OGIP). A key government priority, departments are expected to maximize the release of government information and data of business value to support transparency, accountability, citizen engagement and socio-economic benefits.
Most large departments are well positioned to move forward on the Directive, with 34 LDAs having a plan.
IT Stewardship

Figure 13 - Text version
In 2014, 25 large departments and agencies answered “Yes” and 12 answered “No” to having a sustainability plan for all mission-critical applications in the submitted Information Technology Plan.
In 2015, 27 large departments and agencies answered “Yes” and 5 answered “No” to having a sustainability plan for all mission-critical applications in the submitted Information Technology Plan, while 5 large departments and agencies answered “Not Applicable.”
Effective practices for IT stewardship include maintaining and implementing departmental IT plans, management of IT expenditures and application portfolio management.
While almost all departments have an annual IT plan, report on annual IT expenditures and have an inventory of all applications, a few LDAs lack a sustainability plan for all mission critical applications, which are essential to the operations of a department or agency. Furthermore, a significant number of LDAs do not have a plan to retire end-of-life applications.
For IT projects that require services from Shared Services Canada (SSC), organizations are expected to identify the estimated SSC service costs within their IT Plan. However, 50% of departments are unable to obtain these project costs.
IM/IT Leadership and workforce capacity
Delivering on enterprise transformation and departmental priorities requires leadership and appropriate workplace capacity. Organizations are therefore expected to have a strategic succession plan in place for the position of the Chief Information Officer. However, only 50% of the LDAs indicated, through the Executive Talent Management System, that there is a succession plan in place. Furthermore, only 48% of IM/IT executives completed the IT sub-questionnaire, short of the optimal completion rate of 100% for IM/IT executives.
IT Program/Service Enablement
The Policy on Acceptable Network and Device Use requires deputy heads to ensure that authorized individuals have open access to the internet including Government of Canada and external Web 2.0 tools and services that enhance productivity, communication and collaboration.
While all organizations have access to GCconnex and GCpedia, fewer have access to Google+ (63%) and YouTube (66%).
Enterprise priorities alignment
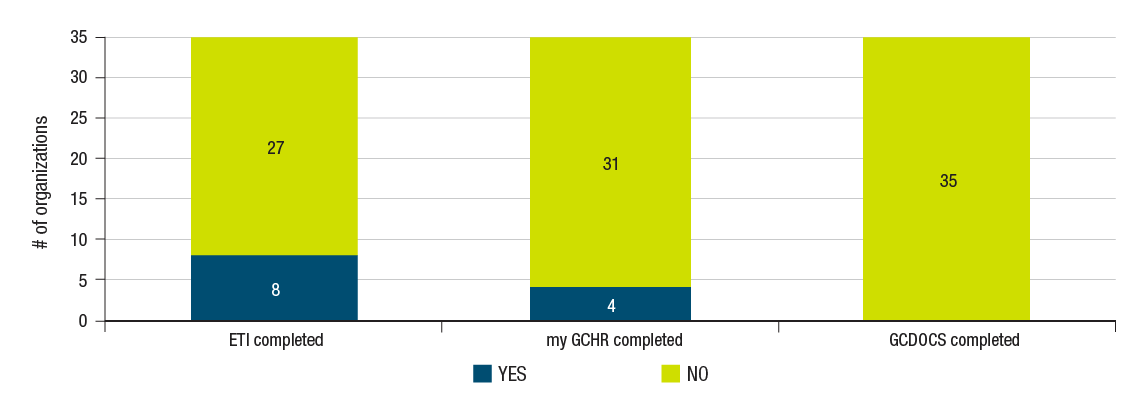
Figure 14 - Text version
Twenty-seven large departments and agencies answered “No” to having the Email Transformation Initiative completed, while 8 answered “Yes.” Thirty-one large departments and agencies answered “No” to having completed MyGCHR, while 4 answered “Yes.” All 35 large departments and agencies answered “No” to having GCDOCS completed.
The Government’s IT modernization agenda is comprised of a number of enterprise-wide initiatives that will result in efficient and effective delivery of programs and services while reducing IT business costs.
Progress on implementing enterprise priority initiatives across the government is limited. This is a reflection of the relatively early stage of most initiatives and timelines that are not fully within departmental control.
Service Performance
Service performance measurement gives an indication of how well IT services are meeting the needs of programs and clients. Below are two service performance indicators for IT covering mean repair times and incident resolution rates. It is the first year that service performance has been looked at as part of the MAF. Consequently, results in this area are expected to improve over the next cycles.
Mean time to repair (MTTR) for workplace technology device related incidents
Organizations should strive for short times to repair workplace technology device related incidents. There is a broad range of mean repair times reported by large departments, ranging from one hour to 284 hours, with an average mean time of 57 hours.
Percentage of incidents resolved by 1st level support for workplace technology device related incidents
Organizations should strive to have a high percentage of incidents resolved by 1st level support for workplace technology device related incidents. On average, 50% of such incidents are resolved by 1st level support.
Management of Integrated Risk, Planning and Performance
Overall Observations
Most departments have Performance Measurement Frameworks (PMFs) that have reached an acceptable level of quality. Departments have made progress in producing trend data on their programs. However, the lack of stability in the performance measures used year-over-year, makes it difficult to assess program performance over time.
While departments make use of performance information to identify risks, establish priorities, support resource allocation decisions, and monitor in-year progress, there is inconsistent and insufficient use of performance information to support Cabinet proposals. Reporting on program results continues to lag behind reporting on expenditures and Full-Time Equivalents (FTEs).
Key Findings
Creation of quality performance information
The Policy on Management Resources and Results Structures has instructions for developing Performance Measurement Frameworks (PMFs) and includes an expectation that PMFs be at an acceptable quality. It is also expected that methodologies be developed for all performance indicators to explain how the indicator will be measured and how to interpret its results.
Most large and small departments and agencies have PMFs of acceptable quality that support trend analysis and managing for results.
Percentage of performance indicators that have methodologies developed
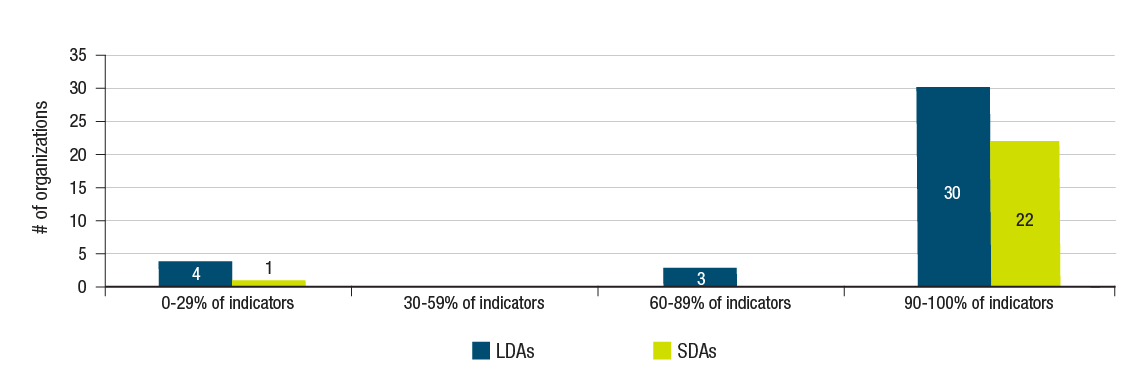
Figure 15 - Text version
For large departments and agencies, 4 have 0 to 29 per cent of performance indicators in the organization’s Performance Measurement Framework that have methodologies developed, 3 have 60 to 89 per cent of indicators developed and 30 have 90 to 100 per cent of indicators developed.
For small departments and agencies, 1 has 0 to 29 per cent of performance indicators in the organization’s Performance Measurement Framework that have methodologies developed, while 22 small departments and agencies have 90 to 100 per cent of indicators developed.
Performance indicators are a qualitative or quantitative means of measuring an output or outcome, with the intention of evaluating the performance of an organization, program, policy or initiative in light of expected results over time.
Almost all (96%) of SDAs and most (81%) LDAs have methodologies developed for 90 to 100% of their performance indicators.
Use of performance information in decision-making
Departments are encouraged to use performance information to inform their planning and resource allocation decisions. This includes taking stock of progress against planned priorities during the year, and ensuring appropriate alignment of risk mitigation strategies and allocation of resources. Performance information should be used to support proposals to Cabinet.
The majority of departments use performance information to identify risks, establish priorities, support resource allocation decisions, and monitor in-year progress. The source of this information is often from internal tools such as databases, dashboards and scorecards.
Use of performance information to support proposals to Cabinet committees

Figure 16 - Text version
Twenty-three large departments and agencies said “Yes” to using performance information on program efficiency and effectiveness to identify risks; 25 large departments and agencies answered “Yes” to establishing priorities; 25 answered “Yes” to supporting decisions on resource allocation; 13 reported using performance information sometimes, but not consistently. None of the large departments and agencies answered “No, performance information is not used.”
Among LDAs, there is inconsistent and insufficient use of performance information from evaluations, PMFs and performance measurement strategies to support Cabinet proposals.
- 41% report that they always use performance information
- 16% report that they always use some performance information (most often from evaluations only)
- 38% report that in some proposals they use performance information; and
- 5% report that they never or almost never use performance information
Internal and external performance reporting

Figure 17 - Text version
For large departments and agencies, 3 had 0 to 29 per cent of indicators from the 2014 to 2015 fiscal year Performance Measurement Framework for which performance data is available to support trend analysis; 5 had 30 to 59 per cent of indicators available; 9 had 60 to 74 per cent of indicators available; 8 had 75 to 89 per cent of indicators available; and 10 had 90 to 100 per cent of indicators available.
For small departments and agencies, 2 organizations had 0 to 29 per cent of indicators from the 2014 to 2015 fiscal year Performance Measurement Framework for which performance data is available to support trend analysis; 6 had 30 to 59 per cent of indicators available; 3 had 60 to 74 per cent of indicators available; 2 had 75 to 89 per cent of indicators available; and 10 had 90 to 100 per cent of indicators available.
Stable performance information and supporting indicators are important to facilitate the collection of historical (year-over-year) trend information on program performance. Trend information demonstrates how well programs have been performing against their intended results over time. This information also facilitates identification of areas requiring improvement and appropriate alignment of resources. Since MAF 2014-15, LDAs and SDAs have made progress in producing performance information to support trend analysis of program results.
Performance by department-specific area of management
Management of acquired services and assets
Overall observations
The ten organizations assessed for Acquired Services and Asset Management represent the top 12 highest spenders, signifying 77% of all federal expenditures on acquired services and assets in 2014-15 ($21.2B out of $27.5B).
Almost all organizations assessed have an up to date investment plan. However, some departments have ongoing challenges with procurement planning. Furthermore, there continue to be system-wide deficiencies with respect to timely reporting on procurement obligations.
Most departments are spending below the recommended minimum on repairs, maintenance and recapitalization which increases the risk of real property assets falling into poor or critical condition.
While there has been a notable, system-wide improvement observed in the procurement and materiel management enrolment rate in certification programs, more efforts are needed to convert enrolments into actual certifications.
Key Findings
Investment planning and management of projects

Figure 18 - Text version
In both 2014 and 2015, 9 large departments and agencies answered “Yes” to having an investment planning process for the allocation of resources at the enterprise level and updating annually, while 1 large department/agency answered “No.”
Departmental investment planning is the function of allocating and reallocating resources to new and existing assets and acquired services that are essential to program delivery.
The Policy on Investment Planning for assets and acquired services requires that investment planning, in terms of governance, systems and people, is in place and maintained. Departmental investment planning is expected to support departmental strategic planning and incorporate a horizontal and government-wide perspective. Further, investment plans should align with outcomes set out in the Management Resources and Results Structure.
Departments that did well last year continued the positive trend in their overall, risk based, integrated investment planning across the enterprise.
A project is an activity or series of activities that has a beginning and an end. A project is required to produce defined outputs and realize specific outcomes in support of a public policy objective, within a clear schedule and resource plan. A project is undertaken within specific time, cost and performance parameters.
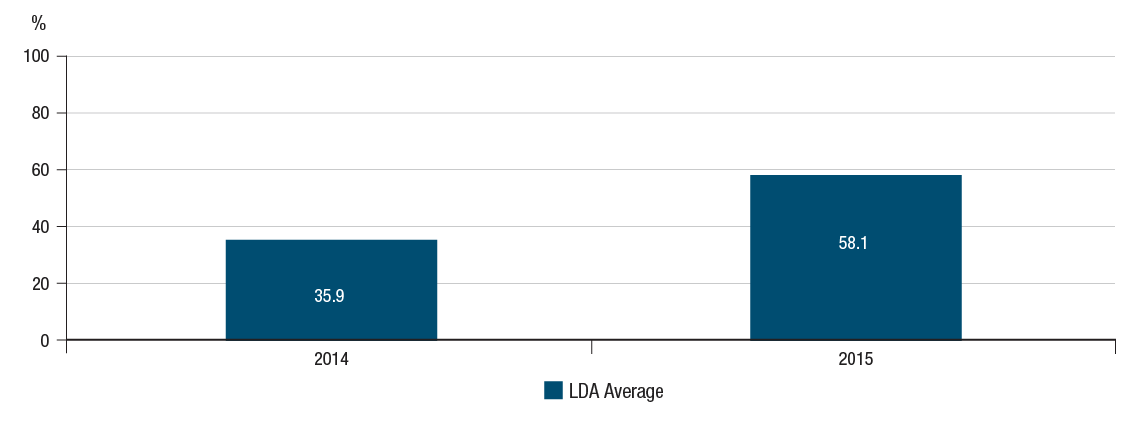
Figure 19 - Text version
In 2014, the average for large departments’ and agencies’ projects that were delivered on time, on scope and on budget was 35.9 per cent, while in 2015 the average for large departments and agencies was 58.1 per cent.
The Policy on the Management of Projects requires that projects are managed in a manner that is consistent with the assessed level of complexity and risk. This includes demonstrating that both knowledgeable, integrated, multi-disciplinary project teams and effective project management systems and processes support the project management function.
It is expected that project outcomes are achieved within time, scope and budget constraints. Departments and agencies are expected to define a methodology to collect and track project performance information.
Each department has their own definition for “on time, on scope, on budget” according to its project management framework. Eight of the 10 departments have a governance process to approve re-baselining of projects.
Procurement
Procurement is the function of obtaining goods and services and carrying out construction and leasing through contractual arrangements. A significant part of investment planning includes procurement – a component that has consistently been identified as a challenge for many departments. Stakeholder engagement and strong planning practices are a necessary step in promoting and improving fair, open and transparent procurement.
Alignment of procurement planning with business plans

Figure 20 - Text version
In both 2014 and 2015, 9 large departments and agencies answered “Yes” to aligning their procurement planning with their business planning activities, while 1 large department/agency answered “No.”
Most departments assessed (nine out of 10) have a procurement governance regime and align their procurement planning with their business planning activities. However four organizations did not complete the procurement plan component of their most recently approved investment plan.
For high risk and complex investments, departments are expected to include detailed descriptions of the procurement strategy that will be used to acquire, maintain and dispose of the asset. The strategy is expected to be in place well in advance of the termination of the service contract. Going forward, TBS will be working with departments to improve this aspect of investment planning.
Reporting on procurement obligations

Figure 21 - Text version
In both 2014 and 2015, 6 large departments and agencies answered “Yes” to reporting in a timely and accurate manner on their procurement obligations, while 4 large departments and agencies answered “No.”
Departments are expected to report on their procurement obligations in a timely and accurate manner. This includes but is not limited to the Procurement Strategy for Aboriginal Business, Comprehensive Land Claim Agreements, Proactive Disclosure and the Purchasing Activity Report.
There continues to be system-wide deficiencies with respect to timely reporting on procurement obligations, particularly with the timely submission of the annual Purchasing Activity Report data.
Contracts over $25K awarded through a competitive bidding process
The Government Contracts Regulations require a competitive approach to soliciting bids before any contract is entered into, with certain exceptions (e.g. contracts under $25K). A best practice is for organizations to have the majority of contracts over $25K awarded through a competitive bidding process.
The MAF 2015-16 average percent of contracts over $25K awarded through competitive bidding remained stable at 84%, the same as for MAF 2014-15 (based on data from the 2014 and 2013 Purchasing Activity ReportsFootnote 1).
Low-dollar acquisitions (under $10K) using acquisition cards
The Directive on Acquisition Cards aims to reduce or eliminate costly and burdensome transaction procurement and payment methods such as the use of Receiver General cheques, requisitions and purchase orders. Acquisition cards can reduce and simplify the procurement process while also offering opportunities for savings. Accordingly, departments should strive to use acquisition cards for low-dollar acquisitions (under $10K).
Fifty-eight percent of low dollar acquisitions were carried out using acquisition cards comparable to 57% last yearFootnote 1.
Contracts that used mandatory and non-mandatory standing offers
The Treasury Board Contracts Directive prescribes the requirement for the mandatory use of certain standing offers. A standing offer is an offer from a potential supplier to supply goods, services or both, on the pricing basis and under the terms and conditions stated in the standing offer. A best practice is to call up against standing offers, as frequently as possible, given this approach promotes transparent and efficient processes.
Twenty-one percent of contracts made use of mandatory and non-mandatory standing offers compared to 27% last yearFootnote 1.
Real property and materiel

Figure 22 - Text version
In 2014, 6 large departments and agencies answered “Yes” to having complete and accurate materiel asset information, while 4 answered “No.” In 2015, 8 large departments and agencies answered “Yes” to having complete and accurate materiel asset information, while 2 answered “No.”
The Policy Framework for the Management of Assets and Acquired Services speaks to optimizing value for money and sound stewardship. Departmental strategies that follow a life-cycle management approach, reflecting direct and indirect costs of assets and services enables affordability, cost effectiveness and performance.
Although there has been a modest improvement since 2014-15, challenges continue for some departments in demonstrating complete and accurate data on real property and materiel asset information. This is fundamental for timely and informed decision making.
Inadequate investment in real property can result in assets that are in poor or critical condition. It is considered a good practice that investment in repair and maintenance and recapitalization be at a minimum of 4% of replacement costs.
Replacement value of real property assets spent annually (in repair, maintenance and recapitalization) to ensure the integrity of these assets
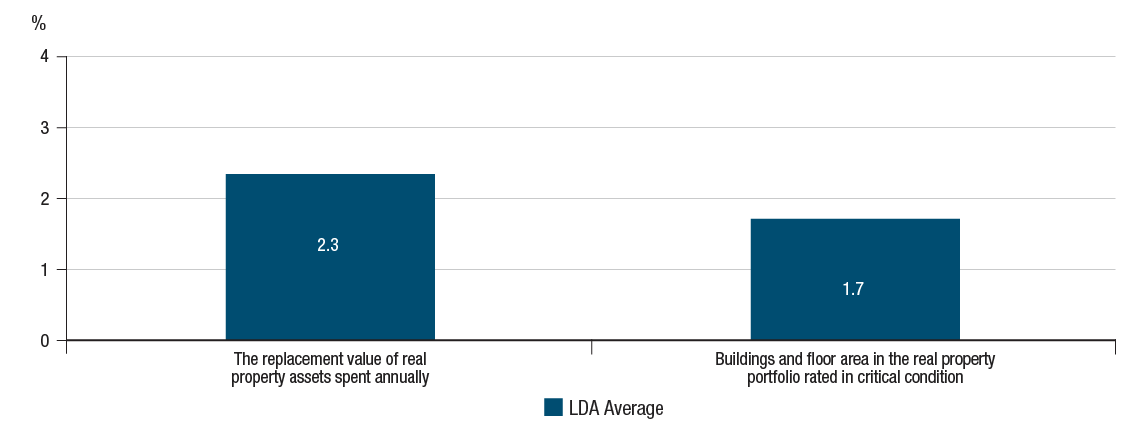
Figure 23 - Text version
The average replacement value of real property assets spent annually is 2.3 per cent for large departments and agencies. For large departments and agencies, the average for buildings and floor area in the real property portfolio that are rated in critical condition is 1.7 per cent.
For seven of the eight departments assessed, the level of funding on repairs, maintenance and recapitalization related to real property was found to be below the recommended minimum of four percent of the estimated replacement cost of the assets. Methods used by departments to calculate this figure needs to be streamlined to strengthen comparability.
Federal departments and agencies are required to report to the Directory of Federal Real Property (DFRP), which is a central inventory for real property data. The structure condition is one of the reporting fields in the DFRP. While the structure condition is not a standardized index, a condition rating of poor typically means that some or all asset systems are compromised or show serious signs of deterioration, and the risk of system failure is likely with high operating and maintenance costs and unplanned maintenance and repairs. A classification of poor or critical theoretically implies that an investment of between 10 and 30% (or more for critical condition) of the replacement cost of the asset is needed to bring the asset to good condition.
Buildings and floor area in the organization’s real property portfolio (Crown-owned and leased) rated in poor and critical condition
The average percentage of real property in poor condition is 14% with a broad range observed across the eight departments assessed from 1.0% to 33.1%. The average for properties in critical condition is much lower, at 2.0%.
Procurement, materiel management and real property communities
Competencies and accreditation for functional communities are key elements for effective talent management. Applying them consistently across government ensures that communities have the knowledge, skills and behaviours to effectively deliver on government priorities. Departments need to be able to demonstrate a more coordinated and comprehensive use of competency-based management for their procurement, materiel management and real property communities.
There has been a notable increase in enrolment in the certification programs for the Procurement and Materiel Management communities since 2014-15, with an overall increase of almost 60% in 2015-16. However departmental efforts should also focus on converting enrolments into actual certifications.
TBS will continue to engage departments to improve the strategic talent management of their procurement, materiel management and real property communities and further develop the MAF question to elicit further evidence of management practices in developing their functional communities.
Security Management
Overall Observations
Of the 20 departments and agencies assessed, there is overall compliance for the indicators examining specific aspects of core security management practices. In particular, most departments were able to demonstrate establishment of an integrated security planning process which considers all programs and services, and the conduct of an annual review of the Departmental Security Plan.
Challenges continue in maintaining up-to-date security risk assessments for facilities with an average across the organizations assessed of 53%. Baseline results for the reporting of cybersecurity incidents highlights a great variance across departments with some not reporting at all and others reporting 100%.
There are some notable improvements since the previous MAF cycle, with an increase of 16% in the percentage of authorized mission critical applications. There is also an increase of 13% in the percentage of facilities with a material residual security deficiency that have approved and funded risk mitigation action plan. In addition, a further uptake (increase of 12%) of the mandatory cyber authentication service has occurred.
Key Findings
Department or agency security management
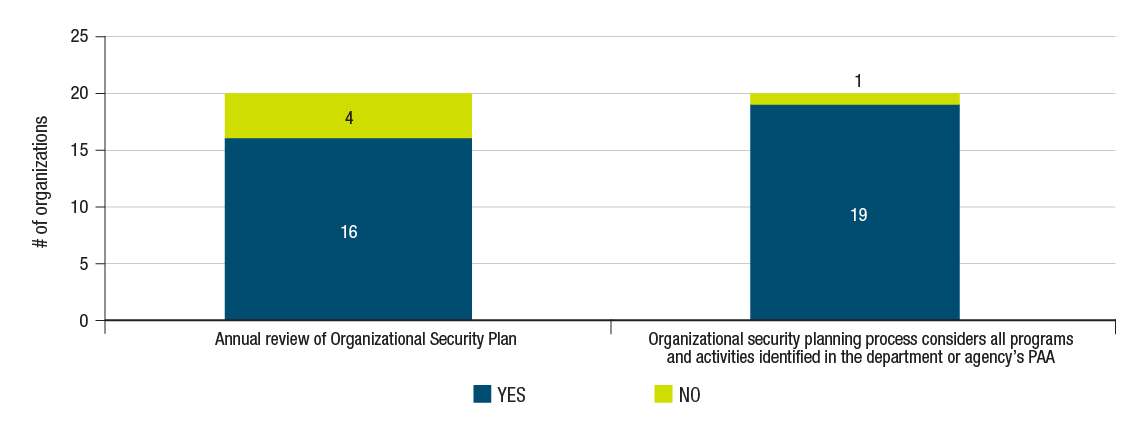
Figure 24 - Text version
Sixteen large departments and agencies answered “Yes” to having an annual review of the Organizational Security Plan, while 4 large departments and agencies answered “No.” Nineteen large departments and agencies answered “Yes” to considering all programs and activities identified in the department or agency’s Program Activity Architecture as part of the organizational security planning process, while 1 large department/agency answered “No.”
The Policy on Government Security requires that the departmental security program is effective and that the goals, strategies and control objectives detailed in the Departmental Security Plan (DSP) remain appropriate to the needs of the department and the government as a whole.
Generally, most departments – 80% – review their DSP annually. Additionally, 95% of departments consider all programs and activities identified in their Program Alignment Architecture (PAA) when developing and maintaining the DSP. The PAA is an inventory of all the programs undertaken by a department. This practice enables identification of unique security risks that may stem from the Department’s mandate and operational context related to the people, assets, information and continuity of its programs and/or services.
Protection of Government of Canada assets and continued program/service delivery
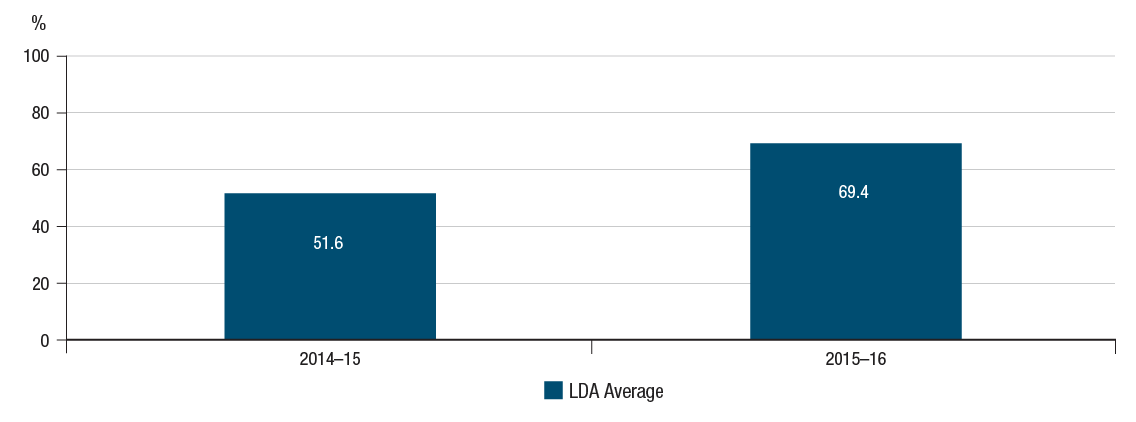
Figure 25 - Text version
In the 2014 to 2015 fiscal year, the average percentage of mission-critical applications in operation that were authorized for operation for large departments and agencies was 51.6 per cent, while the average for the 2015 to 2016 fiscal year was 69.4 per cent.
IT Systems and Applications Security
The Operational Security Standard: Management of Information Technology Security requires departments to continuously manage the security risks to information and IT assets throughout the lifecycle of their programs and services. The formal authorization of applications through which critical services of a department or agency are delivered is a key IT security practice which can mitigate department or agency risk exposure.
The government wide average of mission critical applications currently in operation that have been authorized for production has increased from 52% in 2014-15 to 69% in 2015-16.
Facilities Security Risk Assessments
The Operational Security Standard on Physical Security requires that the external and internal environments of a facility are managed to create conditions that, together with specific physical security controls, reduce the risk of workplace violence, protect against unauthorized access, detect attempted or actual unauthorized access and activate an effective response.
The average for facilities with material residual security deficiencies that have an approved and funded risk mitigation action plan increased to 65% compared to 52% from the previous MAF cycle. However, the average for the assessed department’s or agency’s facilities that have an up-to-date security risk assessment remains low at 53%.
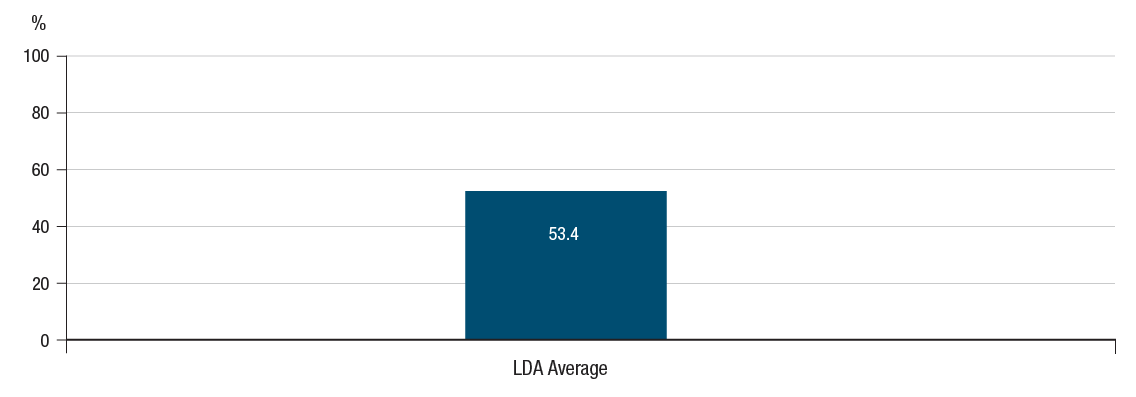
Figure 26 - Text version
For large departments and agencies, an average of 53.4 per cent of facilities have an up-to-date security risk assessment.
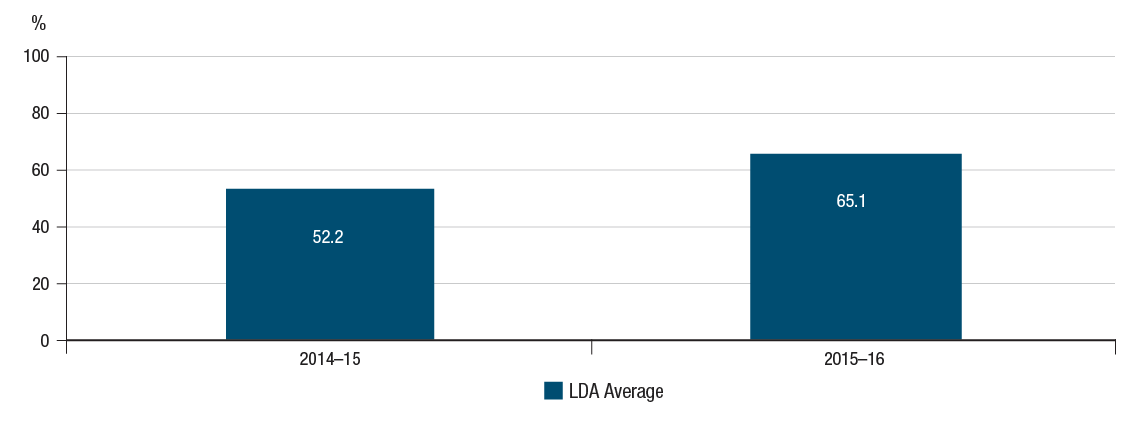
Figure 27 - Text version
In the 2014 to 2015 fiscal year, 52.2 per cent of the facilities for large departments and agencies with material residual security deficiencies had an approved and funded (where required) risk-mitigation action plan. For large departments and agencies, in the 2015 to 2016 fiscal year, 65.1 per cent of the facilities with material residual security deficiencies had an approved and funded (where required) risk-mitigation action plan.
Government of Canada security policy priority alignment
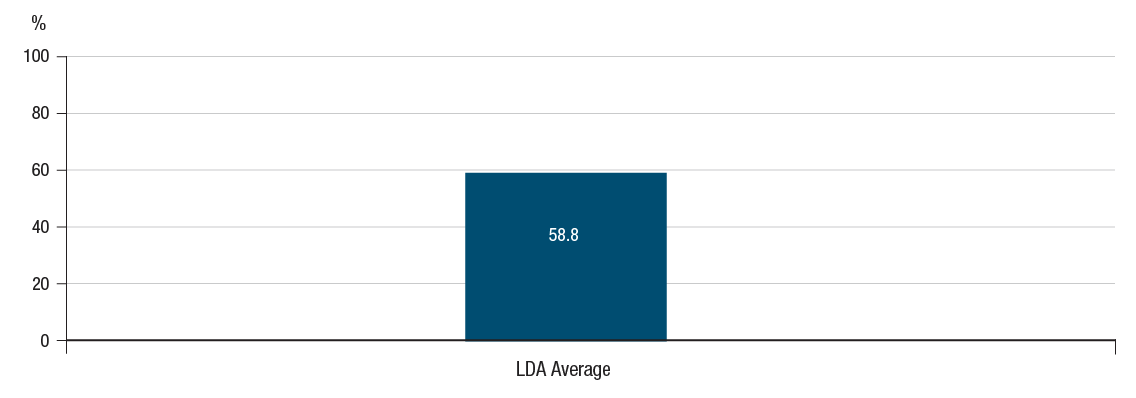
Figure 28 - Text version
For large departments and agencies, the average percentage of recorded cybersecurity incidents reported to the Government of Canada Computer Incident Response Team is 58.8 per cent.
The Government of Canada’s Cyber Security Event Management Plan outlines the stakeholders and actions required to ensure that cyber security events are addressed in a consistent, coordinated and timely fashion government-wide. As part of the reporting requirements outlined in the Plan, departments conduct monitoring and detection activities on department-managed IT infrastructure and notify the Government of Canada Computer Incident Response Team (GC CIRT) upon detection of a cybersecurity event.
On average, 59% of departments and agencies reported their recorded cybersecurity incidents to the GC CIRT.
The use of the External Credential Management service (GCKey/Commercial Broker Service) reduces the duplication of login and passwords and enables secure transactions. The objective of the Directive on Identity Management is to ensure effective identity management practices by outlining requirements to support departments in the establishment, use and validation of identity.
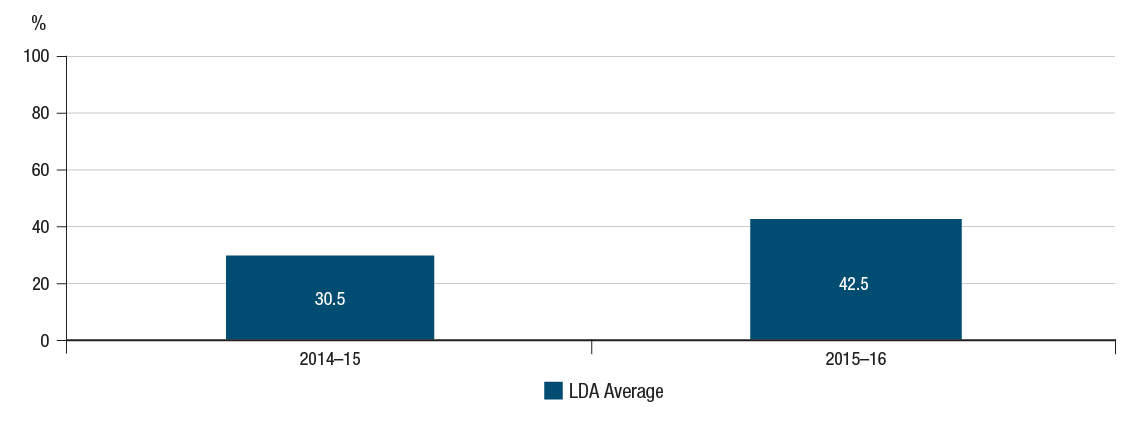
Figure 29 - Text version
In the 2014 to 2015 fiscal year, an average of 30.5 per cent of large departments’ and agencies’ online external services that require a client to sign in with a username and password used the mandatory External Credential Management service, while the average in the 2015 to 2016 fiscal year for large departments and agencies was 42.5 per cent.
In 2015-16, the average for the assessed departments of online external services for businesses or individuals which were identified as requiring a client to sign-in with a username and password that use the mandatory GC cyber authentication service was 43%, an increase of 12% from the previous year. Ensuring that all organizations online external services use the mandatory External Credential Management service demonstrates an alignment with the GC goal to provide consistent user experience, single sign-on, and secure and convenient client access to government online services in a cost efficient manner.
Service Management
Overall Observations
During the reporting period for the 2015-16 MAF exercise, six new requirements of the Policy on Service came into effect for a total of eight. Generally, departments are on track in implementing the policy. All 11 assessed have a service inventory that identifies their priority services and almost all have a corporate-wide multi-year service management strategy.
While most priority services have service standards and most targets are being met, service standards are difficult to access and several departments do not review or update them regularly. Only two departments have real-time performance information for their priority services published on Canada.ca.
Since last year, progress has been made in making more services end-to-end e-enabled. However, significant effort is required to make more services e-enabled and in engaging clients to promote their availability.
Key Findings
Service stewardship
The Policy on Service requires that a multi-year corporate-wide departmental service management strategy be developed and implemented in alignment with the Government’s service direction, and that progress be measured annually.

Figure 30 - Text version
In 2015, 9 large departments and agencies answered “Yes” to having a multi-year, corporate-wide service management strategy that is approved by the deputy head, while 2 answered “No.”
For the eleven departments assessed, most departments (9/11 or 82%) have a corporate-wide multi-year service management strategy in place. This practice indicates that the majority of departments have an integrated, multi-year plan for service improvement that has been endorsed by the organization’s senior management.
Performance monitoring
Service Standards
The Policy on Service requires that service standards and real-time service delivery performance information for priority services be available to clients on Canada.ca for external services and on internal collaborative tools for internal enterprise services.
A priority service is determined by each department considering one or more of the following: volume (e.g. transactions per year), importance of service to clients (e.g. entitlements, permits, benefits, authorizations, mission-critical services), use of sensitive personal or commercial information, cost-benefit analysis and affordability.
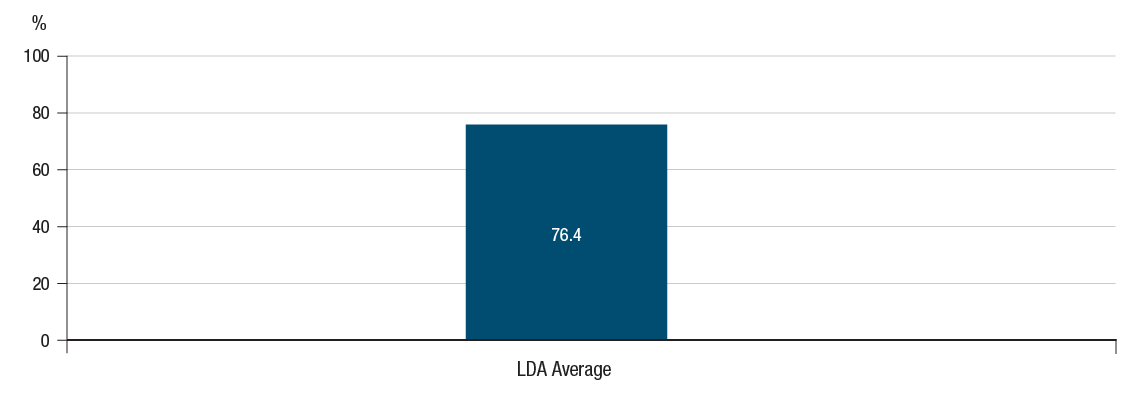
Figure 31 - Text version
On average, 76.4 per cent of large departments’ and agencies’ priority services have service standards.
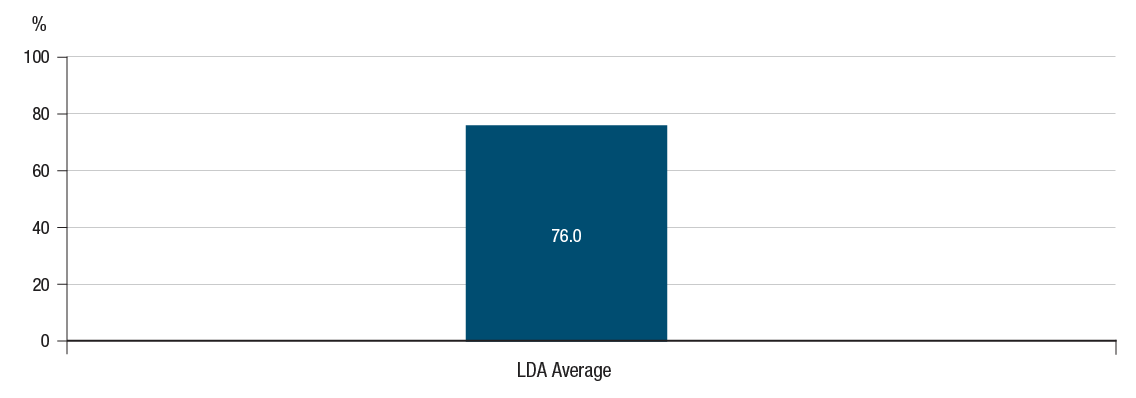
Figure 32 - Text version
On average, 76 per cent of large departments’ and agencies’ service standard targets for priority services are being met.
This indicator provides information on the extent to which, for priority services, clear expectations have been set for the level of service clients are to receive. On average, 76% of the department’s priority services have service standards. Of those departments that do have service standards, 76% of service standard targets for priority services are being met, which informs service management decision-making.
External services that have real-time performance information published on Canada.ca
On average, 12% of priority external services have real-time performance information published on Canada.ca. Only 2/9 departments assessed have at least some information published on Canada.ca, while 7/9 departments have no real-time performance information published. Departments need to be more rigorous in their efforts to increase the amount of real-time performance information for priority external services available through Canada.ca.
Client-centric services
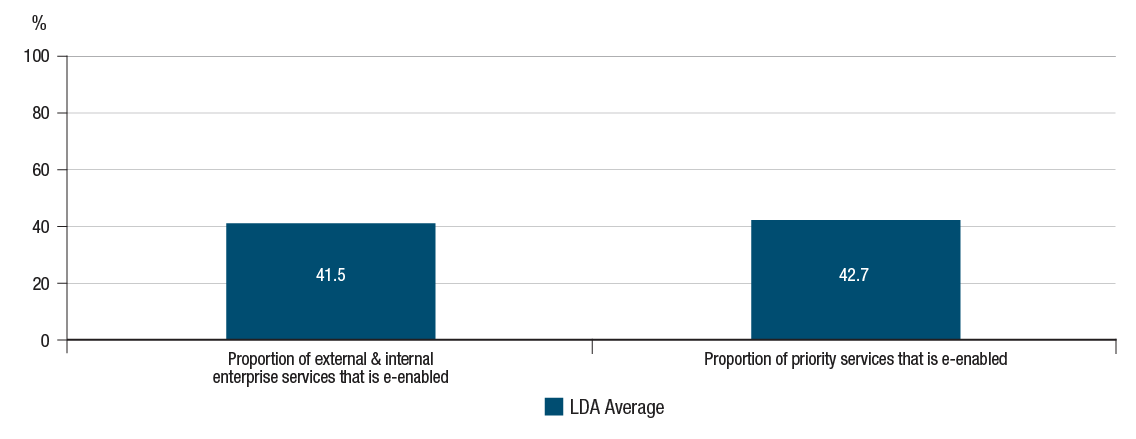
Figure 33 - Text version
On average, 41.5 per cent of external and internal enterprise services for large departments and agencies are e-enabled, while 42.7 per cent of priority services are e-enabled.
Canadians and businesses increasingly expect access to convenient and secure end-to-end e-services that respect their privacy. In addition, on-line service delivery is significantly more cost-effective than delivery through traditional channels such as the in-person and telephone channels. The following indicators assess compliance with policy requirements that come into effect in 2016 and 2017 and are critical to determining progress in improving and expanding e-services and in identifying key challenges in this area.
Enterprise services that are e-enabled
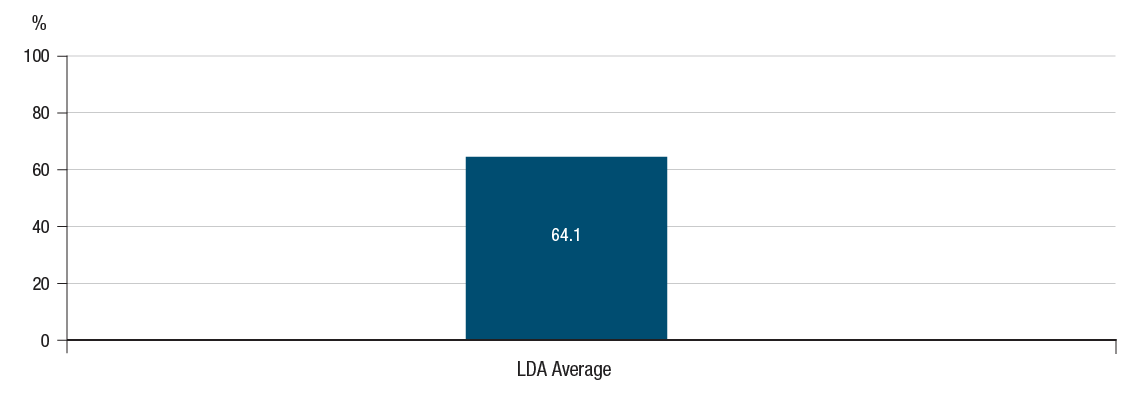
Figure 34 - Text version
On average, 64.1 per cent of large departments’ and agencies’ external and internal enterprise services can be completed online.
Departments are expected to annually increase the proportion of services where delivery is fully e-enabled, excluding circumstances where it is prohibited by law or security considerations. Of the 11 departments assessed, on average 41.5% of external and internal enterprise services are e-enabled. In addition, on average, 42.7% of priority services are e-enabled.
Departments are also expected to increase the average proportion of their services that can be completed online, excluding intermediate activities that are not suitable to be completed online. On average, 64% of each external and internal enterprise service can be completed online.
© Her Majesty the Queen in Right of Canada, represented by the President of the Treasury Board, 2017, ISNN: 2651-1186
Page details
- Date modified: