
Shared Services Canada Financial Statements - March 31, 2023

Statement of management responsibility including internal control over financial reporting
Responsibility for the integrity and objectivity of the accompanying financial statements for the year ended March 31, 2023, and all information contained in these statements rests with the management of Shared Services Canada. These financial statements have been prepared by management using the Government of Canada’s accounting policies, which are based on Canadian public sector accounting standards.
Management is responsible for the integrity and objectivity of the information in these financial statements. Some of the information in the financial statements is based on management’s best estimates and judgment, and gives due consideration to materiality. To fulfill its accounting and reporting responsibilities, management maintains a set of accounts that provides a centralized record of Shared Services Canada’s financial transactions. Financial information submitted in the preparation of the Public Accounts of Canada, and included in Shared Services Canada’s Departmental Results Report, is consistent with these financial statements.
Management is also responsible for maintaining an effective system of internal control over financial reporting (ICFR) designed to provide reasonable assurance that financial information is reliable, that assets are safeguarded and that transactions are properly authorized and recorded in accordance with the Financial Administration Act and other applicable legislation, regulations, authorities and policies.
Management seeks to ensure the objectivity and integrity of data in its financial statements through careful selection, training and development of qualified staff; through organizational arrangements that provide appropriate divisions of responsibility; through communication programs aimed at ensuring that regulations, policies, standards, and managerial authorities are understood throughout Shared Services Canada and through conducting an annual risk-based assessment of the effectiveness of the system of ICFR.
The system of ICFR is designed to mitigate risks to a reasonable level based on an ongoing process to identify key risks, to assess effectiveness of associated key controls, and to make any necessary adjustments.
A risk-based assessment of the system of ICFR for the year ended March 31, 2023 was completed in accordance with the Treasury Board Policy on Financial Management and the results and action plans are summarized in the annex.
The annex also provides information on the status of the risk-based assessment of the controls over common services provided by the department that have a bearing on a recipient’s departmental financial statements.
The effectiveness and adequacy of Shared Services Canada’s system of internal control is reviewed by the work of internal audit staff, who conduct periodic audits of different areas of Shared Services Canada’s operations, and by the Departmental Audit Committee, which advises the President regarding management’s responsibilities for maintaining adequate control systems, the quality of financial reporting, and the financial statements.
The financial statements of Shared Services Canada have not been audited.
Original signed by Scott Jones for
Sony Perron
President
Original signed by
Scott Davis, CPA
Assistant Deputy Minister and
Chief Financial Officer
Ottawa, Canada
September 1, 2023
Shared Services Canada statement of financial position (unaudited) as at March 31 (in thousands of dollars)
| Liabilities | 2023 | 2022 |
|---|---|---|
|
Accounts payable and accrued liabilities (note 4)
|
461,742 | 465,123 |
|
Vacation pay and compensatory leave
|
68,493 | 75,549 |
|
Lease obligations for tangible capital assets (note 5)
|
126,513 | 198,172 |
|
Obligation under public-private partnership (note 6)
|
109,592 | 113,358 |
|
Employee future benefits (note 7)
|
24,051 | 25,738 |
| Total liabilities | 790,391 | 877,940 |
| Financial assets | 2023 | 2022 |
|---|---|---|
|
Due from the Consolidated Revenue Fund
|
343,661 | 260,145 |
|
Accounts receivable and advances (note 8)
|
186,555 | 272,506 |
| Total gross financial assets | 530,216 | 532,651 |
| Financial assets held on behalf of Government | 2023 | 2022 |
|---|---|---|
|
Accounts receivable and advances (note 8)
|
(5,052) | (8,572) |
| Total financial assets held on behalf of Government | (5,052) | (8,572) |
| 2023 | 2022 | |
|---|---|---|
| Total net financial assets | 525,164 | 524,079 |
| 2023 | 2022 | |
|---|---|---|
| Departmental net debt | 265,227 | 353,861 |
| Non-financial assets | 2023 | 2022 |
|---|---|---|
|
Prepaid expenses
|
158,536 | 91,396 |
|
Inventory (note 9)
|
8,122 | 6,105 |
|
Tangible capital assets (note 10)
|
980,384 | 1,144,425 |
| Total non-financial assets | 1,147,042 | 1,241,926 |
| 2023 | 2022 | |
|---|---|---|
| Departmental net financial position | 881,815 | 888,065 |
Contractual obligations and contractual rights (note 11)
Contingent liabilities and contingent assets (note 12)
The accompanying notes form an integral part of these financial statements.
Original signed by Scott Jones for
Sony Perron
President
Original signed by
Scott Davis, CPA
Assistant Deputy Minister and
Chief Financial Officer
Ottawa, Canada
September 1, 2023
Shared Services Canada statement of operations and departmental net financial position (unaudited) for the year ended March 31 (in thousands of dollars)
| Expenses | 2023 - Planned Results | 2023 | 2022 |
|---|---|---|---|
|
Common Government of Canada IT Operations
|
3,204,101 | 3,188,495 | 3,026,314 |
|
Internal Services
|
263,699 | 362,649 | 316,386 |
| Total expenses | 3,467,800 | 3,551,144 | 3,342,700 |
| Revenues | 2023 Planned Results |
2023 | 2022 |
|---|---|---|---|
|
Sale of goods and services
|
798,860 | 931,882 | 988,674 |
|
Miscellaneous revenues
|
455 | 378 | 155 |
|
Revenues earned on behalf of Government
|
(11,780) | (40,150) | (41,395) |
| Total revenues | 787,535 | 892,110 | 947,434 |
| 2023 - Planned Results | 2023 | 2022 | |
|---|---|---|---|
| Net cost of operations before government funding and transfers | 2,680,265 | 2,659,034 | 2,395,266 |
| Government funding and transfers | 2023 - Planned Results | 2023 | 2022 |
|---|---|---|---|
|
Net cash provided by Government of Canada
|
2,453,212 | 2,096,216 | |
|
Change in due from the Consolidated Revenue Fund
|
83,516 | (164,916) | |
|
Services provided without charge by other
government departments (note 13)
|
116,211 | 111,776 | |
|
Net transfer of salary overpayments from (to) other government departments
|
(192) | 146 | |
|
Transfer of tangible capital assets from other government departments
|
37 | 2,449 | |
|
Transfer of tangible capital assets to other government departments
|
- | (1,707) | |
| Net cost of operations after government funding and transfers | 6,250 | 351,302 |
| 2023 - Planned Results | 2023 | 2021 | |
|---|---|---|---|
| Departmental net financial position – Beginning of year | 888,065 | 1,239,367 |
| 2023 - Planned Results | 2023 | 2022 | |
|---|---|---|---|
| Departmental net financial position – End of year | 881,815 | 888,065 |
Segmented information (note 14)
The accompanying notes form an integral part of these financial statements.
Shared Services Canada statement of change in departmental net debt (unaudited) for the year ended March 31 (in thousands of dollars)
| 2023 | 2022 | |
|---|---|---|
| Net cost of operations after government funding and transfers | 6,250 | 351,302 |
| Change due to tangible capital assets | 2023 | 2022 |
|---|---|---|
|
Acquisitions of tangible capital assets
|
219,743 | 355,342 |
|
Amortization of tangible capital assets
|
(372,735) | (425,698) |
|
Net loss on disposal and write-off of tangible capital assets including adjustments
|
(11,086) | 516 |
|
Loss on disposal of tangible capital assets due to the termination of lease obligations
|
- | (14,083) |
|
Transfers from other government departments
|
37 | 2,449 |
|
Transfers to other government departments
|
- | (1,707) |
| Total change due to tangible capital assets | (164,041) | (83,181) |
| 2023 | 2022 | |
|---|---|---|
| Change due to inventory | 2,017 | 6,105 |
| 2023 | 2022 | |
|---|---|---|
| Change due to prepaid expenses | 67,140 | (2,440) |
| 2023 | 2022 | |
|---|---|---|
| Net increase (decrease) in departmental net debt | (88,634) | 271,786 |
| 2023 | 2022 | |
|---|---|---|
| Departmental net debt – Beginning of year | 353,861 | 82,075 |
| 2023 | 2022 | |
|---|---|---|
| Departmental net debt – End of year | 265,227 | 353,861 |
The accompanying notes form an integral part of these financial statements.
Shared Services Canada statement of cash flows (unaudited) for the year ended March 31 (in thousands of dollars)
| Operating activities | 2023 | 2022 |
|---|---|---|
|
Net cost of operations before government funding and transfers
|
2,659,034 | 2,395,266 |
|
Non-cash items:
|
||
|
Amortization of tangible capital assets
|
(372,735) | (425,698) |
|
Net loss on disposal and write-off of tangible capital assets
including adjustments
|
(11,086) | 516 |
|
Net loss on the termination of lease obligations for tangible capital assets
|
- | (3,939) |
|
Services provided without charge by other government departments (note 13)
|
(116,211) | (111,776) |
|
Net transfer of salary overpayments to (from) other government
departments
|
192 | (146) |
|
Variations in Statement of Financial Position:
|
||
|
Increase (decrease) in accounts receivable and advances
|
(82,431) | (203,496) |
|
Increase (decrease) in prepaid expenses
|
67,140 | (2,440) |
|
Increase (decrease) in inventory
|
2,017 | 6,105 |
|
Decrease (increase) in accounts payable and accrued liabilities
|
3,381 | 162,550 |
|
Decrease (increase) in vacation pay and compensatory leave
|
7,056 | 7,169 |
|
Decrease (increase) in employee future benefits
|
1,687 | 2,176 |
| Cash used in operating activities | 2,158,044 | 1,826,287 |
| Capital investing activities | 2023 | 2022 |
|---|---|---|
|
Acquisitions of tangible capital assets (excluding leased tangible
capital assets)
|
219,743 | 198,312 |
| Cash used in capital investing activities | 219,743 | 198,312 |
| Financing activities | 2023 | 2022 |
|---|---|---|
|
Payments on lease obligations for tangible capital assets
|
71,659 | 67,987 |
|
Payments on obligation under public-private partnership
|
3,766 | 3,630 |
| Cash used in financing activities | 75,425 | 71,617 |
| 2023 | 2022 | |
|---|---|---|
| Net cash provided by Government of Canada | 2,453,212 | 2,096,216 |
The accompanying notes form an integral part of these financial statements.
Shared Services Canada notes to the financial statements (unaudited) for the year ended March 31 (in thousands of dollars)
1. Authority and objectives
Shared Services Canada (SSC) was created on August 4, 2011 to transform how the Government of Canada manages its information technology (IT) infrastructure. SSC operates under the legislation set out in the Shared Services Canada Act. SSC is responsible for digitally enabling government programs and services by providing IT services in the domains of networks and network security, data centres and cloud offerings, digital communications and providing IT tools that the public service needs to do its job. As a service provider to over 40 government departments and agencies, SSC is focused on moving toward an IT service delivery model that encourages sharing common solutions and platforms across departments in an effort to reduce the variety of IT solutions across the government. In taking this enterprise approach, SSC is working to solidify network capacity and security, equip and empower employees to collaborate, and support partners in the design and delivery of their digital service offering to Canadians. The Minister of Public Services and Procurement Canada is the Minister responsible for SSC.
SSC’s Departmental Results Framework is structured by the following core responsibility and internal services:
- Common Government of Canada IT Operations: Using a government-wide approach, SSC delivers reliable and secure IT operations, IT infrastructure and communication and workplace technology services that support and enable government-wide programs and digital services for the Public Service.
- Internal Services: Internal services are the services that are provided within a department so that it can meet its corporate obligations and deliver its programs. There are 10 categories of internal services: management and oversight services, communications services, legal services, human resources management services, financial management services, information management services, information technology services, real property management services, materiel management services, and acquisition management services.
2. Summary of significant accounting policies
These financial statements are prepared using the government’s accounting policies stated below, which are based on Canadian public sector accounting standards. The presentation and results using the stated accounting policies do not result in any significant differences from Canadian public sector accounting standards.
Significant accounting policies are as follows:
a) Parliamentary authorities
SSC is financed by the Government of Canada through parliamentary authorities. Financial reporting of authorities provided to SSC do not parallel financial reporting according to generally accepted accounting principles since authorities are primarily based on cash flow requirements. Consequently, items recognized in the Statement of Operations and Departmental Net Financial Position and in the Statement of Financial Position are not necessarily the same as those provided through authorities from Parliament. Note 3 provides a reconciliation between the bases of reporting.
The planned results amounts in the “Expenses” and “Revenues” sections of the Statement of Operations and Departmental Net Financial Position are the amounts reported in the Future-oriented Statement of Operations included in the 2022-23 Departmental Plan. Planned results are not presented in the “Government funding and transfers” section of the Statement of Operations and Departmental Net Financial Position and in the Statement of Change in Departmental Net Debt because these amounts were not included in the 2022-23 Departmental Plan.
b) Net cash provided by Government of Canada
SSC operates within the Consolidated Revenue Fund, which is administered by the Receiver General for Canada. All cash received by SSC is deposited to the Consolidated Revenue Fund, and all cash disbursements made by SSC are paid from the Consolidated Revenue Fund. The net cash provided by government is the difference between all cash receipts and all cash disbursements, including transactions between departments of the government.
c) Amounts due from or to the Consolidated Revenue Fund
Amounts due from or to the Consolidated Revenue Fund are the result of timing differences at year‑end between when a transaction affects authorities and when it is processed through the Consolidated Revenue Fund. Amounts due from the Consolidated Revenue Fund represent the net amount of cash that SSC is entitled to draw from the Consolidated Revenue Fund without further authorities to discharge its liabilities.
d) Revenues
Revenues are recognized in the period the event giving rise to the revenues occurred.
Revenues that are non-respendable are not available to discharge SSC’s liabilities. While the President of SSC is expected to maintain accounting control, he has no authority regarding the disposition of non-respendable revenues. As a result, non-respendable revenues are considered to be earned on behalf of the Government of Canada and are therefore presented as a reduction of SSC’s gross revenues.
e) Expenses
Vacation pay and compensatory leave are accrued as the benefits are earned by employees under their respective terms of employment.
Services provided without charge by other government departments for accommodation and employer contributions to the health and dental insurance plans are recorded as operating expenses at their carrying value.
f) Employee future benefits
- Pension benefits: Eligible employees participate in the Public Service Pension Plan, a multiemployer pension plan administered by the government. SSC’s contributions to the Plan are charged to expenses in the year incurred and represent the total departmental obligation to the Plan. SSC’s responsibility with regard to the Plan is limited to its contributions. Actuarial surpluses or deficiencies are recognized in the financial statements of the Government of Canada, as the Plan’s sponsor.
- Severance benefits: The accumulation of severance benefits for voluntary departures ceased for applicable employee groups. The remaining obligation for employees who did not withdraw benefits is calculated using information derived from the results of the actuarially determined liability for employee severance benefits for the government as a whole.
g) Accounts receivable and advances
Accounts receivable and advances are stated at the lower of cost and net recoverable value. A valuation allowance is recorded for receivables where recovery is considered uncertain.
h) Inventory
Inventories are valued at cost and are comprised of spare parts and supplies held for future program delivery and are not primarily intended for resale. Inventories that no longer have service potential are valued at the lower of cost or net realizable value.
i) Tangible capital assets
The costs of acquiring land, buildings, equipment, and other capital property are capitalized as tangible capital assets and, except for land, are amortized to expense over the estimated useful lives of the assets, as described below. All tangible capital assets and leasehold improvements having an initial cost of ten thousand or more are recorded at their acquisition cost. Tangible capital assets do not include immovable assets located on reserves as defined in the Indian Act, works of art, museum collection and Crown land to which no acquisition cost is attributable; and intangible assets.
Amortization of tangible capital assets is done on a straight-line basis over the estimated useful life of the asset as follows:
| Asset Class | Amortization Period |
|---|---|
| Buildings | From 20 to 50 years |
| Works and infrastructure | From 20 to 40 years |
| Machinery and equipment | From 5 to 15 years |
| Computer hardware | From 3 to 10 years |
| Computer software | From 3 to 10 years |
| Vehicles | From 6 to 8 years |
| Leasehold improvements | Lesser of the remaining term of the lease or useful life of the improvement |
| Leased tangible capital assets | According to the useful life of the asset if a bargain purchase option exists or over the term of the lease |
Assets under construction are recorded in the applicable asset class in the year they become available for use and are not amortized until they become available for use.
j) Contingent liabilities
Contingent liabilities are potential liabilities which may become actual liabilities when one or more future events occur or fail to occur. If the future event is likely to occur or fails to occur, and a reasonable estimate of the loss can be made, a provision is accrued and an expense recorded to other expenses. If the likelihood is not determinable or an amount cannot be reasonably estimated, the contingency is disclosed in the notes to the financial statements.
k) Contingent assets
Contingent assets are possible assets which may become actual assets when one or more future events occur or fail to occur. If the future event is likely to occur or fails to occur, the contingent asset is disclosed in the notes to the financial statements.
l) Measurement uncertainty
The preparation of these financial statements requires management to make estimates and assumptions that affect the reported and disclosed amounts of assets, liabilities, revenues and expenses reported in the financial statements and accompanying notes at March 31. The estimates are based on facts and circumstances, historical experience, general economic conditions and reflect the government’s best estimate of the related amount at the end of the reporting period. The most significant items where estimates are used are contingent liabilities, the liability for employee future benefits and the useful life of tangible capital assets. Actual results could significantly differ from those estimated. Management’s estimates are reviewed periodically and, as adjustments become necessary, they are recorded in the financial statements in the year they become known.
m) Related party transactions
Related party transactions, other than inter-entity transactions, are recorded at the exchange amount.
Inter-entity transactions are transactions between commonly controlled entities. Inter-entity transactions, other than restructuring transactions, are recorded on a gross basis and are measured at the carrying amount, except for the following:
- Services provided on a recovery basis are recognized as revenues and expenses on a gross basis and measured at the exchange amount.
- Certain services received on a without charge basis are recorded for departmental financial statement purposes at the carrying amount.
3. Parliamentary authorities
SSC receives most of its funding through annual parliamentary authorities. Items recognized in the Statement of Operations and Departmental Net Financial Position and in the Statement of Financial Position in one year may be funded through parliamentary authorities in prior, current or future years. Accordingly, SSC has different net results of operations for the year on a government funding basis than on an accrual accounting basis. The differences are reconciled in the following tables:
a) Reconciliation of net cost of operations to current year authorities used
| 2023 | 2022 | |
|---|---|---|
| Net cost of operations before government funding and transfers | 2,659,034 | 2,395,266 |
| Adjustments for items affecting net cost of operations but not affecting authorities: | 2023 | 2022 |
|---|---|---|
|
Amortization of tangible capital assets
|
(372,735) | (425,698) |
|
Net loss on disposal and write-off of tangible capital assets including adjustments
|
(11,086) | 516 |
|
Net loss on the termination of lease obligations for tangible capital assets
|
- | (3,939) |
|
Services provided without charge by other government departments
|
(116,211) | (111,776) |
|
Decrease (increase) in vacation pay and compensatory leave
|
7,056 | 7,169 |
|
Decrease (increase) in employee future benefits
|
1,687 | 2,176 |
|
Decrease (increase) in accrued liabilities not charged to authorities
|
(550) | 10,249 |
|
Bad debt expense
|
(1) | - |
|
Refunds and adjustments to previous years’ expenses
|
6,308 | 10,216 |
|
Respendable revenue
|
(1,865) | 296 |
|
Other
|
53 | 36 |
| Total items affecting net cost of operations but not affecting authorities | (487,344) | (510,755) |
| Adjustments for items not affecting net cost of operations but affecting authorities: | 2023 | 2022 |
|---|---|---|
|
Acquisitions of tangible capital assets (excluding leased tangible
capital assets)
|
219,743 | 198,312 |
|
Payments on lease obligations for tangible capital assets
|
71,659 | 67,987 |
|
Payments on obligation under public-private partnership
|
3,766 | 3,630 |
|
Increase (decrease) in accounts receivable for salary overpayments
|
1,955 | 2,759 |
|
Net increase (decrease) in prepaid expenses and advances
|
67,271 | (1,150) |
|
Increase (decrease) in inventory
|
2,017 | 6,105 |
| Total items not affecting net cost of operations but affecting authorities | 366,411 | 277,643 |
| 2023 | 2022 | |
|---|---|---|
| Current year authorities used | 2,538,101 | 2,162,154 |
b) Authorities provided and used
| Authorities provided: | 2023 | 2022 |
|---|---|---|
|
Vote 1 – Operating expenditures
|
2,409,243 | 1,969,432 |
|
Vote 5 – Capital expenditures
|
353,729 | 338,380 |
|
Statutory amounts
|
126,957 | 116,475 |
| Less: | 2023 | 2022 |
|---|---|---|
|
Lapsed: Operating expenditures
|
(242,416) | (147,356) |
|
Lapsed: Capital expenditures
|
(109,412) | (114,777) |
| 2023 | 2022 | |
|---|---|---|
| Current year authorities used | 2,538,101 | 2,162,154 |
4. Accounts payable and accrued liabilities
The following table presents details of SSC’s accounts payable and accrued liabilities:
| 2023 | 2022 | |
|---|---|---|
| Accounts payable - Other government departments and agencies | 31,781 | 54,491 |
| Accounts payable - External parties | 291,799 | 271,902 |
| Total accounts payable | 323,580 | 326,393 |
| Accrued liabilities | 138,162 | 138,730 |
| Total accounts payable and accrued liabilities | 461,742 | 465,123 |
5. Lease obligations for tangible capital assets
SSC has entered into agreements to lease certain computer hardware under capital leases with a cost of $356,581 and accumulated amortization of $221,690 as at March 31, 2023 ($356,581 and $155,825 respectively as at March 31, 2022). The obligations related to the upcoming years include the following:
| 2023 | 2022 | |
|---|---|---|
| 2023 | - | 75,736 |
| 2024 | 70,434 | 70,434 |
| 2025 | 51,517 | 51,517 |
| 2026 | 7,844 | 7,844 |
| Total future minimum lease payments | 129,795 | 205,531 |
| Less: imputed interest (1.44% to 3.07%) | 3,282 | 7,359 |
| Balance of obligations under leased tangible capital assets | 126,513 | 198,172 |
6. Obligation under public-private partnership
SSC has entered into a public-private partnership agreement to upgrade and expand the Enterprise Data Centre Borden with a cost of $153,304 and accumulated amortization of $14,053 as at March 31, 2023 ($153,304 and $10,987 respectively as at March 31, 2022). The obligations related to the upcoming years include the following:
| 2023 | 2022 | |
|---|---|---|
| 2023 | - | 7,867 |
| 2024 | 7,867 | 7,867 |
| 2025 | 7,867 | 7,867 |
| 2026 | 7,867 | 7,867 |
| 2027 | 7,867 | 7,867 |
| 2028 | 7,867 | 7,867 |
| 2029 and subsequent | 114,425 | 114,425 |
| Total future minimum lease payments | 153,760 | 161,627 |
| Less: imputed interest (3.67%) | 44,168 | 48,269 |
| Balance of obligation under public-private partnership | 109,592 | 113,358 |
7. Employee future benefits
a) Pension benefits
SSC’s employees participate in the Public Service Pension Plan (the “Plan”), which is sponsored and administered by the Government of Canada. Pension benefits accrue up to a maximum period of 35 years at a rate of 2 percent per year of pensionable service, times the average of the best 5 consecutive years of earnings. The benefits are integrated with Canada/Québec Pension Plan benefits and they are indexed to inflation.
Both the employees and SSC contribute to the cost of the Plan. Due to the amendment of the Public Service Superannuation Act following the implementation of provisions related to Economic Action Plan 2012, employee contributors have been divided into two groups – Group 1 relates to existing plan members as of December 31, 2012 and Group 2 relates to members joining the Plan as of January 1, 2013. Each group has a distinct contribution rate.
The 2022-23 expense amounts to $83,464 ($79,184 in 2021-22). For Group 1 members, the expense represents approximately 1.02 times (1.01 times in 2021-22) the employees’ contributions and, for Group 2 members, approximately 1.00 times (1.00 times in 2021-22) the employees’ contributions.
SSC’s responsibility with regard to the Plan is limited to its contributions. Actuarial surpluses or deficiencies are recognized in the Consolidated Financial Statements of the Government of Canada, as the Plan’s sponsor.
b) Severance benefits
Severance benefits provided to SSC’s employees were previously based on an employee’s eligibility, years of service and salary at termination of employment. However, since 2011, the accumulation of severance benefits for voluntary departures progressively ceased for substantially all employees. Employees subject to these changes were given the option to be paid the full or partial value of benefits earned to date or collect the full or remaining value of benefits upon departure from the public service. By March 31, 2023, substantially all settlements for immediate cash out were completed. Severance benefits are unfunded and, consequently, the outstanding obligation will be paid from future authorities.
The changes in the obligations during the year were as follows:
| 2023 | 2022 | |
|---|---|---|
| Accrued benefit obligation - Beginning of year | 25,738 | 27,914 |
| Expense (adjustment) for the year | (131) | (264) |
| Benefits paid during the year | (1,556) | (1,912) |
| Accrued benefit obligation - End of year | 24,051 | 25,738 |
8. Accounts receivable and advances
The following table presents details of SSC’s accounts receivable and advances:
| 2023 | 2022 | |
|---|---|---|
| Receivables - Other government departments and agencies | 162,363 | 245,159 |
| Receivables - External parties | 22,806 | 25,773 |
| Employee advances | 1,386 | 1,574 |
| Gross accounts receivable and advances | 186,555 | 272,506 |
| Accounts receivable held on behalf of Government | (5,052) | (8,572) |
| Net accounts receivable and advances | 181,503 | 263,934 |
9. Inventory
The following table presents details of SSC’s inventory:
| 2023 | 2022 | |
|---|---|---|
| Inventory held for consumption | 8,122 | 6,105 |
| Total inventory | 8,122 | 6,105 |
The cost of consumed inventory recognized as an expense in the Statement of Operations and Departmental Net Financial Position is $4,237 in 2022-23 ($1,404 in 2021-22).
10. Tangible capital assets
| Capital asset class | Opening balance | Acquisitions | Adjustments (1) | Disposals and write-offs |
Closing balance |
|---|---|---|---|---|---|
| Buildings | 156,389 | - | - | - | 156,389 |
| Works and infrastructure | 1,310 | - | - | - | 1,310 |
| Machinery and equipment | 59,337 | 70 | - | 88 | 59,319 |
| Computer hardware | 2,827,993 | 182,749 | 67,568 | 15,430 | 3,062,880 |
| Computer software | 259,009 | 546 | (400) | 64 | 259,091 |
| Vehicles | 3,492 | 464 | 407 | 27 | 4,336 |
| Leasehold improvements | 81,898 | 13,021 | - | 1,094 | 93,825 |
| Leased tangible capital assets | 356,581 | - | - | - | 356,581 |
| Assets under construction | 113,626 | 22,893 | (78,484) | - | 58,035 |
| Total | 3,859,635 | 219,743 | (10,909) | 16,703 | 4,051,766 |
| Capital asset class | Opening balance | Amortization | Adjustments (1) | Disposals and write-offs |
Closing balance |
|---|---|---|---|---|---|
| Buildings | 13,858 | 3,169 | - | - | 17,027 |
| Works and infrastructure | 385 | 53 | - | - | 438 |
| Machinery and equipment | 51,813 | 1,090 | - | 88 | 52,815 |
| Computer hardware | 2,199,417 | 284,533 | (327) | 15,322 | 2,468,301 |
| Computer software | 243,430 | 7,861 | (47) | 63 | 251,181 |
| Vehicles | 1,520 | 515 | 393 | 15 | 2,413 |
| Leasehold improvements | 48,962 | 9,649 | - | 1,094 | 57,517 |
| Leased tangible capital assets | 155,825 | 65,865 | - | - | 221,690 |
| Assets under construction | - | - | - | - | - |
| Total | 2,715,210 | 372,735 | 19 | 16,582 | 3,071,382 |
| Capital asset class | 2023 | 2022 |
|---|---|---|
| Buildings | 139,362 | 142,531 |
| Works and infrastructure | 872 | 925 |
| Machinery and equipment | 6,504 | 7,524 |
| Computer hardware | 594,579 | 628,576 |
| Computer software | 7,910 | 15,579 |
| Vehicles | 1,923 | 1,972 |
| Leasehold improvements | 36,308 | 32,936 |
| Leased tangible capital assets | 134,891 | 200,756 |
| Assets under construction | 58,035 | 113,626 |
| Total | 980,384 | 1,144,425 |
11. Contractual obligations and contractual rights
a) Contractual obligations
The nature of SSC’s activities may result in some large multi-year contracts and obligations whereby SSC will be obligated to make future payments when the services/goods are received. Significant contractual obligations ($10 million or more) that can be reasonably estimated are summarized as follows:
| 2024 | 2025 | 2026 | 2027 | 2028 | 2029 and subsequent |
Total | |
|---|---|---|---|---|---|---|---|
| Acquisition of goods and services | 626,644 | 345,997 | 245,936 | 39,614 | 18,832 | 55,607 | 1,332,630 |
b) Contractual rights
SSC has determined that there are no contractual rights which require disclosure in these financial statements.
12. Contingent liabilities and contingent assets
a) Contingent liabilities
Claims have been made against SSC in the normal course of operations. These claims include items with pleading amounts and others for which no amount is specified. While the total amount claimed in these actions is significant, their outcomes are not determinable. Where it is likely that there will be a future payment and a reasonable estimate of the loss can be made, an allowance for claims and litigations is recorded. No allowance has been recorded in SSC’s financial statements. Claims and litigations for which the outcome is not determinable and a reasonable estimate can be made by management are nil at March 31, 2023 ($11,250 at March 31, 2022).
b) Contingent assets
SSC has determined that there are no contingent assets which require disclosure in these financial statements.
13. Related party transactions
SSC is related as a result of common ownership to all government departments, agencies, and Crown corporations. Related parties also include individuals who are members of key management personnel or close family members of those individuals, and entities controlled by, or under shared control of, a member of key management personnel or a close family member of that individual.
SSC enters into transactions with these entities in the normal course of business and on normal trade terms.
a) Common services provided without charge by other government departments
During the year, SSC received services without charge from certain common service organizations, related to accommodation and the employer’s contribution to the health and dental insurance plans. These services provided without charge have been recorded at the carrying value in SSC’s Statement of Operations and Departmental Net Financial Position as follows:
| 2023 | 2022 | |
|---|---|---|
| Employer’s contribution to the health and dental insurance plans | 75,653 | 73,692 |
| Accommodation | 40,558 | 38,084 |
| Total | 116,211 | 111,776 |
The government has centralized some of its administrative activities for efficiency, cost-effectiveness purposes and economic delivery of programs to the public. As a result, the government uses central agencies and common service organizations so that one department performs services for all other departments and agencies without charge. The costs of these services, such as the payroll and cheque issuance services provided by Public Services and Procurement Canada, are not included in SSC’s Statement of Operations and Departmental Net Financial Position.
b) Common services provided without charge to other government departments
During the year, SSC provided services without charge to other government departments, related to the provision of IT infrastructure services. These services are not recognized as revenues in the Statement of Operations and Departmental Net Financial Position.
c) Other transactions with other government departments and agencies
| 2023 | 2022 | |
|---|---|---|
| Expenses – Services provided to SSC by other government departments and agencies | 231,949 | 217,403 |
| Revenues – Services provided by SSC to other government departments and agencies | 926,561 | 983,391 |
Expenses and revenues disclosed in c) exclude common services provided without charge by other government departments, which are already disclosed in a).
14. Segmented information
Presentation by segment is based on SSC’s core responsibility. The presentation by segment is based on the same accounting policies as described in the Summary of significant accounting policies in note 2. The following table presents the expenses incurred and revenues generated for the main core responsibilities, by major object of expenses and by major type of revenues. The segment results for the period are as follows:
| Operating expenses | Common Government of Canada IT Operations | Internal Services | 2023 Total | 2022 Total |
|---|---|---|---|---|
|
Salaries and employee benefits
|
846,655 | 203,794 | 1,050,449 | 965,054 |
|
Telecommunications
|
649,443 | 1,880 | 651,323 | 570,090 |
|
Rentals
|
532,792 | 8,707 | 541,499 | 539,872 |
|
Professional and special services
|
370,655 | 96,684 | 467,339 | 425,764 |
|
Amortization of tangible capital assets
|
369,126 | 3,609 | 372,735 | 425,698 |
|
Repairs and maintenance
|
274,153 | 9,786 | 283,939 | 242,662 |
|
Machinery and equipment
|
85,995 | 19,390 | 105,385 | 93,453 |
|
Accommodation
|
32,781 | 15,826 | 48,607 | 48,979 |
|
Utilities, materials and supplies
|
5,830 | 754 | 6,584 | 5,991 |
|
Transportation
|
4,314 | 1,759 | 6,073 | 3,655 |
|
Interest on obligation under public-private partnership
|
4,101 | - | 4,101 | 4,236 |
|
Interest on capital lease payments
|
4,076 | - | 4,076 | 4,636 |
|
Information
|
3,498 | 418 | 3,916 | 5,820 |
|
Loss on disposal and write-off of tangible capital assets
|
109 | 12 | 121 | 689 |
|
Net loss on the termination of lease obligations for tangible capital assets
|
- | - | - | 3,939 |
|
Other expenses
|
4,967 | 30 | 4,997 | 2,162 |
| Total operating expenses | 3,188,495 | 362,649 | 3,551,144 | 3,342,700 |
| Revenues | Common Government of Canada IT Operations | Internal Services | 2023 Total | 2022 Total |
|---|---|---|---|---|
| Sale of goods and services | 931,882 | - | 931,882 | 988,674 |
| Miscellaneous revenues | 316 | 62 | 378 | 155 |
| Revenues earned on behalf of Government | (40,149) | (1) | (40,150) | (41,395) |
| Total revenues | 892,049 | 61 | 892,110 | 947,434 |
| Common Government of Canada IT Operations | Internal Services | 2023 Total | 2022 Total | |
|---|---|---|---|---|
| Net cost of operations before government funding and transfers | 2,296,446 | 362,588 | 2,659,034 | 2,395,266 |
15. Comparative information
Comparative figures have been reclassified to conform to the current year’s presentation.
Annex to the Statement of Management Responsibility including Internal Control over Financial Reporting for the year ended March 31, 2023
1. Introduction
This document provides summary information on the measures taken by Shared Services Canada (SSC) to maintain an effective system of internal control over financial management, including financial reporting, as well as information on internal control management, assessment results and related action plans.
Detailed information on the department’s authority, mandate and core responsibilities can be found in the 2023-24 Departmental Plan and the 2022-23 Departmental Results Report (DRR).
2. Departmental system of Internal Control over Financial Reporting
2.1 Internal control management
SSC has a well-established governance and accountability structure to support departmental assessment efforts and oversight of its system of internal control. A departmental internal control management framework, approved by the President, is in place and comprises:
- Organizational accountability structures as they relate to internal control management to support sound financial management, including the roles and responsibilities of senior departmental managers for control management in their areas of responsibility;
- An internal attestation process in support of certification by the President and Chief Financial Officer, whereby senior departmental executives who report to the President attest that they have maintained an effective system of Internal Control over Financial Reporting in their area of responsibility;
- Values and ethics;
- Ongoing communication and training legislative and policy requirements for sound financial management and control; and
- Monitoring and regular updates on internal control management, as well as provision of related assessment results and action plans to the President, senior departmental management and, as applicable, the Departmental Audit Committee.
The Departmental Audit Committee is an independent advisory committee to the President. It is responsible to provide advice to the President on the adequacy and functioning of the department's risk management, control and governance frameworks and processes.
2.2 Service arrangements relevant to financial statements
SSC relies on other organizations for the processing of certain transactions that are recorded in its financial statements as follows:
Common Service Arrangements
- Public Services and Procurement Canada (PSPC) administers the payment of salaries and the procurement of goods and services, and provides accommodation services;
- The Treasury Board of Canada Secretariat provides information on public sector insurance and centrally administers payment of the employer’s share of contributions toward statutory employee benefit plans on behalf of SSC; and
- The Department of Justice provides legal services to SSC.
Readers of this Annex may refer to the annexes of the above-noted departments for a greater understanding of the systems of ICFR related to these specific services.
SSC relies on other external service providers and/or departments for the processing of certain transactions or information that are recorded in its financial statements, as follows:
Specific Arrangements
- PSPC provides SSC with a SAP financial platform to capture and report all financial transactions; and
- Agriculture and Agri-Food Canada provides SSC with a PeopleSoft platform to process transactions related to human resources.
2.3 Common Services Provided by SSC
SSC plays a significant role in the delivery of digital government by establishing a reliable, modern, secure and accessible network; supporting a digitally-enabled public service; and providing modern and efficient infrastructure solutions.
There are shared internal control responsibilities under the Treasury Board Policy on Financial Management. As a common service provider, SSC is responsible for the assessment of IT general controls for IT infrastructure services provided to customers. Customers are responsible for the assessment of application level controls and general IT controls that support their financial applications. Created on August 4, 2011, SSC was given a broad mandate to modernize and consolidate the Government of Canada’s information technology infrastructure. Today, SSC provides the digital backbone of the federal government, the underpinning for providing essential services and programs to Canadians. SSC delivers network, data centre, email, security and workplace technology to 45 of the larger federal departments and agencies.
The following diagram provides a summary view of the infrastructure layers and services that are in scope for the ITGC assessment.
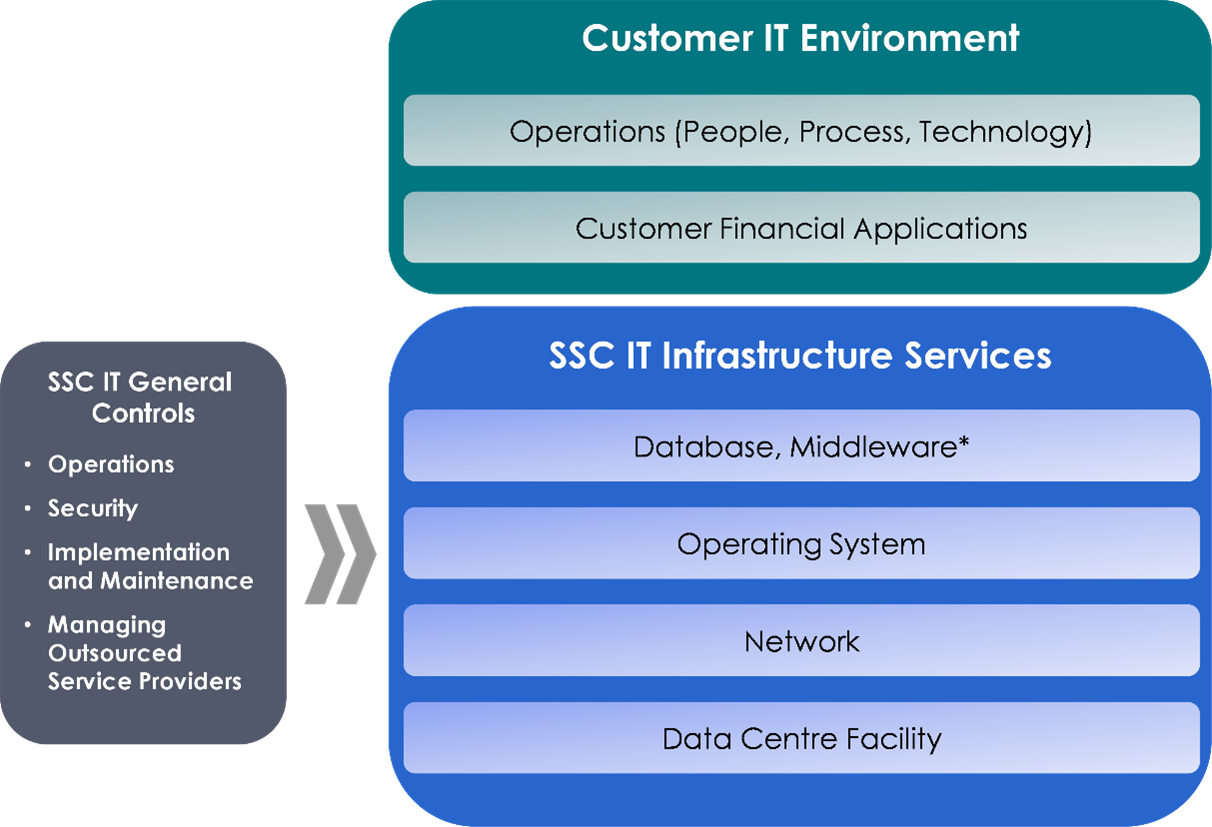
Long description – Figure 1
This graphic shows the infrastructure layers that are part of the ITGC framework. A box on the left shows that SSC’s IT general controls include Operations, Security, Implementation and Maintenance, and Managing outsourced providers. Two arrows point to a separate box showing that SSC’s IT general controls are responsible for IT infrastructure services provided to customers. This includes Database/Middleware, Operating System, Network and Data Centre Facility. A separate box represents the Customer IT Environment which includes Operations (people, process, technology) and Customer Financial Applications. This demonstrates that customers are responsible for the assessment of application level controls and general IT controls that support their financial applications.
*Responsibility over certain infrastructure elements is shared between SSC and its customers in accordance with customer agreements. For instance, for Platform Services (database and middleware services), depending on the customer, some components are fully managed and maintained by SSC while others are only partially managed and maintained by SSC.
3. Departmental assessment results during the 2022-23 fiscal year
The following table summarizes the status of the ongoing monitoring activities according to the previous fiscal year’s rotation plan.
| Previous fiscal year’s rotational ongoing monitoring plan for the current fiscal year | Status |
|---|---|
| Entity-level controls – Control environment COSO component | Completed as planned; remediation actions started |
| Revenue and Accounts Receivable / Revenue Management | Completed as planned; remediation actions started |
| Payroll and benefits | Completed as planned; remediation actions started |
| Capital Assets | Completed as planned; remediation actions started |
The key findings and significant adjustments from the current fiscal year’s assessment activities are summarized in subsection 3.1.
3.1 New or significantly amended key controls
In the current fiscal year, there were no significantly amended key controls in existing processes that required a reassessment. Significant adjustments were not required for new key controls.
3.2 Ongoing monitoring program
As part of its rotational ongoing monitoring plan, the department completed its reassessment of entity-level controls and the financial controls within the business processes of:
- Revenue and accounts receivable / Revenue management; and
- Payroll and benefits.
For the most part, the key controls tested performed as intended and the department did not identify any significant deficiency that could lead to a material misstatement of its financial statements.
4. Departmental action plan for the next fiscal year and subsequent fiscal years
SSC’s rotational ongoing monitoring plan over the next 5 fiscal years is shown in the following table. The ongoing monitoring plan is based on:
- an annual validation of high-risk processes and controls
- related adjustments to the ongoing monitoring plan as required.
| Key control areas | 2023-24 fiscal year | 2024-25 fiscal year | 2025-26 fiscal year | 2026-27 fiscal year | 2027-28 fiscal year |
|---|---|---|---|---|---|
| Entity-level controls | Yes | Yes | No | Yes | Yes |
| ITGC over SIGMA | Yes | No | No | No | Yes |
| ITGC over Feeder Systems Footnote 1 | Yes | No | No | No | Yes |
| Business Process Controls | |||||
| Financial close and reporting | No | Yes | No | No | No |
| Operating expenses and accounts payable | No | Yes | No | No | No |
| Revenue and accounts receivable | No | No | No | Yes | No |
| Capital assets | Yes | No | No | Yes | No |
| Payroll and benefits | No | No | Yes | No | No |
5. Common Service Provider (CSP) Annual Assessment Results for 2022-23 and Action Plan for Future Years
SSC provides IT infrastructure services that are delivered to customer organizations that operate IT systems in legacy, partially modernized or fully modernized environments. A legacy environment refers to an older system inherited from a customer that continues to remain vital to the organization. A partially modernized environment refers to a system that contains a mix of older and updated components that are deployed in an enterprise data centre. A fully modernized environment refers to a system that contains updated components that are deployed in an enterprise data centre.
IT general controls are classified as being either customer-specific controls or common controls. Customer-specific controls operate according to legacy processes and procedures, while common controls operate according to enterprise-wide processes and procedures using common tools. Common controls operate primarily in fully modernized environments, but may also be adopted in a legacy or partially modernized environment.
5.1 Departmental status and action plan for the next fiscal year and subsequent years (CSP)
SSC has implemented a multi-year, risk-based assessment plan for IT General Controls for IT infrastructure services. The multi-year plan is refreshed on an annual basis.
The results of the current year assessment and future plans are detailed below.
| Key control areas | Design effectiveness testing and remediation | Operating effectiveness testing and remediation | Ongoing monitoring rotation |
|---|---|---|---|
| Entity-level controls | Completed | 2023-24 | Future years |
| Common controls | Completed | 2024-25 | Future years |
| Customer-specific controls (DFMSFootnote 2) – Customers with high financial reporting risk | Completed | 2024-25 | Future years |
| Customer-specific controls (DFMSFootnote 3) – Customers with medium financial reporting risk | 2023-24 | 2025-26 | Future years |
| Customer-specific controls (GC central systemsFootnote 4) | Completed | 2024-25 | Future years |
| Customer-specific controls (high revenue systemFootnote 5) | Completed | 2024-25 | Future years |
5.2 Departmental assessment results during fiscal year 2022-23 (CSP)
Assessment of customer-specific controls (DFMS, GC central system and high revenue system)
In fiscal year 2022-23, SSC addressed the outstanding management action plans related to the design effectiveness recommendations to strengthen logical access controls within the infrastructure.
The operating effectiveness assessments have started and ongoing work is performed to revalidate the design effectiveness of the previous tested controls to take into account changes in the organization and processes. There are no significant control observations to note.
Page details
- Date modified: