
FoodNet Canada: Tables and figures 2019
Download in PDF format
(2.45 MB, 50 pages)
Organization: Public Health Agency of Canada
Date published: 2024-10-18
Table of contents
- Executive summary
- Information to the reader
- Campylobacter
- Salmonella
- Shigatoxigenic Escherichia coli (STEC)
- Listeria monocytogenes
- Yersinia
- Shigella
- Parasites
- Targeted study: Raw bivalve molluscs at retail
- Appendix A: Data collection and reporting
- Appendix B: FoodNet Canada sentinel site boundaries
- Appendix C: Non-human sample types tested in 2019
- Appendix D: Abbreviations
Executive summary
The Public Health Agency of Canada's (PHAC) FoodNet Canada, the integrated sentinel site surveillance network for enteric disease in Canada, is pleased to present this tables and figures report which provides the annual results of our surveillance activities conducted in 2019.
The report is based on findings from its sentinel sites in British Columbia, Alberta, and Ontario. It also provides preliminary findings from Quebec, representing a partial year due to their implementation part way through the year in July 2019. The report focuses on trends in enteric pathogen disease rates, as well as trends in the prevalence of these pathogens found on potential disease sources: retail meats, manure from food producing animals and water.
It is our hope that this report will be used to inform and shape discussions on food safety issues regarding enteric diseases and their sources.
Key findings:
- In 2019, Campylobacter and Salmonella remained the most common causes of human enteric illness in the FoodNet Canada sentinel sites.
- Travel continues to be an important factor in the burden of enteric disease. In 2019, approximately 30% of all cases of enteric disease were associated with travel outside of Canada.
- Exposure to retail meat products remains a potential source of infection for human enteric illness. However, decreases in the prevalence of certain pathogen-food combinations were observed in 2019. For example, Salmonella on frozen breaded chicken products significantly decreased in 2019 compared to 2018 and is likely associated with interventions implemented at the industry level in 2019.
- Other exposures, such as the farm environment and water, are also possible sources of infection for human enteric illness, with differences noted between the sites. For example, Salmonella is commonly found in broiler chicken manure, however, the prevalence significantly increased in BC whereas it significantly decreased in the AB site in 2019, resulting in an overall significant decrease in the combined sites.
- The majority of clinical cases of shigatoxigenic Escherichia coli (STEC) were domestically acquired in 2019, with a significant increase in both travel and endemic incidence rates, which is primarily driven by the AB sentinel site who test all STEC-confirmed stool samples for non-O157 serogroups.
- In 2019, surface water sampling was initiated for the first time in the ON site for STEC testing. The prevalence of STEC in the ON site (27%) was similar to the combined BC and AB irrigation water prevalence in 2019 (28%).
- Continued monitoring of human illness and the potential exposures is important to ensure the continued health and safety of Canadians.
The collection and integration of information across all of FoodNet Canada surveillance components (human, retail, on-farm, and water) in an enhanced and standardized way allows for the analysis of subtype distributions among human cases and potential exposure sources over time. This report will be followed by a comprehensive annual report, which will include more extensive analyses of temporal trends and subtyping information for an integrated perspective on enteric disease from exposure to illness.
For information on data collection and reporting and surveillance strategy please see Appendix A.
Information to the reader
FoodNet Canada is a multi-partner sentinel site surveillance system led by the Public Health Agency of Canada (PHAC) that monitors trends in enteric pathogens in Canada.
In collaboration with public health jurisdictions and provincial public health laboratories, FoodNet Canada conducts continuous and episodic surveillance activities in four sentinel sites collecting information across four components: human, retail (meat and produce), on-farm (farm animals), and water. Continuous surveillance occurs throughout the year to identify trends in human disease occurrence, exposure sources, and attributes illnesses to sources and settings for targeted enteric pathogens. Information on the potential sources of risk to human health helps direct food and water safety actions and programming as well as public health interventions, and to evaluate their effectiveness. Specifically, FoodNet Canada's core objectives are to:
- determine what food and other sources are making Canadians ill;
- determine significant risk factors for enteric illness;
- accurately track enteric disease rates and risks over time; and
- provide practical prevention information to assist local and provincial public health officials to:
- prioritize risks;
- compare interventions, direct actions and advance policy; and
- assess effectiveness of food safety activities / public health interventions and measure performance.
Acknowledgements
PHAC acknowledges the significant investments made by FoodNet Canada partners in the four sentinel sites, our provincial and federal government agency colleagues, and academic and industry collaborators who help to make this program a continued success.
Definitions
Endemic: Endemic case of disease are affected individuals who had an infection that was considered sporadic and domestically acquired (i.e. within Canada).
Exposure: Point along the water-borne, food-borne, animal-to-person, or person-to-person transmission route at which people were suspected to have been exposed to a given pathogen.
Travel: Travel-related cases of disease (excludes non-endemic cases) are individuals who travelled outside of Canada, and where the travel dates overlap with the expected disease incubation period (varies depending on the pathogen).
Lost to follow-up: Includes cases that could not be followed up with an interview by public health.
Non-endemic: Includes immigration-related cases where illness was acquired outside of Canada.
Outbreak: Outbreak-related cases of disease are one of a number of affected individuals associated with an increased occurrence of the same infectious disease, whose illness is confirmed through a public health partner (ON, AB, BC and QC sentinel sites) on the basis of laboratory and/or epidemiological evidence.
Shigatoxigenic Escherichia coli (STEC): Escherichia coli are normal intestinal inhabitants in humans and animals, and most strains do not cause enteric disease. However, the group of shigatoxigenic E. coli includes certain toxin-producing strains that can cause severe diarrhea and, in some people (particularly young children), a form of acute kidney failure called hemolytic uremic syndrome.
Significant: The term "significant" in this report has been reserved for statistically significant findings (i.e. p < 0.05).
Campylobacter
Human surveillance summary

Figure 1.1: Text description
| Site | 2015 | 2016 | 2017 | 2018 | 2019 |
|---|---|---|---|---|---|
| Ontario | 20.34 | 27.82 | 26.01 | 21.49 | 26.17 |
| Alberta | 24.97 | 25.59 | 28.37 | 31.37 | 29.85 |
| British Columbia | 32.10 | 34.66 | 38.29 | 31.88 | 28.57 |
| Combined sites | 25.56 | 28.32 | 30.20 | 29.14 | 28.66 |
Figure 1.1 shows a line graph with four lines depicting the annual human incidence rates of campylobacteriosis per 100,000 population (y-axis, vertical) by year (x-axis, horizontal) for each of the individual sentinel sites (Ontario, Alberta and British Columbia) and for all three sentinel sites combined (referred to as 'Combined Sites'), from 2015 to 2019. Different styles of lines have been used to describe the incidence rates for each individual site and all sites combined.

Figure 1.2: Text description
| Site | 2015 | 2016 | 2017 | 2018 | 2019 |
|---|---|---|---|---|---|
| Ontario | 10.07 | 15.98 | 15.69 | 12.98 | 18.18 |
| Alberta | 15.85 | 17.90 | 19.36 | 22.81 | 21.42 |
| British Columbia | 21.90 | 21.38 | 24.29 | 19.13 | 17.93 |
| Combined sites | 15.90 | 18.28 | 19.67 | 19.57 | 19.81 |
Figure 1.2 shows a line graph with four lines depicting the annual human incidence rates of endemic campylobacteriosis per 100,000 population (y-axis, vertical) by year (x-axis, horizontal) for each of the individual sentinel sites (Ontario, Alberta, and British Columbia) and for all three sentinel sites combined (referred to as 'Combined sites'), from 2015 to 2019. Different styles of lines have been used to describe the incidence rates for each individual site and all sites combined.
| Ontario site | Alberta site | British Columbia site | Combined sites (ON, AB, BC)Table 1.1 Footnote a |
Quebec siteTable 1.1 Footnote b | All sitesTable 1.1 Footnote c | ||||||
|---|---|---|---|---|---|---|---|---|---|---|---|
| 2018 | 2019 | 2018 | 2019 | 2018 | 2019 | 2018 | 2019 | 2019 | 2018 | 2019 | |
| Endemic | 12.98 | 18.18Table 1.1 Footnote ↑ | 22.81 | 21.42 | 19.13 | 17.93 | 19.57 | 19.80 | 26.81 | 19.57 | 20.73 |
| Travel | 4.87 | 5.39 | 5.12 | 6.77 | 10.16 | 8.87 | 6.28 | 6.95 | 6.55 | 6.28 | 6.90 |
| Outbreak | 0 | 0 | 0.47 | 0Table 1.1 Footnote ↓ | 0 | 0 | 0.24 | 0Table 1.1 Footnote ↓ | 0 | 0.24 | 0Table 1.1 Footnote ↓ |
| Non-endemic | 0 | 0 | 0 | 0 | 0 | 0 | 0 | 0 | 0 | 0 | 0 |
| Lost to follow-up | 3.65 | 2.60 | 2.98 | 1.65Table 1.1 Footnote ↓ | 2.59 | 1.77 | 3.04 | 1.90Table 1.1 Footnote ↓ | 15.27 | 3.04 | 3.68 |
| Total | 21.49 | 26.17 | 31.37 | 29.85 | 31.88 | 28.57 | 29.14 | 28.66 | 48.62 | 29.14 | 31.31 |
|
|||||||||||
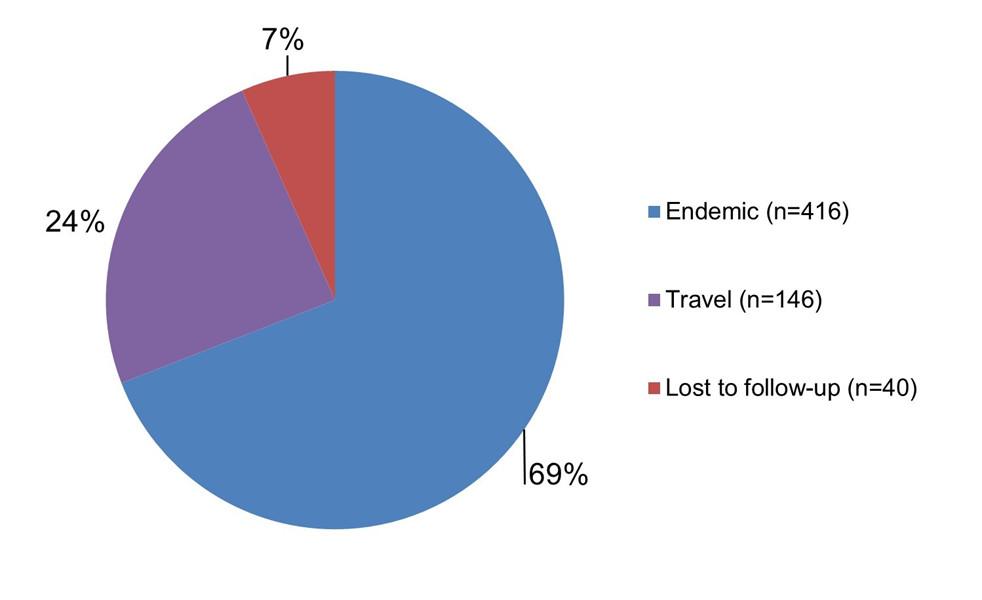
Figure 1.3: Text description
| Case classification | Number of cases | Relative proportion |
|---|---|---|
| Endemic | 416 | 69% |
| Travel | 146 | 24% |
| Lost to follow-up | 40 | 7% |
Figure 1.3 shows a pie chart of the relative proportion of Campylobacter infections in the FoodNet Canada surveillance system by case classification (endemic, travel and lost to follow-up) for 2019, excluding Quebec. The chart includes the case classification, the number of cases and the relative proportion.
| Ontario site | Alberta site | British Columbia site | Combined sites (ON, AB, BC)Table 1.2 Footnote a |
|||||
|---|---|---|---|---|---|---|---|---|
| 2018 | 2019 | 2018 | 2019 | 2018 | 2019 | 2018 | 2019 | |
| C. jejuni | 75.86 | 70.27 | 87.65 | 91.85 | 94.68 | 90.11 | 88.52 | 89.20 |
| C. coli | 6.90 | 5.41 | 6.58 | 6.44 | 5.32 | 5.49 | 6.28 | 6.09 |
| C. upsaliensis | 6.90 | 10.81 | 4.94 | 1.29 | 0 | 1.10 | 3.83 | 2.22 |
| C. lari | 10.34 | 2.70 | 0.41 | 0 | 0 | 2.20 | 1.09 | 0.83 |
| C. concisus | 0 | 5.41 | 0 | 0 | 0 | 0 | 0 | 0.55 |
| C. fetus | 0 | 2.70 | 0.41 | 0 | 0 | 0 | 0.27 | 0.28 |
| C. hyointestinalis | 0 | 0 | 0 | 0.43 | 0 | 0 | 0 | 0.28 |
| C. showae | 0 | 2.70 | 0 | 0 | 0 | 0 | 0 | 0.28 |
| C. ureolyticus | 0 | 0 | 0 | 0 | 0 | 1.10 | 0 | 0.28 |
|
||||||||

Figure 1.4: Text description
| Age category | Female | Male | Overall total (all genders combined) |
|---|---|---|---|
| 0 to 4 | 27.52 | 50.28 | 39.23 |
| 5 to 9 | 10.08 | 25.05 | 17.83 |
| 10 to 14 | 5.12 | 16.16 | 10.79 |
| 15 to 19 | 6.98 | 18.16 | 12.72 |
| 20 to 24 | 21.14 | 22.31 | 21.75 |
| 25 to 29 | 18.64 | 20.62 | 19.65 |
| 30 to 39 | 12.95 | 22.92 | 17.93 |
| 40 to 59 | 14.53 | 23.28 | 18.93 |
| 60+ | 19.27 | 23.65 | 21.33 |
| Overall total (all ages combined) | 15.60 | 24.01 | 19.81 |
Figure 1.4 shows a bar chart of the annual incidence rate of endemic Campylobacter per 100,000 population by overall total age category and by each age category and gender for 2019, excluding Quebec. The y-axis (vertical) presents the incidence rate per 100,000 population and the x-axis (horizontal) presents the age categories. The bars represent the total incidence for all genders by age group as well as the total incidence of male and female separately by age category.
| Most commonly reported symptoms: | 2018 | 2019 |
|---|---|---|
| Diarrhea | 99% | 98% |
| Abdominal pain | 83% | 82% |
| Fatigue or weakness | 78% | 80% |
| Anorexia | 60% | 70% |
| Fever | 66% | 68% |
| Indicators of severity: | 2018 | 2019 |
| Bloody diarrhea | 43% | 35% |
| ER visits | 61% | 55% |
| Hospitalizations | 9% | 10% |
| Antimicrobial prescriptions | 54% | 54% |
Food, animal and environmental surveillance summary
| Sample type | Ontario site | Alberta site | British Columbia site | Combined sites (ON, AB, BC)Table 1.4 Footnote a |
Quebec siteTable 1.4 Footnote b | All sitesTable 1.4 Footnote c | |
|---|---|---|---|---|---|---|---|
| Chicken breast | 40.31% (52/129)Table 1.4 Footnote ↑ |
36.92% (48/130) |
48.09% (63/131) |
41.79% (163/390) |
29.17% (14/48) |
40.41% (177/438) |
|
| Broiler chicken manure | Sample-level | 13.04% (12/92) |
32.50% (39/120) |
34.56% (47/136) |
28.16% (98/348) |
16.67% (20/120) |
25.21% (118/468) |
| Farm-level | 13.04% (3/23) |
33.33% (10/30) |
35.29% (12/34) |
28.74% (25/87) |
23.33% (7/30) |
27.35% (32/117) |
|
| Swine manure | Sample-level | 72.77% (139/191) |
66.67% (80/120) |
NT | 70.42% (219/311)Table 1.4 Footnote ↓ |
61.90% (104/168) |
67.43% (323/479)Table 1.4 Footnote ↓ |
| Farm-level | 96.88% (31/32) |
85.00% (17/20) |
NT | 92.31% (48/52) |
78.57% (22/28) |
87.50% (70/80) |
|
| Turkey manure | Sample-level | 45.83% (55/120) |
50.00% (20/40) |
70.16% (87/124) |
57.04% (162/284) |
46.09% (53/115) |
53.88% (215/399) |
| Farm-level | 53.33% (16/30) |
50.00% (5/10) |
74.19% (23/31) |
61.97% (44/71) |
48.28% (14/29) |
58.00% (58/100) |
|
| Feedlot beef manure | Sample-level | NT | 37.16% (110/296)Table 1.4 Footnote ↓ |
NT | n/a | NT | n/a |
| Farm-level | NT | 66.67% (20/30)Table 1.4 Footnote ↓ |
NT | n/a | NT | n/a | |
| Irrigation water | NT | 29.17% (7/24) |
11.43% (12/105) |
14.73% (19/129) |
NT | n/a | |
NT: Not tested. |
|||||||

Figure 1.5: Text description
| Subtype | Irrigation water | Feedlot beef manure | Swine manure | Turkey manure | Broiler chicken manure | Chicken breast |
|---|---|---|---|---|---|---|
| C. jejuni | 57.89% | 30.00% | 0.00% | 62.96% | 90.82% | 88.96% |
| C. coli | 26.32% | 70.00% | 100.00% | 31.48% | 9.18% | 11.04% |
| Other | 15.79% | 0.00% | 0.00% | 5.56% | 0.00% | 0.00% |
Figure 1.5 shows a stacked horizontal bar chart representing the proportion of all positive samples for Campylobacter jejuni, Campylobacter coli, and other Campylobacter positive samples, by sample type (irrigation water, feedlot beef manure, swine manure, turkey manure, broiler chicken manure and chicken breast) for 2019, excluding Quebec. The y-axis (vertical) represents the sample type and the x-axis (horizontal) represents the percent of all Campylobacter positive samples. The stacked bars represent the subtype distribution (proportion by subtype for Campylobacter positive samples) for each sample type.
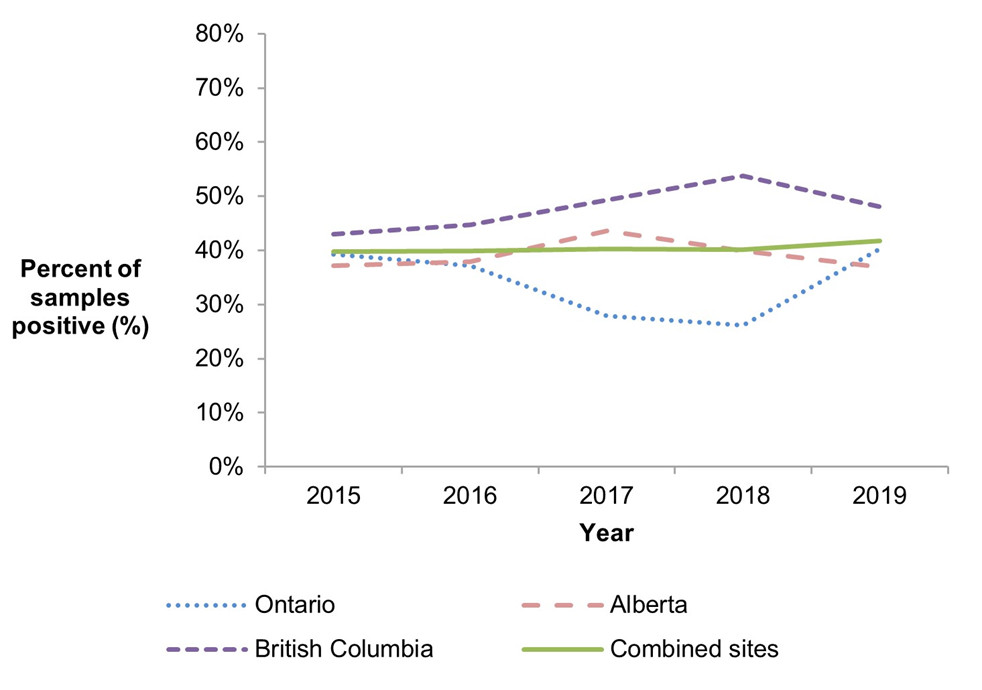
Figure 1.6: Text description
| Site | 2015 | 2016 | 2017 | 2018 | 2019 |
|---|---|---|---|---|---|
| Ontario | 39.26% | 37.12% | 27.91% | 26.19% | 40.31% |
| Alberta | 37.12% | 37.88% | 43.65% | 39.85% | 36.92% |
| British Columbia | 42.96% | 44.70% | 49.24% | 53.79% | 48.09% |
| Combined sites | 39.80% | 39.90% | 40.31% | 40.15% | 41.79% |
Figure 1.6 shows a line graph with four lines depicting the proportion of retail chicken breast samples positive for Campylobacter (y-axis, vertical) by sampling year (x-axis, horizontal) for each of the individual sentinel sites (Ontario, Alberta, and British Columbia) and for all three sentinel sites combined (referred to as 'Combined Sites'), from 2015 to 2019. Different styles of lines have been used to describe the proportions for each individual site and all sites combined.

Figure 1.7: Text description
| Site | 2015 | 2016 | 2017 | 2018 | 2019 |
|---|---|---|---|---|---|
| Ontario | 23.86% | 4.55% | 38.24% | 5.26% | 13.04% |
| Alberta | 34.17% | 20.00% | 23.33% | 34.17% | 32.50% |
| British Columbia | 25.00% | 24.22% | 36.67% | 38.33% | 34.56% |
| Combined sites | 28.25% | 17.56% | 31.82% | 28.80% | 28.16% |
Figure 1.7 shows a line graph with four lines depicting the proportion of farm broiler chicken manure samples positive for Campylobacter (y-axis, vertical) by sampling year (x-axis, horizontal) for each of the individual sentinel sites (Ontario, Alberta and British Columbia) and for all three sentinel sites combined (referred to as 'Combined Sites'), from 2015 to 2019. Different styles of lines have been used to describe the proportions for each individual site and all sites combined.

Figure 1.8: Text description
| Site | 2015 | 2016 | 2017 | 2018 | 2019 |
|---|---|---|---|---|---|
| Ontario | no data | 56.03% | 52.08% | 51.79% | 45.83% |
| Alberta | no data | no data | no data | 35.00% | 50.00% |
| British Columbia | 85.83% | 68.10% | 75.00% | 78.99% | 70.16% |
| Combined sites | no data | 62.07% | 64.22% | 61.25% | 57.04% |
Figure 1.8 shows a line graph with four lines depicting the proportion of farm turkey manure samples positive for Campylobacter (y-axis, vertical) by sampling year (x-axis, horizontal) for each of the individual sentinel sites (Ontario, British Columbia, and Alberta) and for all three sentinel sites combined (referred to as 'Combined sites'), from 2015 to 2019. Different styles of lines have been used to describe the proportions for each individual site and all sites combined.
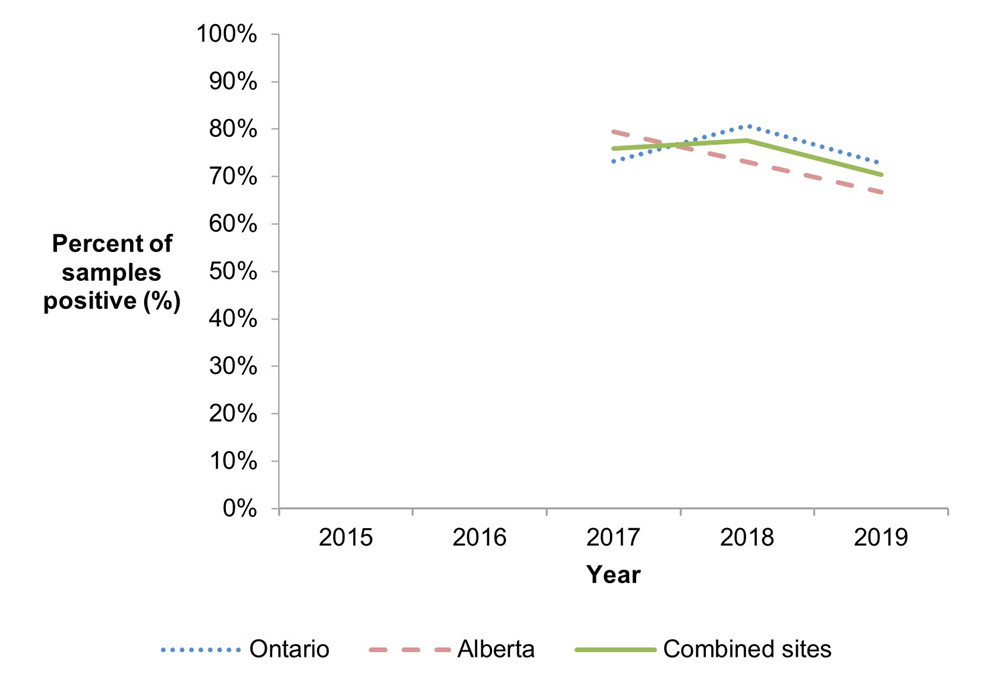
Figure 1.9: Text description
| Site | 2015 | 2016 | 2017 | 2018 | 2019 |
|---|---|---|---|---|---|
| Ontario | no data | no data | 73.19% | 80.65% | 72.77% |
| Alberta | no data | no data | 79.41% | 73.02% | 66.67% |
| Combined sites | no data | no data | 75.83% | 77.56% | 70.42% |
Figure 1.9 shows a line graph with three lines depicting the proportion of farm swine manure samples positive for Campylobacter (y-axis, vertical) by sampling year (x-axis, horizontal) for each of the individual sentinel sites (Ontario and Alberta) and for both sentinel sites combined (referred to as 'Combined sites'), from 2015 to 2019. Different styles of lines have been used to describe the proportions for each individual site and all sites combined.
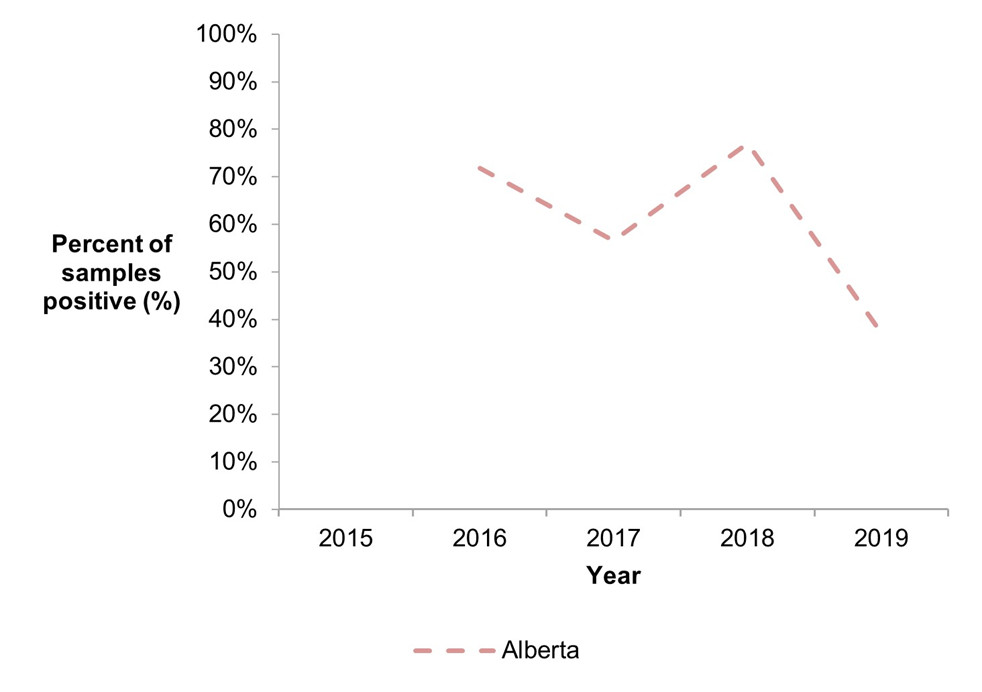
Figure 1.10: Text description
| Site | 2015 | 2016 | 2017 | 2018 | 2019 |
|---|---|---|---|---|---|
| Alberta | no data | 71.79% | 56.58% | 77.05% | 37.16% |
Figure 1.10 shows a line graph with one line depicting the proportion of farm feedlot beef manure samples positive for Campylobacter (y-axis, vertical) by sampling year (x-axis, horizontal) for the Alberta sentinel site, from 2015 to 2019.
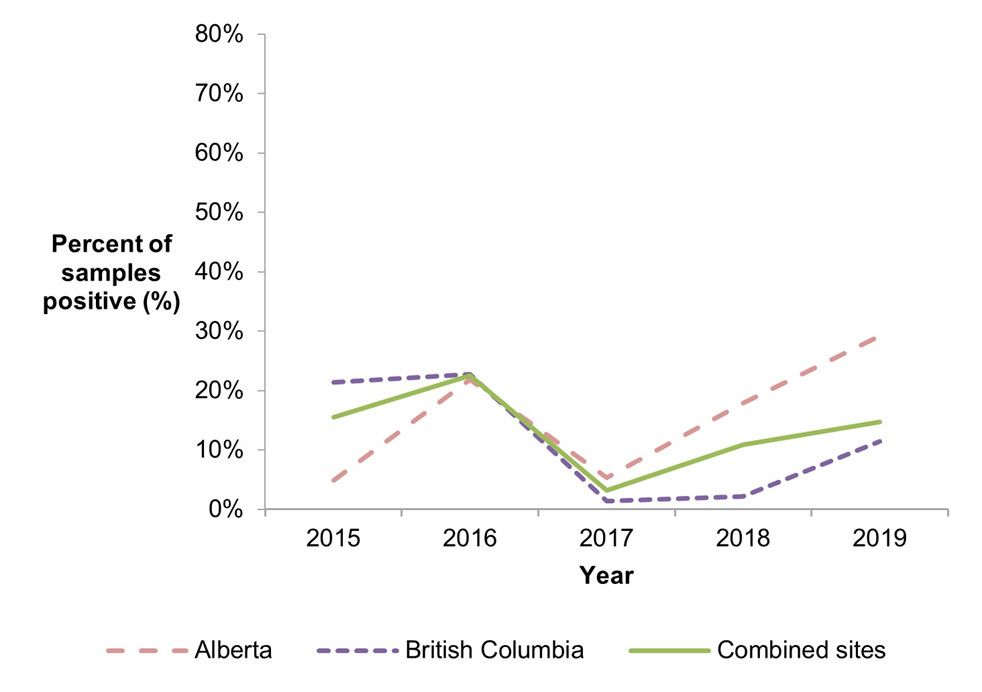
Figure 1.11: Text description
| Site | 2015 | 2016 | 2017 | 2018 | 2019 |
|---|---|---|---|---|---|
| Alberta | 4.88% | 21.88% | 5.36% | 17.86% | 29.17% |
| British Columbia | 21.33% | 22.73% | 1.43% | 2.22% | 11.43% |
| Combined sites | 15.52% | 22.54% | 3.17% | 10.89% | 14.73% |
Figure 1.11 shows a line graph with three lines depicting the proportion of irrigation water samples positive for Campylobacter (y-axis, vertical) by sampling year (x-axis, horizontal) for each of the individual sentinel sites (Alberta and British Columbia) and for both sentinel sites combined (referred to as 'Combined Sites'), from 2015 to 2019. Different styles of lines have been used to describe the proportions for each individual site and all sites combined.
Salmonella
Human surveillance summary
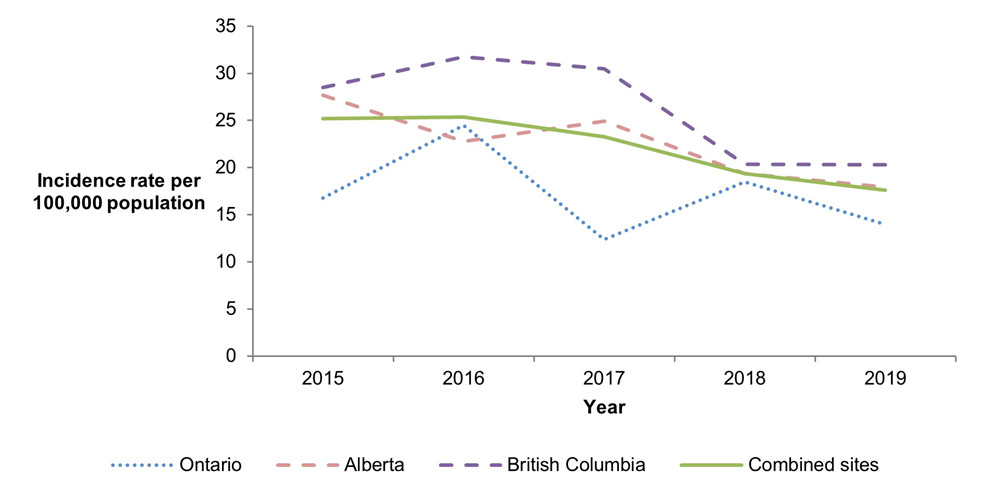
Figure 2.1: Text description
| Site | 2015 | 2016 | 2017 | 2018 | 2019 |
|---|---|---|---|---|---|
| Ontario | 16.78 | 24.49 | 12.39 | 18.45 | 13.98 |
| Alberta | 27.65 | 22.77 | 24.92 | 19.36 | 17.94 |
| British Columbia | 28.49 | 31.76 | 30.47 | 20.32 | 20.29 |
| Combined sites | 25.20 | 25.36 | 23.25 | 19.38 | 17.57 |
Figure 2.1 shows a line graph with four lines depicting the annual human incidence rates of salmonellosis per 100,000 population (y-axis, vertical) by year (x-axis, horizontal) for each of the individual sentinel sites (Ontario, Alberta and British Columbia) and for all three sentinel sites combined (referred to as 'Combined sites'), from 2015 to 2019. Different styles of lines have been used to describe the incidence rates for each individual site and all sites combined.
- Figure 2.1 Footnote *
-
Typhi and Paratyphi (except Paratyphi B var Java) are not reported by the Alberta site.
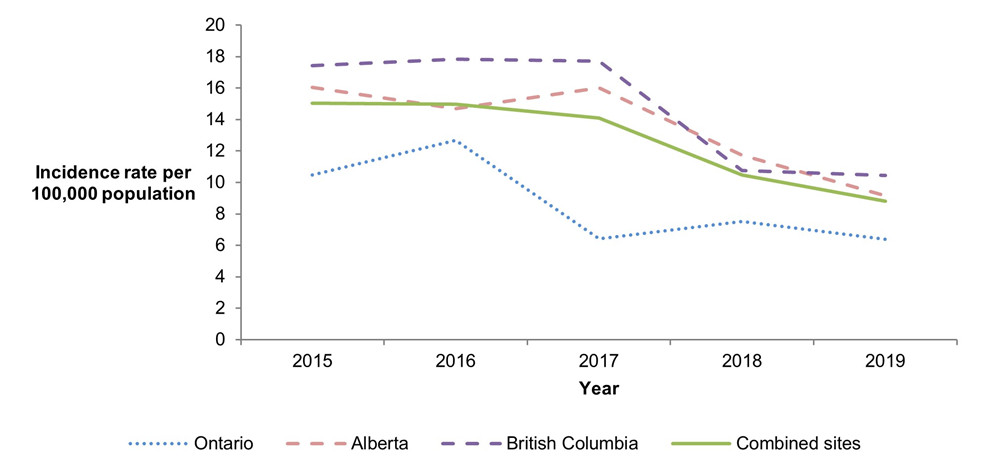
Figure 2.2: Text description
| Site | 2015 | 2016 | 2017 | 2018 | 2019 |
|---|---|---|---|---|---|
| Ontario | 10.49 | 12.66 | 6.40 | 7.50 | 6.39 |
| Alberta | 16.05 | 14.69 | 16.01 | 11.73 | 9.16 |
| British Columbia | 17.43 | 17.85 | 17.70 | 10.76 | 10.44 |
| Combined sites | 15.03 | 14.96 | 14.11 | 10.49 | 8.81 |
Figure 2.2 shows a line graph with four lines depicting the annual human incidence rates of endemic salmonellosis per 100,000 population (y-axis, vertical) by year (x-axis, horizontal) for each of the individual sentinel sites (Ontario, Alberta and British Columbia) and for all three sentinel sites combined (referred to as 'Combined sites'), from 2015 to 2019. Different styles of lines have been used to describe the incidence rates for each individual site and all sites combined.
- Figure 2.2 Footnote *
-
Typhi and Paratyphi (except Paratyphi B var Java) are not reported by the Alberta site.
| Ontario site | Alberta siteTable 2.1 Footnote † | British Columbia site | Combined sites (ON, AB, BC)Table 2.1 Footnote a |
Quebec siteTable 2.1 Footnote b | All sitesTable 2.1 Footnote c | ||||||
|---|---|---|---|---|---|---|---|---|---|---|---|
| 2018 | 2019 | 2018 | 2019 | 2018 | 2019 | 2018 | 2019 | 2019 | 2018 | 2019 | |
| Endemic | 7.50 | 6.39 | 11.73 | 9.16 | 10.76 | 10.44 | 10.49 | 8.81 | 11.53 | 10.49 | 9.17 |
| Travel | 5.07 | 5.19 | 5.21 | 5.22 | 6.58 | 7.88 | 5.51 | 5.86 | 0.62 | 5.51 | 5.16 |
| Outbreak | 5.27 | 1.00Table 2.1 Footnote ↓ | 1.02 | 1.65 | 1.99 | 0.59 | 2.27 | 1.24Table 2.1 Footnote ↓ | 0.62 | 2.27 | 1.16Table 2.1 Footnote ↓ |
| Non-endemic | 0 | 0.40 | 0 | 0.09 | 0 | 0 | 0 | 0.14 | 0 | 0 | 0.12 |
| Lost to follow-up | 0.61 | 1.00 | 1.40 | 1.83 | 1.00 | 1.38 | 1.11 | 1.52 | 3.74 | 1.11 | 1.82 |
| Total | 18.45 | 13.98 | 19.36 | 17.94 | 20.32 | 20.29 | 19.38 | 17.57 | 16.52 | 19.38 | 17.43 |
|
|||||||||||

Figure 2.3: Text description
| Case classification | Number of cases | Relative proportion |
|---|---|---|
| Endemic | 185 | 50% |
| Travel | 123 | 33% |
| Outbreak | 26 | 7% |
| Non-endemic | 3 | 1% |
| Lost to follow-up | 32 | 9% |
Figure 2.3 shows a pie chart of the relative proportion of Salmonella infections in the FoodNet Canada surveillance system by case classification (endemic, travel, outbreak, non-endemic and lost to follow-up) for 2019, excluding Quebec. The chart includes the case classification, the number of cases and the relative proportion.
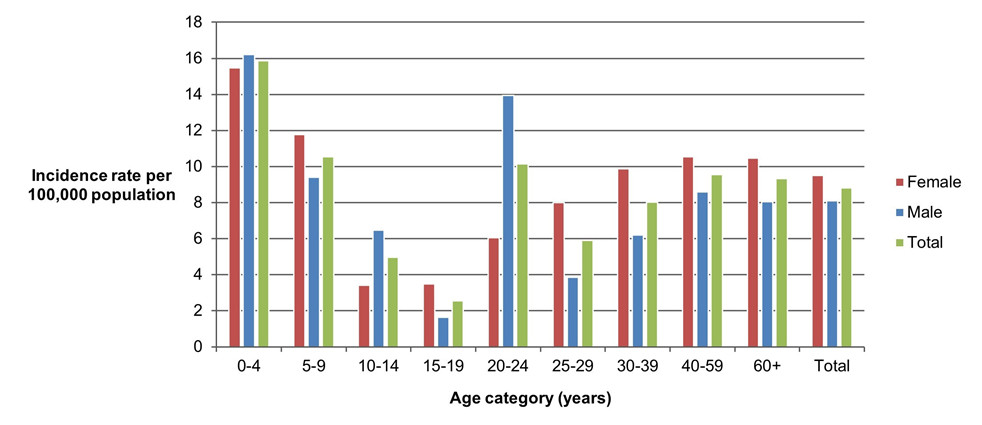
Figure 2.4: Text description
| Age category | Female | Male | Overall total (all genders combined) |
|---|---|---|---|
| 0-4 | 15.48 | 16.22 | 15.86 |
| 5-9 | 11.76 | 9.40 | 10.54 |
| 10-14 | 3.41 | 6.46 | 4.98 |
| 15-19 | 3.49 | 1.65 | 2.54 |
| 20-24 | 6.04 | 13.94 | 10.15 |
| 25-29 | 7.99 | 3.87 | 5.89 |
| 30-39 | 9.87 | 6.19 | 8.04 |
| 40-59 | 10.53 | 8.59 | 9.56 |
| 60+ | 10.48 | 8.04 | 9.33 |
| Overall total (all ages combined) | 9.51 | 8.10 | 8.81 |
Figure 2.4 shows a bar chart of the annual incidence rate of endemic Salmonella per 100,000 population by overall total age category and by each age category and gender for 2019, excluding Quebec. The y-axis (vertical) presents the incidence rate per 100,000 population and the x-axis (horizontal) presents the age categories. The bars represent the total incidence for all genders by age group as well as the total incidence of male and female separately by age category.
| Most commonly reported symptoms: | 2018 | 2019 |
|---|---|---|
| Diarrhea | 92% | 91% |
| Abdominal pain | 80% | 79% |
| Fatigue or weakness | 74% | 74% |
| Anorexia | 69% | 68% |
| Fever | 68% | 67% |
| Indicators of severity: | 2018 | 2019 |
| Bloody diarrhea | 36% | 32% |
| Emergency room visits | 62% | 56% |
| Hospitalizations | 19% | 17% |
| Antimicrobial prescriptions | 45% | 45% |
Food, animal and environmental surveillance summary
| Sample type | Ontario site | Alberta site | British Columbia site | Combined sites (ON, AB, BC)Table 2.3 Footnote a |
Quebec siteTable 2.3 Footnote b | All sitesTable 2.3 Footnote c | |
|---|---|---|---|---|---|---|---|
| Chicken breast | 14.73% (19/129) |
11.54% (15/130)Table 2.3 Footnote ↓ |
22.73% (30/132) |
16.37% (64/391) |
45.83% (22/48) |
19.59% (86/439) |
|
| Frozen breaded chicken productsTable 2.3 Footnote d | 16.24% (19/117) |
18.97% (22/116) |
15.91% (21/132)Table 2.3 Footnote ↓ |
16.99% (62/365)Table 2.3 Footnote ↓ |
13.79% (4/29) |
16.75% (66/394)Table 2.3 Footnote ↓ |
|
| Pork sausage | 9.29% (13/140) |
2.80% (4/143) |
3.05% (4/131) |
5.07% (21/414) |
3.33% (1/30) |
4.95% (22/444) |
|
| Broiler chicken manure | Sample-level | 36.96% (34/92) |
14.17% (17/120)Table 2.3 Footnote ↓ |
75.00% (102/136)Table 2.3 Footnote ↑ |
43.97% (153/348)Table 2.3 Footnote ↓ |
77.50% (93/120) |
52.56% (246/468) |
| Farm-level | 43.48% (10/23) |
30.00% (9/30)Table 2.3 Footnote ↓ |
85.29% (29/34) |
55.17% (48/87) |
90.00% (27/30) |
64.10% (75/117) |
|
| Swine manure | Sample-level | 28.80% (55/191) |
2.50% (3/120) |
NT | 18.65% (58/311) |
34.52% (58/168) |
24.22% (116/479) |
| Farm-level | 62.50% (20/32) |
5.00% (1/20) |
NT | 40.38% (21/52) |
67.86% (19/28) |
50.00% (40/80) |
|
| Turkey manure | Sample-level | 83.33% (100/120) |
77.50% (31/40) |
70.16% (87/124)Table 2.3 Footnote ↑ |
76.76% (218/284) |
72.17% (83/115) |
75.44% (301/399) |
| Farm-level | 90.00% (27/30) |
80.00% (8/10) |
74.19% (23/31) |
81.69% (58/71) |
82.76% (24/29) |
82.00% (82/100) |
|
| Feedlot beef manure | Sample-level | NT | 4.39% (13/296) |
NT | n/a | NT | n/a |
| Farm-level | NT | 23.33% (7/30) |
NT | n/a | NT | n/a | |
| Irrigation water | NT | 20.83% (5/24) |
8.57% (9/105) |
10.85% (14/129) |
NT | n/a | |
NT: Not tested. |
|||||||
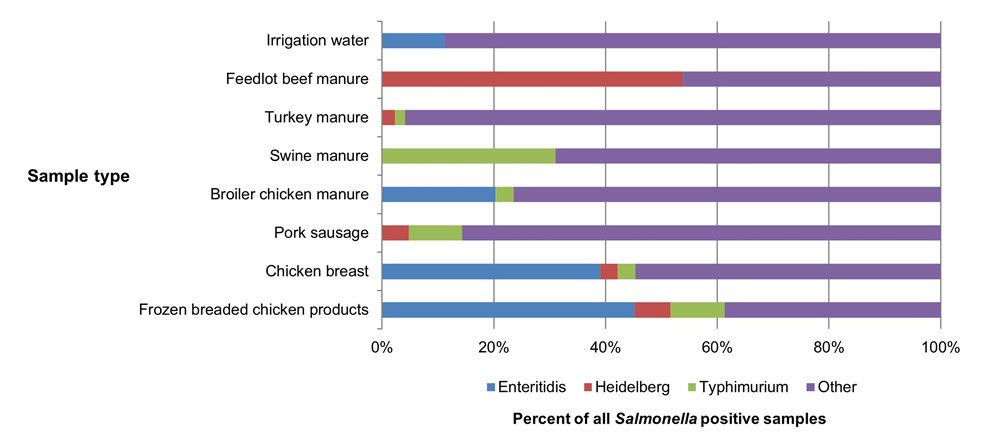
Figure 2.5: Text description
| Sample type | Enteritidis | Heidelberg | Typhimurium | Other |
|---|---|---|---|---|
| Frozen breaded chicken products | 45.16% | 6.45% | 9.68% | 38.71% |
| Chicken breast | 39.06% | 3.13% | 3.13% | 54.69% |
| Pork sausage | 0.00% | 4.76% | 9.52% | 85.71% |
| Broiler chicken manure | 20.26% | 0.00% | 3.27% | 76.47% |
| Swine manure | 0.00% | 0.00% | 31.03% | 68.97% |
| Turkey manure | 0.00% | 2.29% | 1.83% | 95.87% |
| Feedlot beef manure | 0.00% | 53.85% | 0.00% | 46.15% |
| Irrigation water | 11.11% | 0.00% | 0.00% | 88.89% |
Figure 2.5 shows a stacked horizontal bar chart representing the proportion of all positive samples for selected Salmonella serovars: Enteritidis, Heidelberg, Typhimurium and Other, by sample type (irrigation water, feedlot beef manure, turkey manure, swine manure, broiler chicken manure, pork sausage, chicken breast, and frozen breaded chicken products) for 2019, excluding Quebec. The y-axis (vertical) represents the sample type, and the x-axis (horizontal) represents the percent of all Salmonella positive samples. The stacked bars represent the serovar distribution (proportion by serovar for Salmonella positive samples) for each sample type.
- Figure 2.5 Footnote *
-
FoodNet Canada began sampling cooked frozen breaded chicken products (FBCP) in 2019, in addition to uncooked FBCP. Figure excludes Alberta site irrigation water Salmonella isolates, as serotyping data are unavailable.

Figure 2.6: Text description
| Site | 2015 | 2016 | 2017 | 2018 | 2019 |
|---|---|---|---|---|---|
| Ontario | 18.52% | 12.88% | 10.61% | 14.29% | 14.73% |
| Alberta | 16.67% | 28.79% | 19.05% | 21.05% | 11.54% |
| British Columbia | 33.33% | 29.55% | 28.79% | 22.73% | 22.73% |
| Combined sites | 22.89% | 23.74% | 19.49% | 19.44% | 16.37% |
Figure 2.6 shows a line graph with four lines depicting the proportion of retail chicken breast samples positive for Salmonella (y-axis, vertical) by sampling year (x-axis, horizontal) for each of the individual sentinel sites (Ontario, British Columbia, and Alberta) and for all three sentinel sites combined (referred to as 'Combined sites'), from 2015 to 2019. Different styles of lines have been used to describe the proportions for each individual site and all sites combined.
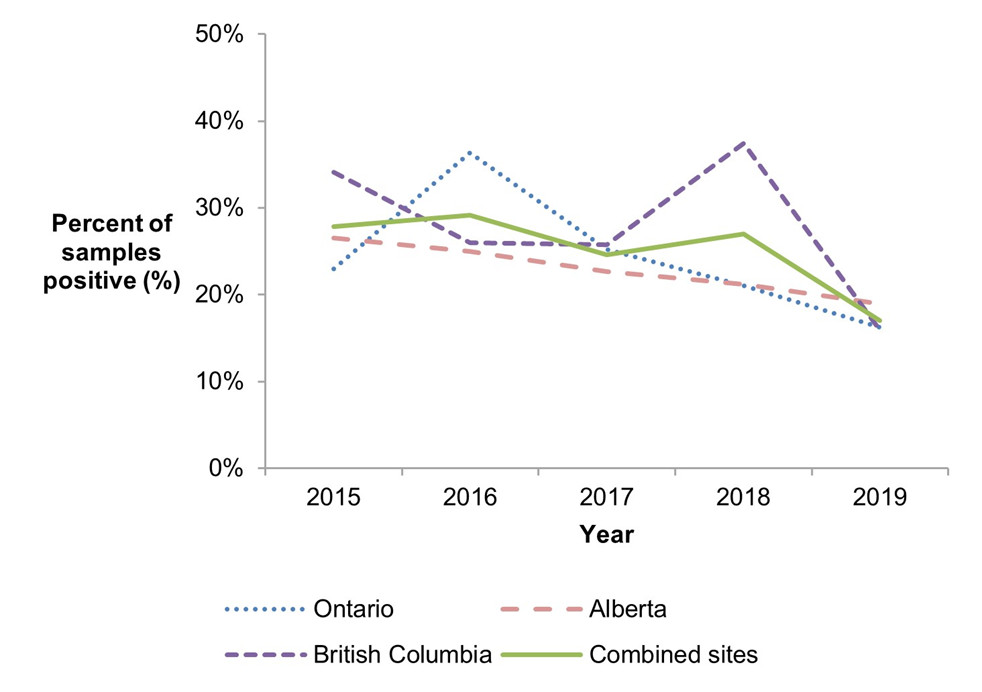
Figure 2.7: Text description
| Site | 2015 | 2016 | 2017 | 2018 | 2019 |
|---|---|---|---|---|---|
| Ontario | 22.96% | 36.36% | 25.19% | 21.05% | 16.24% |
| Alberta | 26.52% | 25.00% | 22.66% | 21.19% | 18.97% |
| British Columbia | 34.07% | 25.95% | 25.76% | 37.40% | 15.91% |
| Combined sites | 27.86% | 29.11% | 24.55% | 27.00% | 16.99% |
Figure 2.7 shows a line graph with four lines depicting the proportion of retail frozen breaded chicken product samples positive for Salmonella (y-axis, vertical) by sampling year (x-axis, horizontal) for each of the individual sentinel sites (Ontario, British Columbia, and Alberta) and for all three sentinel sites combined (referred to as 'Combined sites'), from 2015 to 2019. Different styles of lines have been used to describe the proportions for each individual site and all sites combined.
- Figure 2.7 Footnote *
-
FoodNet Canada began sampling cooked frozen breaded chicken products (FBCP) in 2019, in addition to uncooked FBCP.
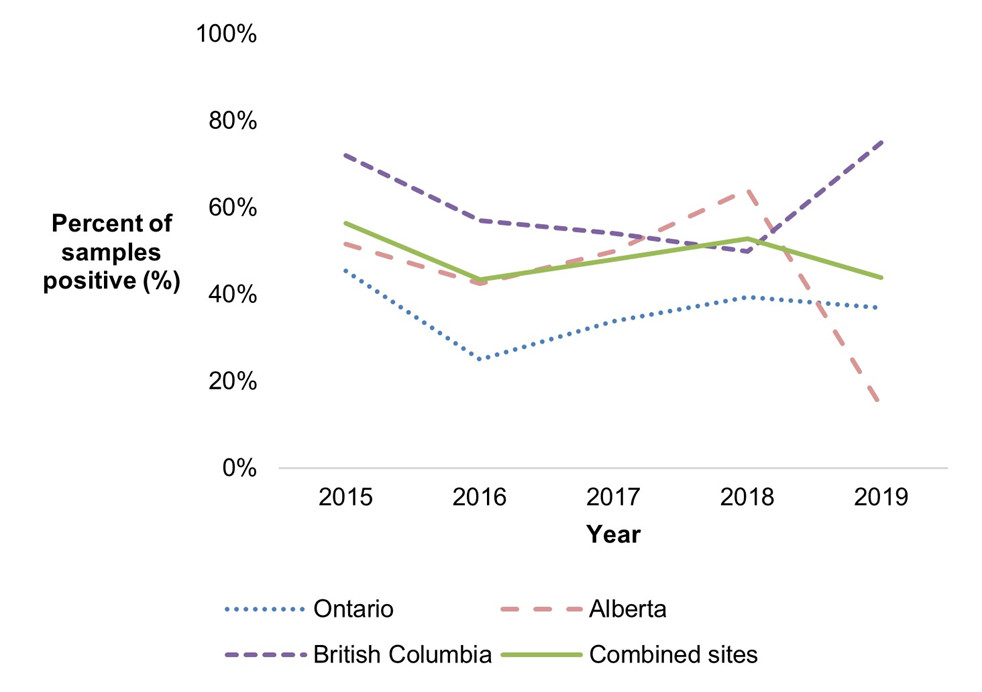
Figure 2.8: Text description
| Site | 2015 | 2016 | 2017 | 2018 | 2019 |
|---|---|---|---|---|---|
| Ontario | 45.45% | 25.00% | 33.82% | 39.47% | 36.96% |
| Alberta | 51.67% | 42.50% | 50.00% | 64.17% | 14.17% |
| British Columbia | 72.00% | 57.03% | 54.17% | 50.00% | 75.00% |
| Combined sites | 56.49% | 43.45% | 48.05% | 52.85% | 43.97% |
Figure 2.8 shows a line graph with four lines depicting the proportion of farm broiler chicken manure samples positive for Salmonella (y-axis, vertical) by sampling year (x-axis, horizontal) for each of the individual sentinel sites (Ontario, British Columbia, and Alberta) and for all three sentinel sites combined (referred to as 'Combined sites'), from 2015 to 2019. Different styles of lines have been used to describe the proportions for each individual site and all sites combined.

Figure 2.9: Text description
| Site | 2015 | 2016 | 2017 | 2018 | 2019 |
|---|---|---|---|---|---|
| Ontario | no data | 60.34% | 69.79% | 82.14% | 83.33% |
| Alberta | no data | no data | no data | 77.50% | 77.50% |
| British Columbia | 39.17% | 43.10% | 43.52% | 55.46% | 70.16% |
| Combined sites | no data | 51.72% | 55.88% | 69.74% | 76.76% |
Figure 2.9 shows a line graph with four lines depicting the proportion of farm turkey manure samples positive for Salmonella (y-axis, vertical) by sampling year (x-axis, horizontal) for each of the individual sentinel sites (Ontario, British Columbia, and Alberta) and for all three sentinel sites combined (referred to as 'Combined sites'), from 2015 to 2019. Different styles of lines have been used to describe the proportions for each individual site and all sites combined.
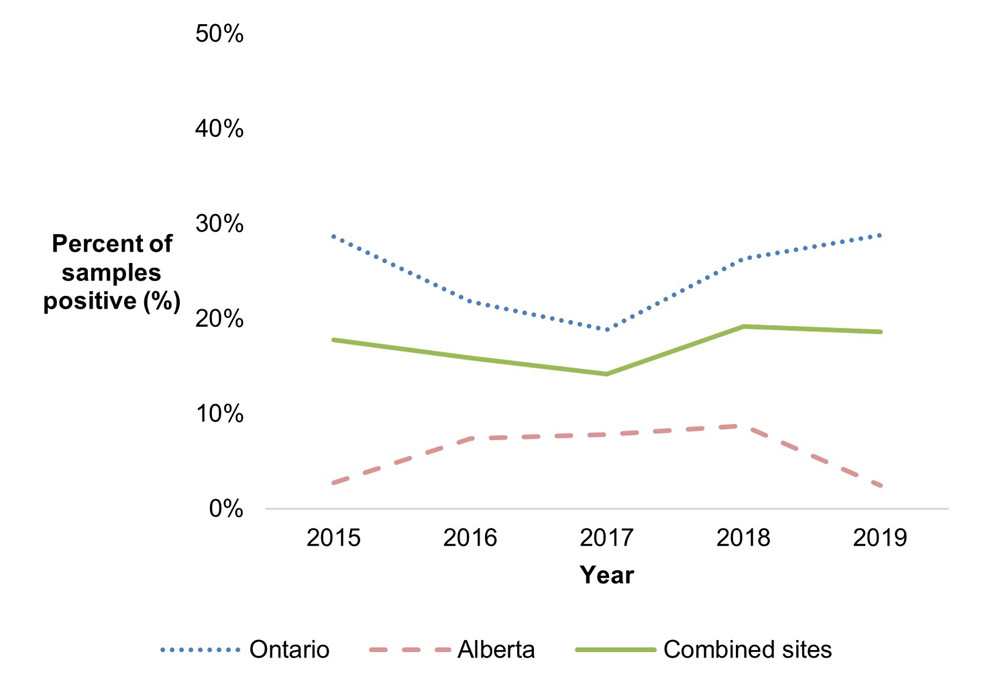
Figure 2.10: Text description
| Site | 2015 | 2016 | 2017 | 2018 | 2019 |
|---|---|---|---|---|---|
| Ontario | 28.67% | 21.79% | 18.84% | 26.34% | 28.80% |
| Alberta | 2.78% | 7.41% | 7.84% | 8.73% | 2.50% |
| Combined sites | 17.83% | 15.91% | 14.17% | 19.23% | 18.65% |
Figure 2.10 shows a line graph with three lines depicting the proportion of farm swine manure samples positive for Salmonella (y-axis, vertical) by sampling year (x-axis, horizontal) for each of the individual sentinel sites (Ontario and Alberta) and for both sentinel sites combined (referred to as 'Combined sites'), from 2015 to 2019. Different styles of lines have been used to describe the proportions for each individual site and all sites combined.

Figure 2.11: Text description
| Site | 2015 | 2016 | 2017 | 2018 | 2019 |
|---|---|---|---|---|---|
| Alberta | no data | 3.85% | 1.32% | 1.64% | 4.39% |
Figure 2.11 shows a line graph with one line depicting the proportion of farm feedlot beef manure samples positive for Salmonella (y-axis, vertical) by sampling year (x-axis, horizontal) for the Alberta sentinel site, from 2015 to 2019.
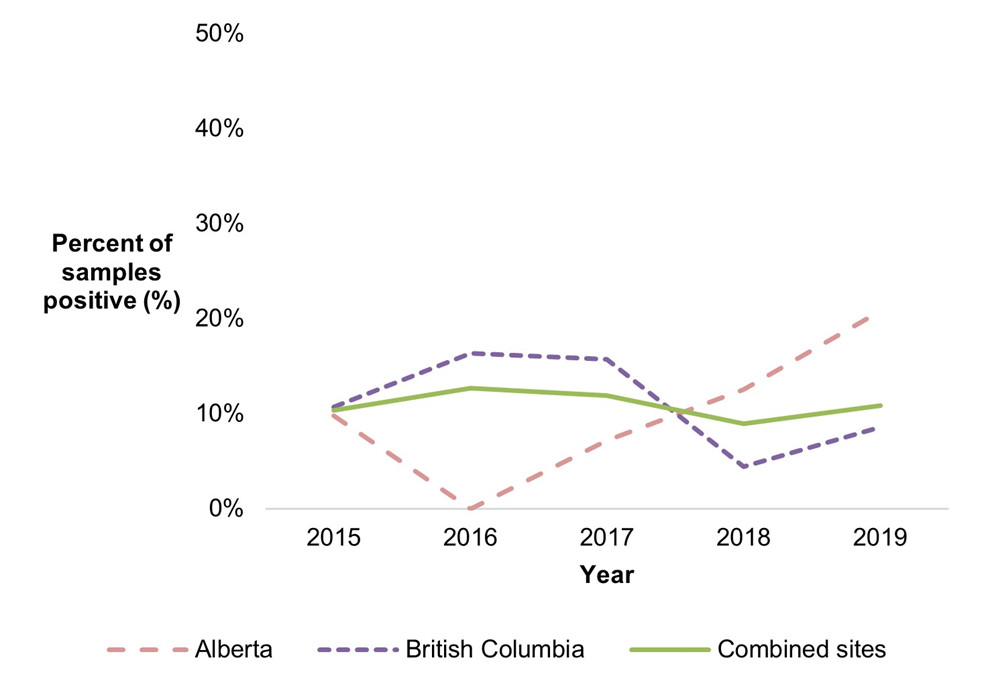
Figure 2.12: Text description
| Site | 2015 | 2016 | 2017 | 2018 | 2019 |
|---|---|---|---|---|---|
| Alberta | 9.76% | 0.00% | 7.14% | 12.50% | 20.83% |
| British Columbia | 10.67% | 16.36% | 15.71% | 4.44% | 8.57% |
| Combined sites | 10.34% | 12.68% | 11.90% | 8.91% | 10.85% |
Figure 2.12 shows a line graph with three lines depicting the proportion of irrigation water samples positive for Salmonella (y-axis, vertical) by sampling year (x-axis, horizontal) for each of the individual sentinel sites (Alberta and British Columbia) and for both sentinel sites combined (referred to as 'Combined sites'), from 2015 to 2019. Different styles of lines have been used to describe the proportions for each individual site and all sites combined.
Shigatoxigenic Escherichia coli (STEC)
Human surveillance summary
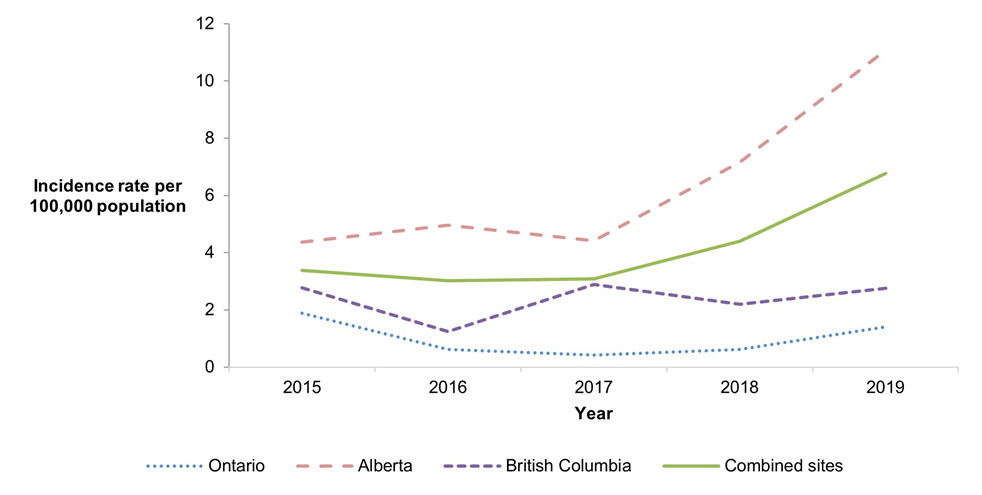
Figure 3.1: Text description
| Site | 2015 | 2016 | 2017 | 2018 | 2019 |
|---|---|---|---|---|---|
| Ontario | 1.89 | 0.62 | 0.41 | 0.61 | 1.40 |
| Alberta | 4.36 | 4.96 | 4.41 | 7.17 | 11.08 |
| British Columbia | 2.76 | 1.25 | 2.88 | 2.19 | 2.76 |
| Combined sites | 3.37 | 3.01 | 3.08 | 4.40 | 6.76 |
Figure 3.1 shows a line graph with four lines depicting the annual human incidence rates of shigatoxigenic Escherichia coli infections per 100,000 population (y-axis, vertical) by year (x-axis, horizontal) for each of the individual sentinel sites (Ontario, Alberta and British Columbia) and for all three sentinel sites combined (referred to as 'Combined sites'), from 2015 to 2019. Different styles of lines have been used to describe the incidence rates for each individual site and all sites combined.
- Figure 3.1 Footnote *
-
Starting June 11, 2018, the AB site began testing all STEC samples for non-O157, in addition to continuing O157 testing.
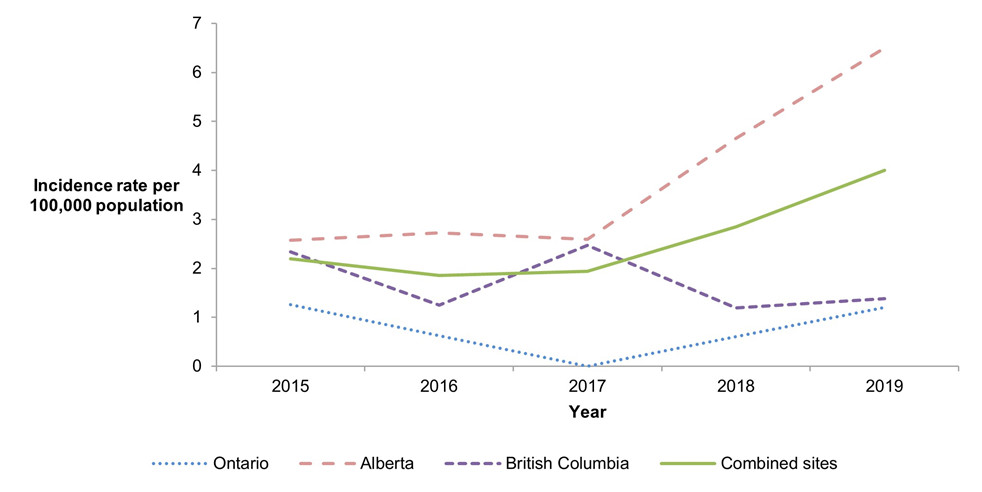
Figure 3.2: Text description
| Site | 2015 | 2016 | 2017 | 2018 | 2019 |
|---|---|---|---|---|---|
| Ontario | 1.26 | 0.62 | 0.00 | 0.61 | 1.20 |
| Alberta | 2.58 | 2.72 | 2.59 | 4.66 | 6.50 |
| British Columbia | 2.34 | 1.25 | 2.47 | 1.20 | 1.38 |
| Combined sites | 2.20 | 1.86 | 1.94 | 2.85 | 4.00 |
Figure 3.2 shows a line graph with four lines depicting the annual human incidence rates of endemic shigatoxigenic Escherichia coli per 100,000 population (y-axis, vertical) by year (x-axis, horizontal) for each of the individual sentinel sites (Ontario, Alberta and British Columbia) and for all three sentinel sites combined (referred to as 'Combined sites'), from 2015 to 2019. Different styles of lines have been used to describe the incidence rates for each individual site and all sites combined.
- Figure 3.2 Footnote *
-
Starting June 11, 2018, the AB site began testing all STEC samples for non-O157, in addition to continuing O157 testing.
| Ontario site | Alberta siteTable 3.1 Footnote † | British Columbia site | Combined sites (ON, AB, BC)Table 3.1 Footnote a |
Quebec siteTable 3.1 Footnote b | All sitesTable 3.1 Footnote c | ||||||
|---|---|---|---|---|---|---|---|---|---|---|---|
| 2018 | 2019 | 2018 | 2019 | 2018 | 2019 | 2018 | 2019 | 2019 | 2018 | 2019 | |
| Endemic | 0.61 | 1.20 | 4.66 | 6.50 | 1.20 | 1.38 | 2.85 | 4.00Table 3.1 Footnote ↑ | 3.12 | 2.85 | 3.88 |
| Travel | 0 | 0.20 | 1.58 | 3.85Table 3.1 Footnote ↑ | 1.00 | 1.38 | 1.06 | 2.38Table 3.1 Footnote ↑ | 0 | 1.06 | 2.06Table 3.1 Footnote ↑ |
| Outbreak | 0 | 0 | 0.93 | 0.55 | 0 | 0 | 0.48 | 0.29 | 0 | 0.48 | 0.25 |
| Non-endemic | 0 | 0 | 0 | 0 | 0 | 0 | 0 | 0 | 0 | 0 | 0 |
| Lost to follow-up | 0 | 0 | 0 | 0.18 | 0 | 0 | 0 | 0.10 | 0.31 | 0 | 0.12 |
| Total | 0.61 | 1.40 | 7.17 | 11.08Table 3.1 Footnote ↑ | 2.19 | 2.76 | 4.40 | 6.76Table 3.1 Footnote ↑ | 3.43 | 4.40 | 6.32Table 3.1 Footnote ↑ |
|
|||||||||||
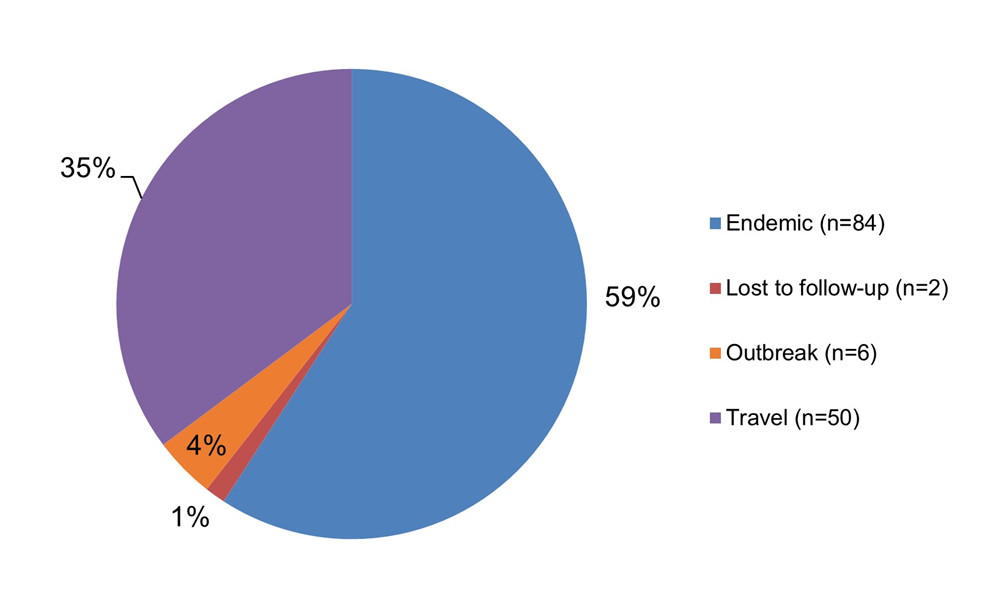
Figure 3.3: Text description
| Case classification | Number of cases | Relative proportion |
|---|---|---|
| Endemic | 84 | 59% |
| Lost to follow-up | 2 | 1% |
| Outbreak | 6 | 4% |
| Travel | 50 | 35% |
Figure 3.3 shows a pie chart of the relative proportion of shigatoxigenic Escherichia coli infections in the FoodNet Canada surveillance system by case classification (endemic, lost to follow-up, outbreak and travel) for 2019, excluding Quebec. The chart includes the case classification, the number of cases and the relative proportion.
| Ontario site | Alberta site | British Columbia site | Combined sites (ON, AB, BC)Table 3.2 Footnote a |
|||||
|---|---|---|---|---|---|---|---|---|
| 2018 | 2019 | 2018 | 2019 | 2018 | 2019 | 2018 | 2019 | |
| O157 | 100.00 | 100.00 | 35.56 | 35.38 | 25.00 | 50.00 | 36.00 | 41.56 |
| O26 | 0 | 0 | 24.44 | 26.15 | 0 | 0 | 22.00 | 22.08 |
| O103 | 0 | 0 | 13.33 | 7.69 | 0 | 0 | 12.00 | 6.49 |
| O121 | 0 | 0 | 4.44 | 6.15 | 50.00 | 0 | 8.00 | 5.19 |
| O111 | 0 | 0 | 6.67 | 4.62 | 0 | 0 | 6.00 | 3.90 |
| O145 | 0 | 0 | 6.67 | 3.08 | 0 | 0 | 6.00 | 2.60 |
| O45 | 0 | 0 | 0 | 0 | 0 | 0 | 0 | 0 |
| Other | 0 | 0 | 8.89 | 16.92 | 25.00 | 50.00 | 10.00 | 18.18 |
|
||||||||

Figure 3.4: Text description
| Age category | Female | Male | Overall total (all genders combined) |
|---|---|---|---|
| 0-4 | 22.36 | 16.22 | 19.20 |
| 5-9 | 6.72 | 4.70 | 5.67 |
| 10-14 | 1.71 | 6.46 | 4.15 |
| 15-19 | 8.72 | 6.60 | 7.63 |
| 20-24 | 1.51 | 2.79 | 2.18 |
| 25-29 | 6.66 | 1.29 | 3.93 |
| 30-39 | 1.85 | 1.86 | 1.85 |
| 40-59 | 2.54 | 2.15 | 2.34 |
| 60+ | 2.93 | 2.36 | 2.67 |
| Overall total (all ages combined) | 4.38 | 3.62 | 4.00 |
Figure 3.4 shows a bar chart of the annual incidence rate of endemic shigatoxigenic Escherichia coli per 100,000 population by overall total age category and by each age category and gender for 2019, excluding Quebec. The y-axis (vertical) presents the incidence rate per 100,000 population and the x-axis (horizontal) presents the age categories. The bars represent the total incidence for all genders by age group as well as the total incidence of male and female separately by age category.
| Most commonly reported symptoms: | 2018 | 2019 |
|---|---|---|
| Diarrhea | 92% | 96% |
| Abdominal pain | 85% | 83% |
| Fatigue or weakness | 68% | 75% |
| Anorexia | 64% | 75% |
| Nausea | 51% | 62% |
| Indicators of severity: | 2018 | 2019 |
| Bloody diarrhea | 58% | 54% |
| Emergency room visits | 68% | 63% |
| Hospitalizations | 14% | 10% |
| Antimicrobial prescriptions | 12% | 19% |
Food, animal and environmental surveillance summary
| Sample type | Ontario site | Alberta site | British Columbia site | Combined sites (ON, AB, BC)Table 3.4 Footnote a |
Quebec siteTable 3.4 Footnote b | All sitesTable 3.4 Footnote c | |
|---|---|---|---|---|---|---|---|
| Ground beef | 4.69% (6/128) |
1.63% (2/123) |
3.03% (4/132) |
3.13% (12/383) |
0.00% (0/45) |
2.80% (12/428) |
|
| Pork sausage | 10.00% (14/140) |
2.99% (4/134) |
1.53% (2/131) |
4.94% (20/405) |
2.22% (1/45) |
4.67% (21/450) |
|
| Feedlot beef manure | Sample-level | NT | 11.98% (29/242) |
NT | n/a | NT | n/a |
| Farm-level | NT | 63.33% (19/30) |
NT | n/a | NT | n/a | |
| Irrigation water | NT | 44.64% (25/56) |
18.10% (19/105)Table 3.4 Footnote ↑ |
27.33% (44/161) | NT | n/a | |
| Surface water | 26.67% (8/30) |
NT | NT | n/a | NT | n/a | |
NT: Not tested. |
|||||||

Figure 3.5: Text description
| Site | 2015 | 2016 | 2017 | 2018 | 2019 |
|---|---|---|---|---|---|
| Ontario | 2.33% | 1.52% | 3.79% | 3.97% | 4.69% |
| Alberta | 3.10% | 0.00% | 3.31% | 2.31% | 1.63% |
| British Columbia | 1.55% | 2.27% | 0.78% | 0.78% | 3.03% |
| Combined sites | 2.33% | 1.26% | 2.62% | 2.34% | 3.13% |
Figure 3.5 shows a line graph with four lines depicting the proportion of retail ground beef samples positive for shigatoxigenic Escherichia coli (y-axis, vertical) by sampling year (x-axis, horizontal) for each of the individual sentinel sites (Ontario, Alberta and British Columbia) and for all three sentinel sites combined (referred to as 'Combined sites'), from 2015 to 2019. Different styles of lines have been used to describe the proportions for each individual site and all sites combined.

Figure 3.6: Text description
| Site | 2015 | 2016 | 2017 | 2018 | 2019 |
|---|---|---|---|---|---|
| Alberta | no data | 15.38% | 23.68% | 9.84% | 11.98% |
Figure 3.6 shows a line graph with one line depicting the proportion of farm feedlot beef manure samples positive for shigatoxigenic Escherichia coli (y-axis, vertical) by sampling year (x-axis, horizontal) for the Alberta sentinel site, from 2015 to 2019.

Figure 3.7: Text description
| Site | 2015 | 2016 | 2017 | 2018 | 2019 |
|---|---|---|---|---|---|
| Alberta | 42.42% | 46.88% | 50.00% | 50.00% | 44.64% |
| British Columbia | 23.96% | 23.64% | 26.19% | 4.44% | 18.10% |
| Combined sites | 28.68% | 28.87% | 32.76% | 23.38% | 27.33% |
Figure 3.7 shows a line graph with three lines depicting the proportion of irrigation water samples positive for shigatoxigenic Escherichia coli (y-axis, vertical) by sampling year (x-axis, horizontal) for each of the individual sentinel sites (Alberta and British Columbia) and for both sentinel sites combined (referred to as 'Combined sites'), from 2015 to 2019. Different styles of lines have been used to describe the proportions for each individual site and all sites combined.
Listeria monocytogenes
Human surveillance summary
| Ontario site | Alberta site | British Columbia site | Combined sites (ON, AB, BC)Table 4.1 Footnote a |
Quebec siteTable 4.1 Footnote b | All sitesTable 4.1 Footnote c | ||||||
|---|---|---|---|---|---|---|---|---|---|---|---|
| 2018 | 2019 | 2018 | 2019 | 2018 | 2019 | 2018 | 2019 | 2019 | 2018 | 2019 | |
| Endemic | 0.20 | 0.60 | 0.37 | 0.09 | 0 | 0.20 | 0.24 | 0.24 | 1.56 | 0.24 | 0.41 |
| Travel | 0 | 0 | 0 | 0 | 0 | 0 | 0 | 0 | 0 | 0 | 0 |
| Outbreak | 0 | 0 | 0 | 0 | 0 | 0 | 0 | 0 | 0 | 0 | 0 |
| Non-endemic | 0 | 0 | 0 | 0 | 0 | 0 | 0 | 0 | 0 | 0 | 0 |
| Lost to follow-up | 0 | 0 | 0.09 | 0 | 0 | 0.20 | 0.05 | 0.05 | 0 | 0.05 | 0.04 |
| Total | 0.20 | 0.60 | 0.47 | 0.09 | 0 | 0.39 | 0.29 | 0.29 | 1.56 | 0.29 | 0.45 |
|
|||||||||||
Food, animal and environmental surveillance summary
| Sample type | Ontario site | Alberta site | British Columbia site | Combined sites (ON, AB, BC)Table 4.2 Footnote a |
Quebec siteTable 4.2 Footnote b | All sitesTable 4.2 Footnote c |
|---|---|---|---|---|---|---|
| Chicken Breast | 15.50% (20/129) |
3.82% (5/131)Table 4.2 Footnote ↓ |
15.15% (20/132)Table 4.2 Footnote ↓ |
11.48% (45/392)Table 4.2 Footnote ↓ |
10.42% (5/48) |
11.36% (50/440)Table 4.2 Footnote ↓ |
| Ground Beef | 24.22% (31/128) |
22.14% (29/131) |
34.85% (46/132) |
27.11% (106/331) |
8.33% (4/48) |
25.06% (110/439) |
| Frozen breaded chicken productsTable 4.2 Footnote d | 10.26% (12/117)Table 4.2 Footnote ↓ |
6.90% (8/116)Table 4.2 Footnote ↓ |
18.94% (25/132) |
12.33% (45/365)Table 4.2 Footnote ↓ |
13.04% (6/46) |
12.41% (51/411)Table 4.2 Footnote ↓ |
| Pork Sausage | 17.86% (25/140) |
15.38% (22/143) |
18.32% (24/131) |
17.15% (71/414) |
12.50% (6/48) |
16.67% (77/462) |
|
||||||

Figure 4.1: Text description
| Site | 2015 | 2016 | 2017 | 2018 | 2019 |
|---|---|---|---|---|---|
| Ontario | 11.85% | 18.94% | 12.12% | 16.67% | 15.50% |
| Alberta | 11.36% | 13.64% | 19.05% | 12.03% | 3.82% |
| British Columbia | 17.78% | 33.33% | 26.52% | 25.76% | 15.15% |
| Combined sites | 13.68% | 21.97% | 19.23% | 18.16% | 11.48% |
Figure 4.1 shows a line graph with four lines depicting the proportion of retail chicken breast samples positive for Listeria monocytogenes (y-axis, vertical) by sampling year (x-axis, horizontal) for each of the individual sentinel sites (Ontario, Alberta and British Columbia) and for all three sentinel sites combined (referred to as 'Combined sites'), from 2015 to 2019. Different styles of lines have been used to describe the proportions for each individual site and all sites combined.
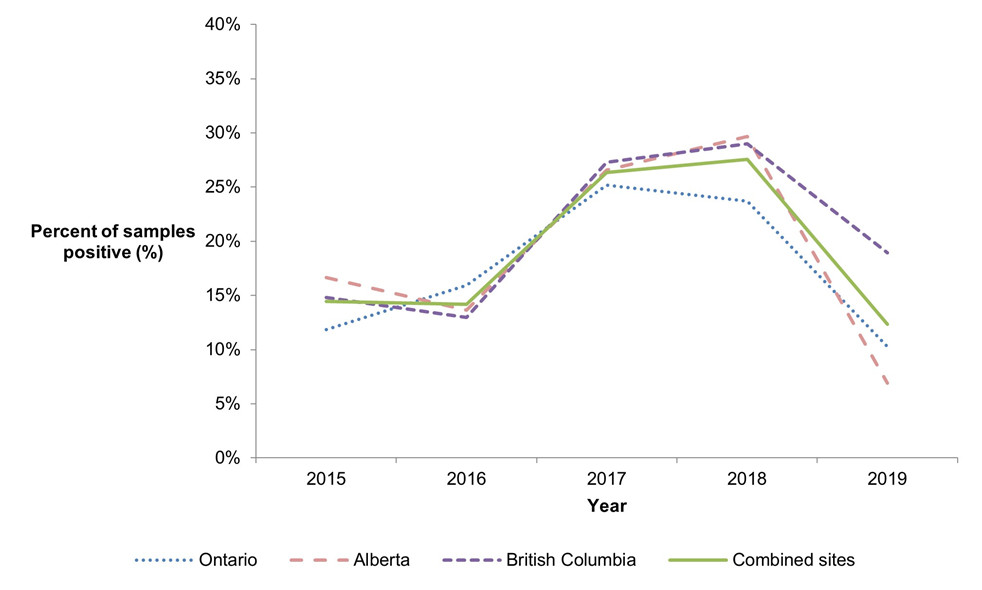
Figure 4.2: Text description
| Site | 2015 | 2016 | 2017 | 2018 | 2019 |
|---|---|---|---|---|---|
| Ontario | 11.85% | 15.91% | 25.19% | 23.68% | 10.26% |
| Alberta | 16.67% | 13.64% | 26.56% | 29.66% | 6.90% |
| British Columbia | 14.81% | 12.98% | 27.27% | 29.01% | 18.94% |
| Combined sites | 14.43% | 14.18% | 26.34% | 27.55% | 12.33% |
Figure 4.2 shows a line graph with four lines depicting the proportion of frozen breaded chicken product samples positive for Listeria monocytogenes (y-axis, vertical) by sampling year (x-axis, horizontal) for each of the individual sentinel sites (Ontario, Alberta and British Columbia) and for all three sentinel sites combined (referred to as 'Combined sites'), from 2015 to 2019. Different styles of lines have been used to describe the proportions for each individual site and all sites combined.
- Figure 4.2 Footnote *
-
FoodNet Canada began sampling cooked frozen breaded chicken products (FBCP) in 2019, in addition to uncooked FBCP.
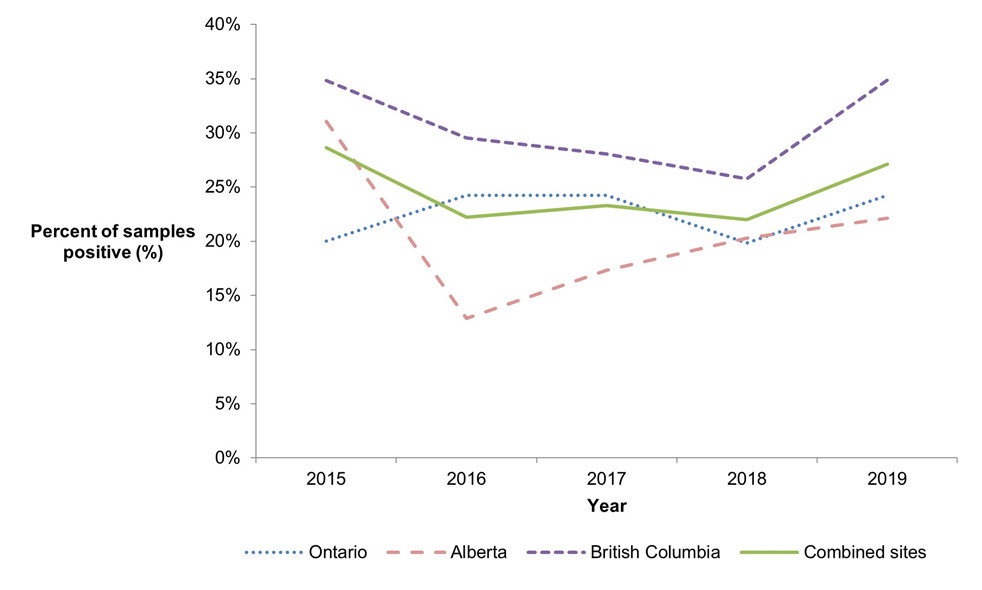
Figure 4.3: Text description
| Site | 2015 | 2016 | 2017 | 2018 | 2019 |
|---|---|---|---|---|---|
| Ontario | 20.00% | 24.24% | 24.24% | 19.84% | 24.22% |
| Alberta | 31.06% | 12.88% | 17.32% | 20.30% | 22.14% |
| British Columbia | 34.81% | 29.55% | 28.03% | 25.76% | 34.85% |
| Combined sites | 28.61% | 22.22% | 23.27% | 21.99% | 27.11% |
Figure 4.3 shows a line graph with four lines depicting the proportion of ground beef samples positive for Listeria monocytogenes (y-axis, vertical) by sampling year (x-axis, horizontal) for each of the individual sentinel sites (Ontario, Alberta and British Columbia) and for all three sentinel sites combined (referred to as 'Combined sites'), from 2015 to 2019. Different styles of lines have been used to describe the proportions for each individual site and all sites combined.
Yersinia
Human surveillance summary

Figure 5.1: Text description
| Site | 2015 | 2016 | 2017 | 2018 | 2019 |
|---|---|---|---|---|---|
| Ontario | 1.05 | 1.04 | 1.03 | 0.61 | 0.40 |
| Alberta | 1.98 | 3.02 | 1.82 | 2.23 | 1.28 |
| British Columbia | 5.74 | 13.91 | 18.53 | 13.95 | 13.79 |
| Combined sites | 2.66 | 5.17 | 5.66 | 4.69 | 4.09 |
Figure 5.1 shows a line graph with four lines depicting the annual human incidence rates of yersiniosis per 100,000 population (y-axis, vertical) by year (x-axis, horizontal) for each of the individual sentinel sites (Ontario, Alberta and British Columbia) and for all three sentinel sites combined (referred to as 'Combined sites'), from 2015 to 2019. Different styles of lines have been used to describe the incidence rates for each individual site and all sites combined.

Figure 5.2: Text description
| Site | 2015 | 2016 | 2017 | 2018 | 2019 |
|---|---|---|---|---|---|
| Ontario | 0.42 | 0.62 | 0.41 | 0.00 | 0.20 |
| Alberta | 1.29 | 1.95 | 1.25 | 1.77 | 1.01 |
| British Columbia | 4.68 | 9.34 | 14.21 | 10.16 | 11.23 |
| Combined sites | 1.89 | 3.41 | 4.17 | 3.38 | 3.28 |
Figure 5.2 shows a line graph with four lines depicting the annual human incidence rates of endemic yersiniosis per 100,000 population (y-axis, vertical) by year (x-axis, horizontal) for each of the individual sentinel sites (Ontario, Alberta and British Columbia) and for all three sentinel sites combined (referred to as 'Combined sites'), from 2015 to 2019. Different styles of lines have been used to describe the incidence rates for each individual site and all sites combined.
| Ontario site | Alberta site | British Columbia site | Combined sites (ON, AB, BC)Table 5.1 Footnote a |
Quebec siteTable 5.1 Footnote b | All sitesTable 5.1 Footnote c | ||||||
|---|---|---|---|---|---|---|---|---|---|---|---|
| 2018 | 2019 | 2018 | 2019 | 2018 | 2019 | 2018 | 2019 | 2019 | 2018 | 2019 | |
| Endemic | 0.00 | 0.20 | 1.77 | 1.01 | 10.16 | 11.23 | 3.38 | 3.28 | 1.87 | 3.38 | 3.10 |
| Travel | 0.41 | 0.20 | 0.28 | 0.18 | 2.39 | 0.99 | 0.82 | 0.38 | 0 | 0.82 | 0.33Table 5.1 Footnote ↓ |
| Outbreak | 0 | 0 | 0 | 0 | 0 | 0 | 0 | 0 | 0 | 0 | 0 |
| Non-endemic | 0 | 0 | 0 | 0 | 0 | 0 | 0 | 0 | 0 | 0 | 0 |
| Lost to follow-up | 0.20 | 0 | 0.19 | 0.09 | 1.39 | 1.58 | 0.48 | 0.43 | 0.94 | 0.48 | 0.50 |
| Total | 0.61 | 0.40 | 2.23 | 1.28 | 13.95 | 13.79 | 4.69 | 4.09 | 2.81 | 4.69 | 3.92 |
|
|||||||||||
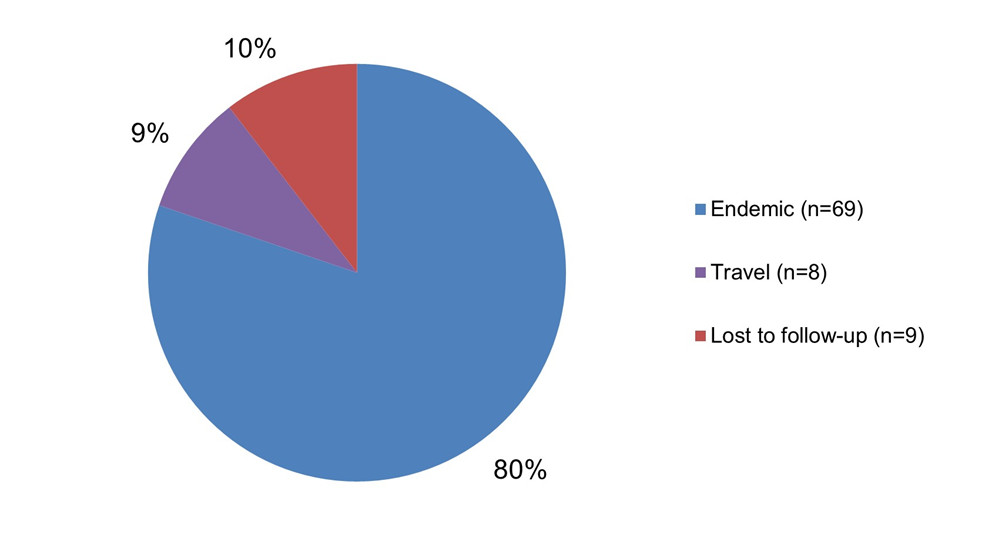
Figure 5.3: Text description
| Case classification | Number of cases | Relative proportion |
|---|---|---|
| Endemic | 69 | 80% |
| Travel | 8 | 9% |
| Lost to follow-up | 9 | 10% |
Figure 5.3 shows a pie chart of the relative proportion of Yersinia infections in the FoodNet Canada surveillance system by case classification (endemic, travel and lost to follow-up) for 2019, excluding Quebec. The chart includes the case classification, the number of cases and the relative proportion.
| Ontario site | Alberta site | British Columbia site | Combined sites (ON, AB, BC)Table 5.2 Footnote a |
|||||
|---|---|---|---|---|---|---|---|---|
| 2018 | 2019 | 2018 | 2019 | 2018 | 2019 | 2018 | 2019 | |
| Y. enterocolitica | 0 | 100.00 | 89.47 | 54.55 | 96.08 | 94.74 | 94.29 | 88.41 |
| Y. intermedia | 0 | 0 | 5.26 | 36.36 | 0 | 1.75 | 1.43 | 7.25 |
| Y. frederiksenii | 0 | 0 | 0 | 9.09 | 3.92 | 3.51 | 2.86 | 4.35 |
| Y. pseudotuberculosis | 0 | 0 | 5.26 | 0 | 0 | 0 | 1.43 | 0 |
|
||||||||
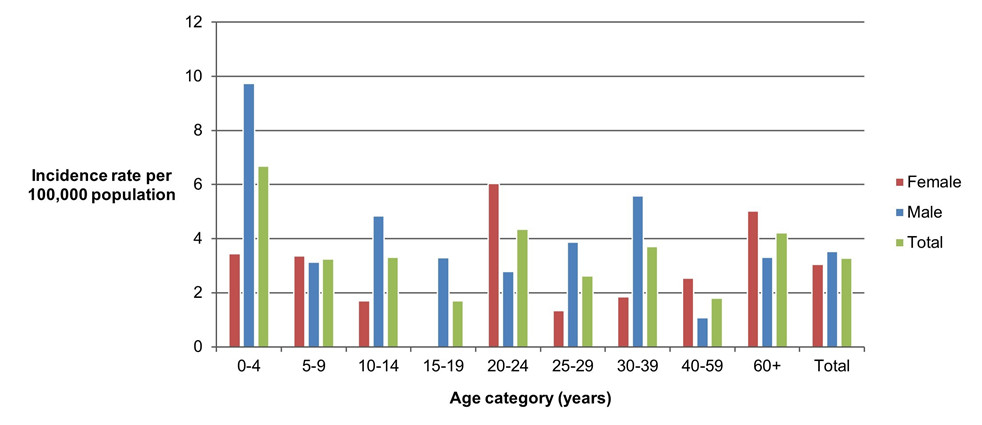
Figure 5.4: Text description
| Age category | Female | Male | Overall total (all genders combined) |
|---|---|---|---|
| 0 to 4 | 3.44 | 9.73 | 6.68 |
| 5 to 9 | 3.36 | 3.13 | 3.24 |
| 10 to 14 | 1.71 | 4.85 | 3.32 |
| 15 to 19 | 0.00 | 3.30 | 1.70 |
| 20 to 24 | 6.04 | 2.79 | 4.35 |
| 25 to 29 | 1.33 | 3.87 | 2.62 |
| 30 to 39 | 1.85 | 5.58 | 3.71 |
| 40 to 59 | 2.54 | 1.07 | 1.80 |
| 60+ | 5.03 | 3.31 | 4.22 |
| Overall total (all ages combined) | 3.04 | 3.53 | 3.29 |
Figure 5.4 shows a bar chart of the annual incidence rate of endemic Yersinia per 100,000 population by overall total age category and by each age category and gender for 2019, excluding Quebec. The y-axis (vertical) presents the incidence rate per 100,000 population and the x-axis (horizontal) presents the age categories. The bars represent the total incidence for all genders by age group as well as the total incidence of male and female separately by age category.
| Most commonly reported symptoms: | 2018 | 2019 |
|---|---|---|
| Diarrhea | 83% | 83% |
| Abdominal pain | 64% | 83% |
| Fatigue or weakness | 46% | 49% |
| Anorexia | 29% | 35% |
| Dehydration | 17% | 30% |
| Indicators of severity: | 2018 | 2019 |
| Bloody diarrhea | 19% | 7% |
| ER visits | 14% | 20% |
| Hospitalizations | 6% | 7% |
| Antimicrobial prescriptions | 33% | 29% |
Shigella
Human surveillance summary
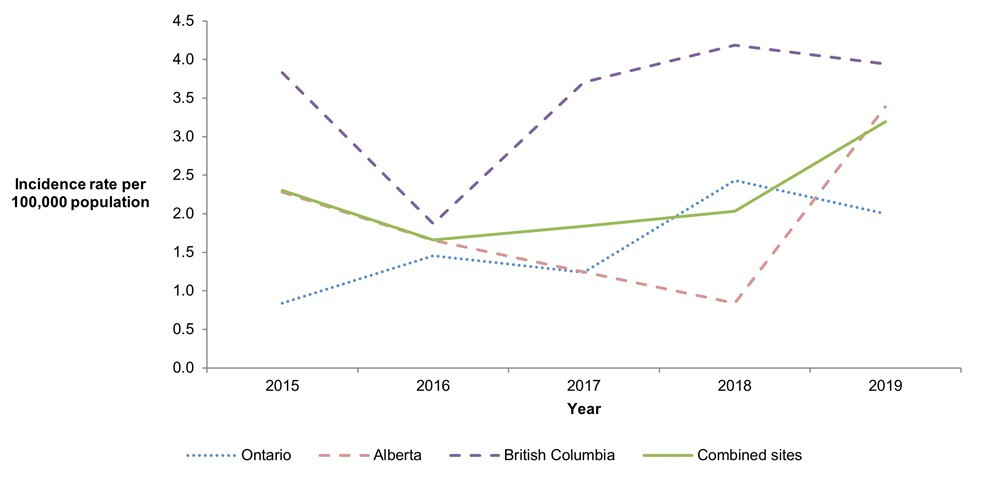
Figure 6.1: Text description
| Site | 2015 | 2016 | 2017 | 2018 | 2019 |
|---|---|---|---|---|---|
| Ontario | 0.84 | 1.45 | 1.24 | 2.43 | 2.00 |
| Alberta | 2.28 | 1.65 | 1.25 | 0.84 | 3.39 |
| British Columbia | 3.83 | 1.87 | 3.71 | 4.18 | 3.94 |
| Combined sites | 2.30 | 1.66 | 1.84 | 2.03 | 3.19 |
Figure 6.1 shows a line graph with four lines depicting the annual human incidence rates of shigellosis per 100,000 population (y-axis, vertical) by year (x-axis, horizontal) for each of the individual sentinel sites (Ontario, Alberta and British Columbia) and for all three sentinel sites combined (referred to as 'Combined sites'), from 2015 to 2019. Different styles of lines have been used to describe the incidence rates for each individual site and all sites combined.
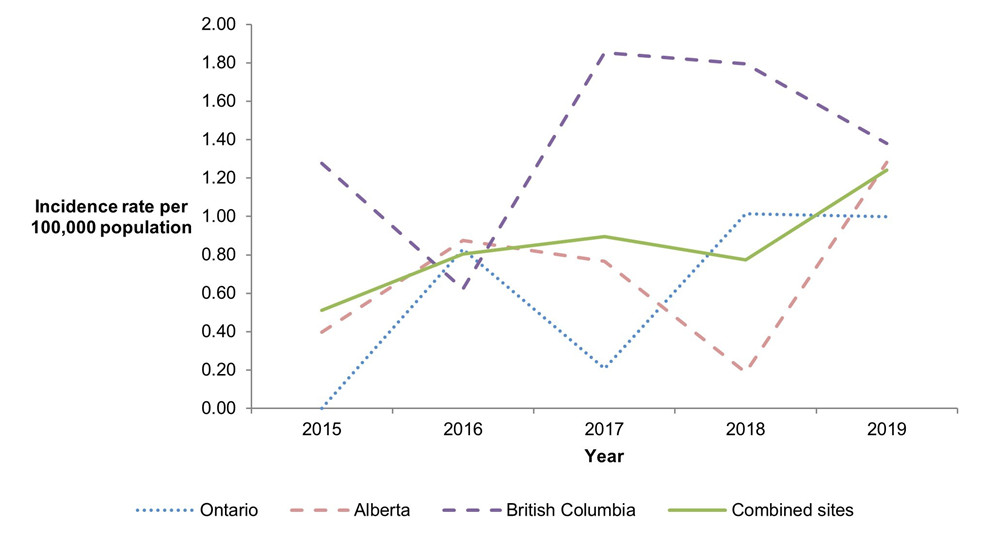
Figure 6.2: Text description
| Site | 2015 | 2016 | 2017 | 2018 | 2019 |
|---|---|---|---|---|---|
| Ontario | 0.00 | 0.83 | 0.21 | 1.01 | 1.00 |
| Alberta | 0.40 | 0.88 | 0.77 | 0.19 | 1.28 |
| British Columbia | 1.28 | 0.62 | 1.85 | 1.79 | 1.38 |
| Combined sites | 0.51 | 0.80 | 0.89 | 0.77 | 1.24 |
Figure 6.2 shows a line graph with four lines depicting the annual human incidence rates of endemic shigellosis per 100,000 population (y-axis, vertical) by year (x-axis, horizontal) for each of the individual sentinel sites (Ontario, Alberta and British Columbia) and for all three sentinel sites combined (referred to as 'Combined sites'), from 2015 to 2019. Different styles of lines have been used to describe the incidence rates for each individual site and all sites combined.
| Ontario site | Alberta site | British Columbia site | Combined sites (ON, AB, BC)Table 6.1 Footnote a |
Quebec siteTable 6.1 Footnote b | All sitesTable 6.1 Footnote c | ||||||
|---|---|---|---|---|---|---|---|---|---|---|---|
| 2018 | 2019 | 2018 | 2019 | 2018 | 2019 | 2018 | 2019 | 2019 | 2018 | 2019 | |
| Endemic | 1.01 | 1.00 | 0.19 | 1.28Table 6.1 Footnote ↑ | 1.79 | 1.38 | 0.77 | 1.24 | 1.87 | 0.77 | 1.32 |
| Travel | 1.01 | 1.00 | 0.47 | 1.83Table 6.1 Footnote ↑ | 2.19 | 1.97 | 1.01 | 1.67 | 0 | 1.01 | 1.45 |
| Outbreak | 0 | 0 | 0 | 0 | 0 | 0 | 0 | 0 | 0 | 0 | 0 |
| Non-endemic | 0 | 0 | 0 | 0.09 | 0 | 0.20 | 0 | 0.10 | 0 | 0 | 0.08 |
| Lost to follow-up | 0.41 | 0 | 0.19 | 0.18 | 0.20 | 0.39 | 0.24 | 0.19 | 0 | 0.24 | 0.17 |
| Total | 2.43 | 2.00 | 0.84 | 3.39Table 6.1 Footnote ↑ | 4.18 | 3.94 | 2.03 | 3.19Table 6.1 Footnote ↑ | 1.87 | 2.03 | 3.01Table 6.1 Footnote ↑ |
|
|||||||||||
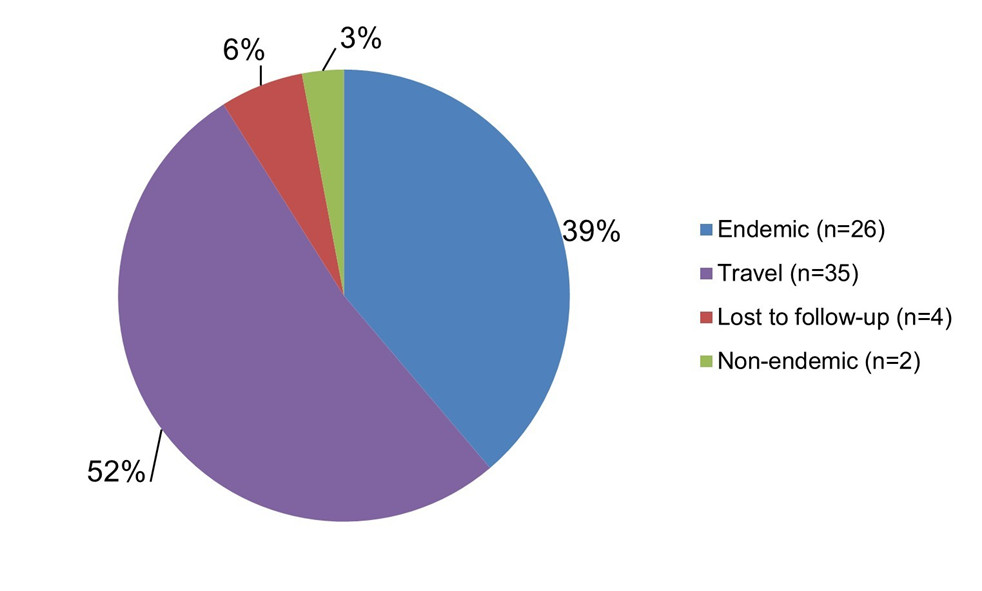
Figure 6.3: Text description
| Case classification | Number of cases | Relative proportion |
|---|---|---|
| Endemic | 26 | 39% |
| Travel | 35 | 52% |
| Lost to follow-up | 4 | 6% |
| Non-endemic | 2 | 3% |
Figure 6.3 shows a pie chart of the relative proportion of Shigella infections in the FoodNet Canada surveillance system by case classification (endemic, travel, lost to follow-up and non-endemic) for 2019, excluding Quebec. The chart includes the case classification, the number of cases and the relative proportion.
| Ontario site | Alberta site | British Columbia site | Combined sites (ON, AB, BC)Table 6.2 Footnote a |
|||||
|---|---|---|---|---|---|---|---|---|
| 2018 | 2019 | 2018 | 2019 | 2018 | 2019 | 2018 | 2019 | |
| S. sonnei | 20.00 | 60.00 | 50.00 | 64.29 | 55.56 | 57.14 | 43.75 | 61.54 |
| S. flexneri | 80.00 | 40.00 | 50.00 | 28.57 | 44.44 | 42.86 | 56.25 | 34.62 |
| S. dysenteriae | 0 | 0 | 0 | 7.14 | 0 | 0 | 0 | 3.85 |
|
||||||||
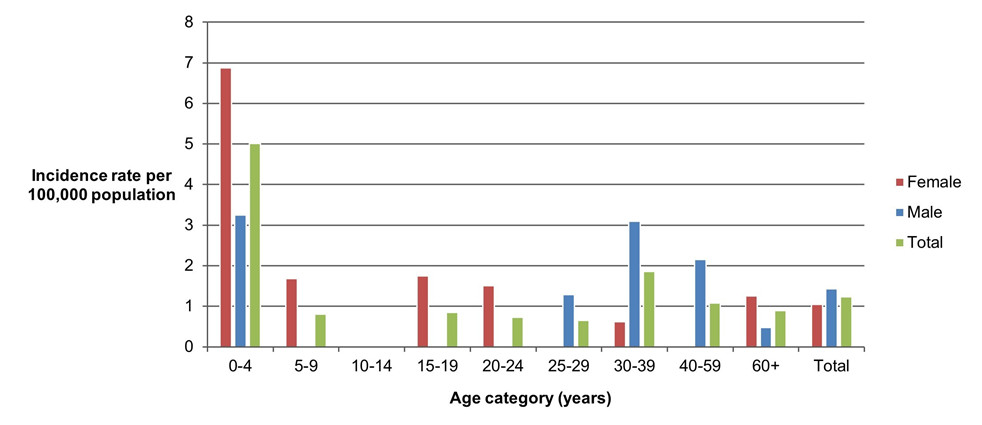
Figure 6.4: Text description
| Age category | Female | Male | Overall total (all genders combined) |
|---|---|---|---|
| 0 to 4 | 6.88 | 3.24 | 5.01 |
| 5 to 9 | 1.68 | 0.00 | 0.81 |
| 10 to 14 | 0.00 | 0.00 | 0.00 |
| 15 to 19 | 1.74 | 0.00 | 0.85 |
| 20 to 24 | 1.51 | 0.00 | 0.73 |
| 25 to 29 | 0.00 | 1.29 | 0.65 |
| 30 to 39 | 0.62 | 3.10 | 1.85 |
| 40 to 59 | 0.00 | 2.15 | 1.08 |
| 60+ | 1.26 | 0.47 | 0.89 |
| Overall total (all ages combined) | 1.05 | 1.43 | 1.24 |
Figure 6.4 shows a bar chart of the annual incidence rate of endemic Shigella per 100,000 population by overall total age category and by each age category and gender for 2019, excluding Quebec. The y-axis (vertical) presents the incidence rate per 100,000 population and the x-axis (horizontal) presents the age categories. The bars represent the total incidence for all genders by age group as well as the total incidence of male and female separately by age category.
Parasites
Giardia

Figure 7.1: Text description
| Site | 2015 | 2016 | 2017 | 2018 | 2019 |
|---|---|---|---|---|---|
| Ontario | 10.91 | 8.10 | 6.61 | 7.30 | 6.79 |
| Alberta | 10.70 | 13.23 | 10.45 | 11.82 | 13.64 |
| British Columbia | 10.21 | 10.59 | 9.26 | 9.76 | 14.38 |
| Combined sites | 10.63 | 11.35 | 9.24 | 10.25 | 12.19 |
Figure 7.1 shows a line graph with four lines depicting the annual human incidence rates of giardiasis per 100,000 population (y-axis, vertical) by year (x-axis, horizontal) for each of the individual sentinel sites (Ontario, Alberta and British Columbia) and for all three sentinel sites combined (referred to as 'Combined sites'), from 2015 to 2019. Different styles of lines have been used to describe the incidence rates for each individual site and all sites combined.
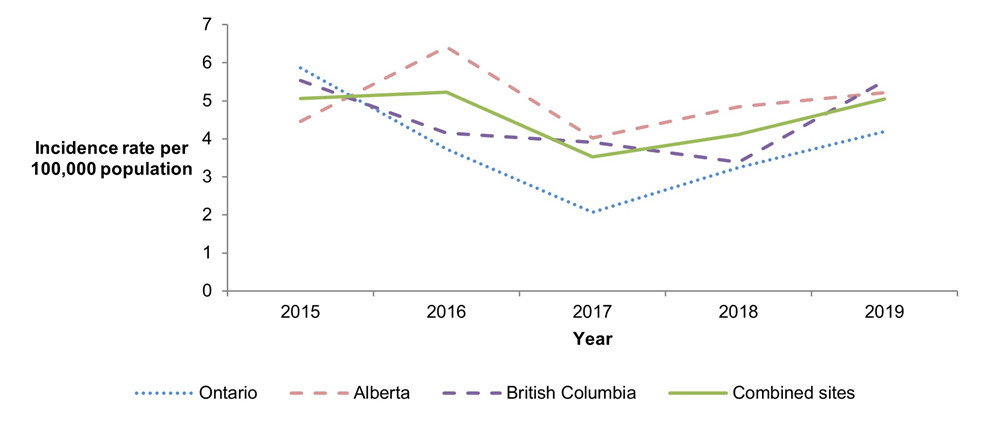
Figure 7.2: Text description
| Site | 2015 | 2016 | 2017 | 2018 | 2019 |
|---|---|---|---|---|---|
| Ontario | 5.87 | 3.74 | 2.06 | 3.24 | 4.19 |
| Alberta | 4.46 | 6.42 | 4.03 | 4.84 | 5.22 |
| British Columbia | 5.53 | 4.15 | 3.91 | 3.39 | 5.52 |
| Combined sites | 5.06 | 5.22 | 3.53 | 4.11 | 5.05 |
Figure 7.2 shows a line graph with four lines depicting the annual human incidence rates of endemic giardiasis per 100,000 population (y-axis, vertical) by year (x-axis, horizontal) for each of the individual sentinel sites (Ontario, Alberta and British Columbia) and for all three sentinel sites combined (referred to as 'Combined sites'), from 2015 to 2019. Different styles of lines have been used to describe the incidence rates for each individual site and all sites combined.
| Ontario site | Alberta site | British Columbia site | Combined sites (ON, AB, BC)Table 7.1 Footnote a |
Quebec siteTable 7.1 Footnote b | All sitesTable 7.1 Footnote c | ||||||
|---|---|---|---|---|---|---|---|---|---|---|---|
| 2018 | 2019 | 2018 | 2019 | 2018 | 2019 | 2018 | 2019 | 2019 | 2018 | 2019 | |
| Endemic | 3.24 | 4.19 | 4.84 | 5.22 | 3.39 | 5.52 | 4.11 | 5.05 | 6.23 | 4.11 | 5.20 |
| Travel | 1.62 | 1.60 | 3.91 | 4.30 | 3.19 | 3.94 | 3.19 | 3.57 | 1.25 | 3.19 | 3.26 |
| Outbreak | 0 | 0 | 0 | 0 | 0 | 0 | 0 | 0 | 0 | 0 | 0 |
| Non-Endemic | 0 | 0.40 | 2.51 | 2.75 | 1.79 | 1.77 | 1.74 | 1.95 | 4.36 | 1.74 | 2.27 |
| Lost to Follow-Up | 2.43 | 0.60Table 7.1 Footnote ↓ | 0.56 | 1.37 | 1.39 | 3.15 | 1.21 | 1.62 | 1.56 | 1.21 | 1.61 |
| Total | 7.30 | 6.79 | 11.82 | 13.64 | 9.76 | 14.38Table 7.1 Footnote ↑ | 10.25 | 12.19 | 13.40 | 10.25 | 12.35Table 7.1 Footnote ↑ |
|
|||||||||||
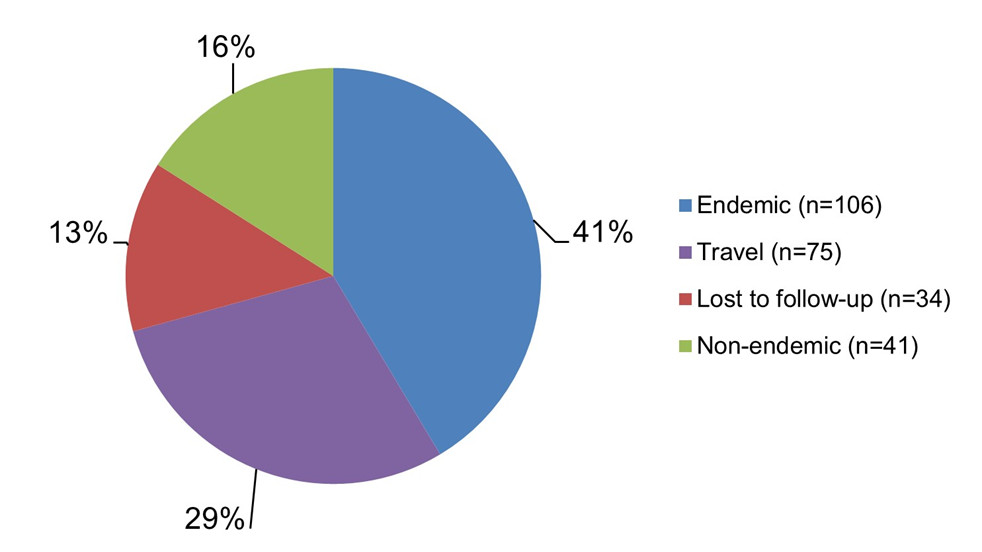
Figure 7.3: Text description
| Case classification | Number of cases | Relative proportion |
|---|---|---|
| Endemic | 106 | 41% |
| Travel | 75 | 29% |
| Lost to follow-up | 34 | 13% |
| Non-endemic | 41 | 16% |
Figure 7.3 shows a pie chart of the relative proportion of Giardia duodenalis infections in the FoodNet Canada surveillance system by case classification (endemic, travel, lost to follow-up and non-endemic) for 2019, excluding Quebec. The chart includes the case classification, the number of cases and the relative proportion.

Figure 7.4: Text description
| Age category | Female | Male | Overall total (all genders combined) |
|---|---|---|---|
| 0-4 | 6.88 | 11.35 | 9.18 |
| 5-9 | 1.68 | 6.26 | 4.05 |
| 10-14 | 1.71 | 1.62 | 1.66 |
| 15-19 | 1.74 | 8.25 | 5.09 |
| 20-24 | 6.04 | 8.37 | 7.25 |
| 25-29 | 5.33 | 2.58 | 3.93 |
| 30-39 | 5.55 | 9.29 | 7.42 |
| 40-59 | 3.63 | 5.37 | 4.51 |
| 60+ | 4.19 | 3.31 | 3.78 |
| Overall total (all ages combined) | 4.19 | 5.91 | 5.05 |
Figure 7.4 shows a bar chart of the annual incidence rate of endemic Giardia duodenalis per 100,000 population by overall total age category and by each age category and gender for 2019, excluding Quebec. The y-axis (vertical) presents the incidence rate per 100,000 population and the x-axis (horizontal) presents the age categories. The bars represent the total incidence for all genders by age group as well as the total incidence of male and female separately by age category.
| Most commonly reported symptoms: | 2018 | 2019 |
|---|---|---|
| Diarrhea | 86% | 85% |
| Abdominal pain | 69% | 71% |
| Fatigue or weakness | 62% | 60% |
| Anorexia | 56% | 56% |
| Nausea | 60% | 54% |
| Indicators of severity: | 2018 | 2019 |
| Bloody diarrhea | 11% | 10% |
| Emergency room visits | 32% | 21% |
| Hospitalizations | 5% | 3% |
| Antimicrobial prescriptions | 71% | 51% |
Cryptosporidium
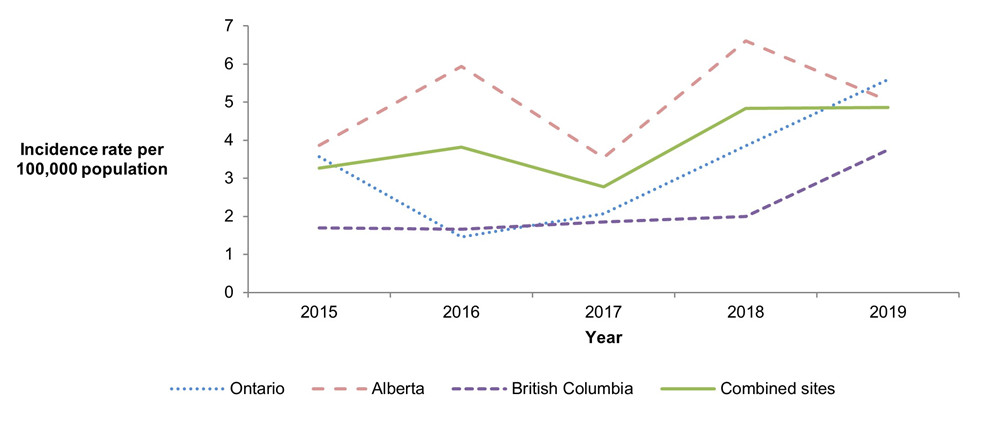
Figure 8.1: Text description
| Site | 2015 | 2016 | 2017 | 2018 | 2019 |
|---|---|---|---|---|---|
| Ontario | 3.57 | 1.45 | 2.06 | 3.85 | 5.59 |
| Alberta | 3.86 | 5.93 | 3.55 | 6.61 | 5.04 |
| British Columbia | 1.70 | 1.66 | 1.85 | 1.99 | 3.74 |
| Combined sites | 3.27 | 3.82 | 2.78 | 4.83 | 4.86 |
Figure 8.1 shows a line graph with four lines depicting the annual human incidence rates of cryptosporidiosis per 100,000 population (y-axis, vertical) by year (x-axis, horizontal) for each of the individual sentinel sites (Ontario, Alberta and British Columbia) and for all three sentinel sites combined (referred to as 'Combined sites'), from 2015 to 2019. Different styles of lines have been used to describe the incidence rates for each individual site and all sites combined.
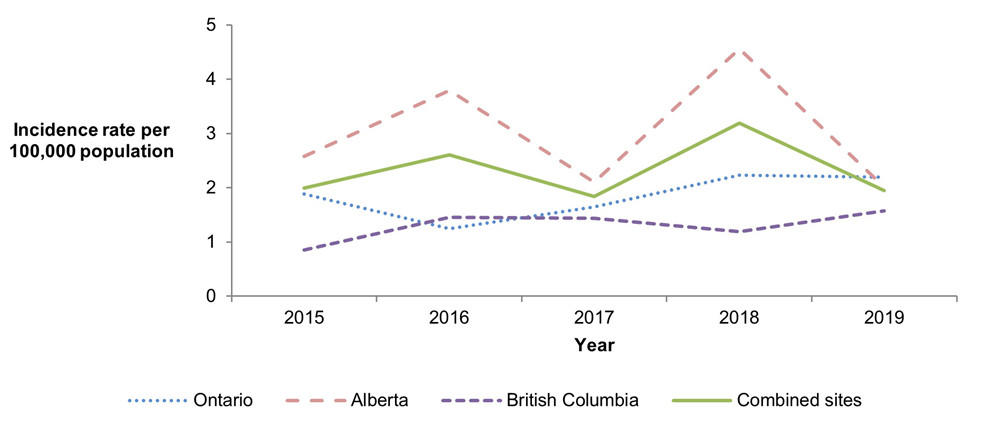
Figure 8.2: Text description
| Site | 2015 | 2016 | 2017 | 2018 | 2019 |
|---|---|---|---|---|---|
| Ontario | 1.89 | 1.25 | 1.65 | 2.23 | 2.20 |
| Alberta | 2.58 | 3.79 | 2.11 | 4.56 | 2.01 |
| British Columbia | 0.85 | 1.45 | 1.44 | 1.20 | 1.58 |
| Combined sites | 1.99 | 2.61 | 1.84 | 3.19 | 1.95 |
Figure 8.2 shows a line graph with four lines depicting the annual human incidence rates of endemic cryptosporidiosis per 100,000 population (y-axis, vertical) by year (x-axis, horizontal) for each of the individual sentinel sites (Ontario, Alberta and British Columbia) and for all three sentinel sites combined (referred to as 'Combined sites'), from 2015 to 2019. Different styles of lines have been used to describe the incidence rates for each individual site and all sites combined.
| Ontario site | Alberta site | British Columbia site | Combined sites (ON, AB, BC)Table 8.1 Footnote a |
Quebec siteTable 8.1 Footnote b | All sitesTable 8.1 Footnote c | ||||||
|---|---|---|---|---|---|---|---|---|---|---|---|
| 2018 | 2019 | 2018 | 2019 | 2018 | 2019 | 2018 | 2019 | 2019 | 2018 | 2019 | |
| Endemic | 2.23 | 2.20 | 4.56 | 2.01Table 8.1 Footnote ↓ | 1.20 | 1.58 | 3.19 | 1.95Table 8.1 Footnote ↓ | 2.18 | 3.19 | 1.98Table 8.1 Footnote ↓ |
| Travel | 0.20 | 2.00Table 8.1 Footnote ↑ | 1.30 | 2.84 | 0.80 | 1.77Table 8.1 Footnote ↑ | 0.92 | 2.38Table 8.1 Footnote ↑ | 0.62 | 0.92 | 2.15Table 8.1 Footnote ↑ |
| Outbreak | 0 | 0 | 0 | 0 | 0 | 0.20 | 0 | 0.05 | 0 | 0 | 0.04 |
| Non-endemic | 0 | 0 | 0 | 0.09 | 0 | 0 | 0 | 0.05 | 0.31 | 0 | 0.08 |
| Lost to follow-up | 1.42 | 1.40 | 0.74 | 0.09Table 8.1 Footnote ↓ | 0 | 0.20 | 0.72 | 0.43 | 0.62 | 0.72 | 0.45 |
| Total | 3.85 | 5.59 | 6.61 | 5.04 | 1.99 | 3.74 | 4.83 | 4.86 | 3.74 | 4.83 | 4.71 |
|
|||||||||||

Figure 8.3: Text description
| Case classification | Number of cases | Relative proportion |
|---|---|---|
| Endemic | 41 | 40% |
| Travel | 50 | 49% |
| Outbreak | 1 | 1% |
| Non-endemic | 1 | 1% |
| Lost to follow-up | 9 | 9% |
Figure 8.3 shows a pie chart of the relative proportion of Cryptosporidium spp. infections in the FoodNet Canada surveillance system by case classification (endemic, travel, outbreak, non-endemic and lost to follow-up) for 2019, excluding Quebec. The chart includes the case classification, the number of cases and the relative proportion.
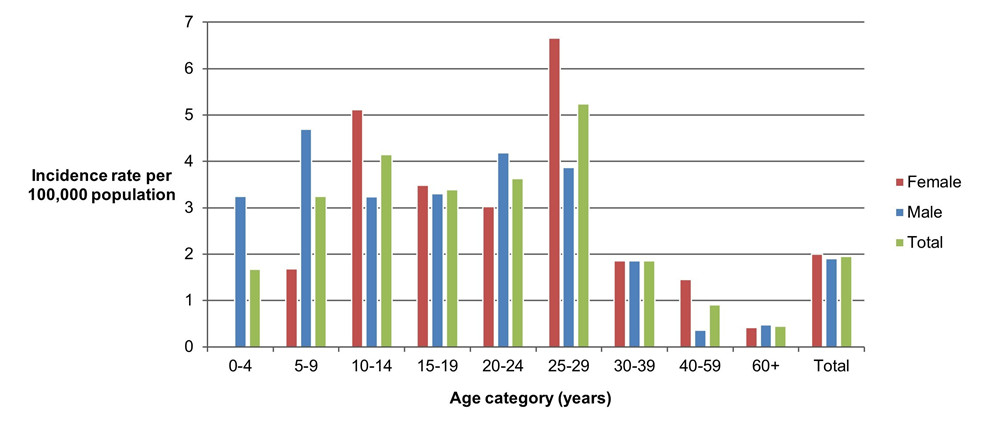
Figure 8.4: Text description
| Age category | Female | Male | Overall total (all genders combined) |
|---|---|---|---|
| 0-4 | 0.00 | 3.24 | 1.67 |
| 5-9 | 1.68 | 4.70 | 3.24 |
| 10-14 | 5.12 | 3.23 | 4.15 |
| 15-19 | 3.49 | 3.30 | 3.39 |
| 20-24 | 3.02 | 4.18 | 3.63 |
| 25-29 | 6.66 | 3.87 | 5.24 |
| 30-39 | 1.85 | 1.86 | 1.85 |
| 40-59 | 1.45 | 0.36 | 0.90 |
| 60+ | 0.42 | 0.47 | 0.44 |
| Overall total (all ages combined) | 2.00 | 1.91 | 1.95 |
Figure 8.4 shows a bar chart of the annual incidence rate of endemic Cryptosporidium spp. per 100,000 population by overall total age category and by each age category and gender for 2019, excluding Quebec. The y-axis (vertical) presents the incidence rate per 100,000 population and the x-axis (horizontal) presents the age categories. The bars represent the total incidence for all genders by age group as well as the total incidence of male and female separately by age category.
| Most commonly reported symptoms: | 2018 | 2019 |
|---|---|---|
| Diarrhea | 100% | 100% |
| Abdominal pain | 80% | 78% |
| Fatigue or weakness | 76% | 66% |
| Nausea | 71% | 63% |
| Anorexia | 74% | 56% |
| Indicators of severity: | 2018 | 2019 |
| Bloody diarrhea | 5% | 7% |
| ER visits | 53% | 41% |
| Hospitalizations | 3% | 5% |
| Antimicrobial prescriptions | 29% | 29% |
Cyclospora

Figure 9.1: Text description
| Site | 2015 | 2016 | 2017 | 2018 | 2019 |
|---|---|---|---|---|---|
| Ontario | 1.68 | 1.45 | 0.83 | 1.82 | 1.00 |
| Alberta | 0.20 | 0.29 | 0.10 | 0.19 | 0.00 |
| British Columbia | 1.28 | 1.66 | 1.65 | 0.40 | 0.20 |
| Combined sites | 0.82 | 0.90 | 0.65 | 0.63 | 0.29 |
Figure 9.1 shows a line graph with four lines depicting the annual human incidence rates of cyclosporiasis per 100,000 population (y-axis, vertical) by year (x-axis, horizontal) for each of the individual sentinel sites (Ontario, Alberta and British Columbia) and for all three sentinel sites combined (referred to as 'Combined sites'), from 2015 to 2019. Different styles of lines have been used to describe the incidence rates for each individual site and all sites combined.

Figure 9.2: Text description
| Site | 2015 | 2016 | 2017 | 2018 | 2019 |
|---|---|---|---|---|---|
| Ontario | 0.21 | 0.21 | 0.83 | 0.00 | 0.00 |
| Alberta | 0.00 | 0.00 | 0.00 | 0.09 | 0.00 |
| British Columbia | 0.00 | 0.21 | 0.00 | 0.00 | 0.00 |
| Combined sites | 0.05 | 0.10 | 0.20 | 0.05 | 0.00 |
Figure 9.2 shows a line graph with four lines depicting the annual human incidence rates of endemic cyclosporiasis per 100,000 population (y-axis, vertical) by year (x-axis, horizontal) for each of the individual sentinel sites (Ontario, Alberta and British Columbia) and for all three sentinel sites combined (referred to as 'Combined sites'), from 2015 to 2019. Different styles of lines have been used to describe the incidence rates for each individual site and all sites combined.
| Ontario site | Alberta site | British Columbia site | Combined sites (ON, AB, BC)Table 9.1 Footnote a |
Quebec siteTable 9.1 Footnote b | All sitesTable 9.1 Footnote c | ||||||
|---|---|---|---|---|---|---|---|---|---|---|---|
| 2018 | 2019 | 2018 | 2019 | 2018 | 2019 | 2018 | 2019 | 2019 | 2018 | 2019 | |
| Endemic | 0 | 0 | 0.09 | 0 | 0 | 0 | 0.05 | 0 | 0 | 0.05 | 0 |
| Travel | 1.42 | 0.20Table 9.1 Footnote ↓ | 0.09 | 0 | 0.20 | 0.20 | 0.43 | 0.10Table 9.1 Footnote ↓ | 0 | 0.43 | 0.08Table 9.1 Footnote ↓ |
| Outbreak | 0 | 0.80 | 0 | 0 | 0.20 | 0 | 0.05 | 0.19 | 0 | 0.05 | 0.17 |
| Non-Endemic | 0 | 0 | 0 | 0 | 0 | 0 | 0 | 0 | 0 | 0 | 0 |
| Lost to Follow-Up | 0.41 | 0 | 0 | 0 | 0 | 0 | 0.10 | 0 | 0 | 0.10 | 0 |
| Total | 1.82 | 1.00 | 0.19 | 0 | 0.40 | 0.20 | 0.63 | 0.29 | 0 | 0.63 | 0.25 |
|
|||||||||||
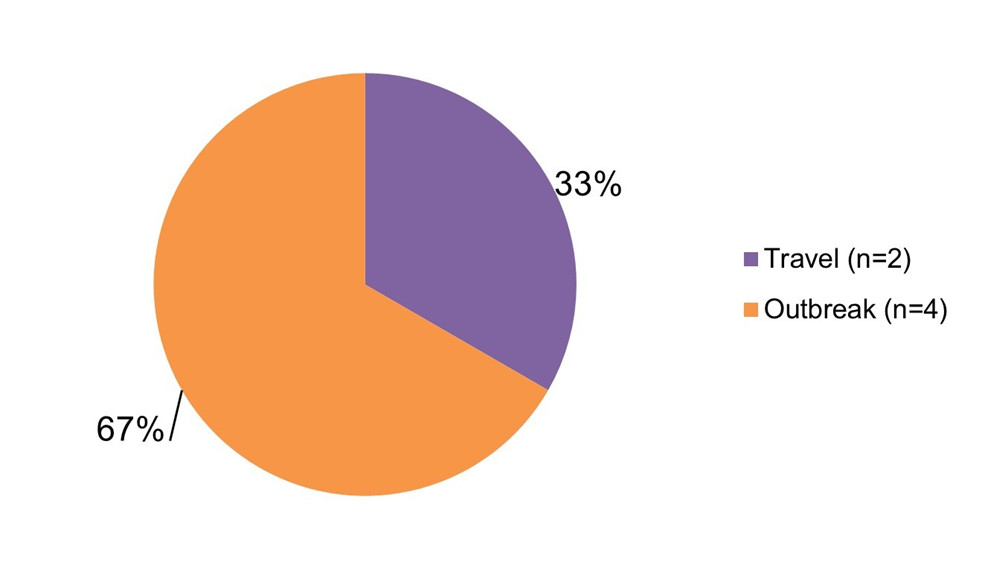
Figure 9.3: Text description
| Case classification | Number of cases | Relative proportion |
|---|---|---|
| Travel | 2 | 33% |
| Outbreak | 4 | 67% |
Figure 9.3 shows a pie chart of the relative proportion of Cyclospora cayetanensis infections in the FoodNet Canada surveillance system by case classification (travel and outbreak) for 2019, excluding Quebec. The chart includes the case classification, the number of cases and the relative proportion.
Targeted study: Raw bivalve molluscs at retail
| Sample type | Bacteria | Parasites | Viruses | ||||||
|---|---|---|---|---|---|---|---|---|---|
| Generic E. coli |
Listeria | Salmonella | Vibrio | Giardia | Toxoplasma | Cryptosporidium | Norovirus | Hepatitis A | |
| Mussels | 14.66% (17/116) |
3.97% (5/126) |
0% (0/116) |
53.91% (69/128) |
1.56% (2/128) |
0% (0/128) |
6.25% (8/128) |
0.78% (1/128) |
0% (0/128) |
| Oysters | 22.95% (14/61) |
1.61% (1/62) |
0% (0/61) |
70.15% (47/67) |
2.99% (2/67) |
0% (0/67) |
10.45% (7/67) |
0% (0/67) |
0% (0/67) |
| Sample type | Vibrio spp. (Number of isolates)Table 10.2 Footnote * | Number of virulence genes present | |||||
|---|---|---|---|---|---|---|---|
| clg+ | ctx+ | tdh+ | tlh+ | trh+ | Vvha+ | ||
| Mussels | V. alginolyticus (n=66) | 58 | n/a | n/a | 38 | n/a | n/a |
| V. cholera (n=2) | n/a | 1 | n/a | n/a | n/a | n/a | |
| V. parahaemolyticus (n=22) | n/a | n/a | 1 | 22 | n/a | n/a | |
| V. vulnificus (n=2) | n/a | n/a | n/a | n/a | n/a | 1 | |
| Oysters | V. alginolyticus (n=39) | 32 | n/a | n/a | 29 | n/a | n/a |
| V. cholera (n=7) | n/a | 1 | n/a | n/a | n/a | n/a | |
| V. fluvialis (n=1)Table 10.2 Footnote ** | n/a | n/a | n/a | n/a | n/a | n/a | |
| V. parahaemolyticus (n=18) | n/a | n/a | n/a | 16 | n/a | n/a | |
|
|||||||
| Sample type | Bacteria | Parasites | Viruses | ||||||
|---|---|---|---|---|---|---|---|---|---|
| Generic E. coli |
Listeria | Salmonella | Vibrio | Giardia | Toxoplasma | Cryptosporidium | Norovirus | Hepatitis A | |
| Mussels | 19.57% (46/235) |
4.10% (10/244) |
0% (0/235) |
53.01% (132/249) |
2.43% (6/247) |
1.61% (4/249) |
5.26% (13/247) |
0.40% (1/253) |
0% (0/253) |
| Oysters | 27.05% (33/122) |
1.50% (2/113) |
0.82% (1/122) |
75.00% (96/128) |
4.00% (5/125) |
0% (0/128) |
7.20% (9/125) |
0% (0/130) |
0% (0/130) |
| Year | Sample type | Bacteria | Parasites | Viruses | ||||||
|---|---|---|---|---|---|---|---|---|---|---|
| Generic E. coli |
Listeria | Salmonella | Vibrio | Giardia | Toxoplasma | Cryptosporidium | Norovirus | Hepatitis A | ||
| 2018 | Mussels | 24.37% (29/119) |
4.24% (5/118) |
0% (0/119) |
52.07% (63/121) |
3.36% (4/119) |
3.31% (4/121) |
4.20% (5/119) |
0% (0/125) |
0% (0/125) |
| Oysters | 31.15% (19/61) |
1.96% (1/51) |
1.64% (1/61) |
80.33% (49/61) |
5.17% (3/58) |
0% (0/61) |
3.45% (2/58) |
0% (0/63) |
0% (0/63) |
|
| 2019 | Mussels | 14.66% (17/116) |
3.97% (5/126) |
0% (0/116) |
53.91% (69/128) |
1.56% (2/128) |
0% (0/128) |
6.25% (8/128) |
0.78% (1/128) |
0% (0/128) |
| Oysters | 22.95% (14/61) |
1.61% (1/62) |
0% (0/61) |
70.15% (47/67) |
2.99% (2/67) |
0% (0/67) |
10.45% (7/67) |
0% (0/67) |
0% (0/67) |
|
Appendix A: Data collection and reporting and surveillance strategy
Data collection and reporting
Each FoodNet Canada sentinel site relies on a unique partnership with the local public health authority, private laboratories, water and agri-food sectors as well as the provincial and federal institutions responsible for public health, food safety, and water safety. The sites include Ontario (Middlesex-London Health Unit), British Columbia (Fraser Health), Alberta (Alberta Health Services: Calgary and Central Zones) and Quebec (La région sociosanitaire de la Montérégie). The Ontario (ON) site data collection began in August of 2014; data from the ON pilot sentinel site (Region of Waterloo) (2005–March 2014) were not included in this report. The British Columbia (BC) site was officially established in April 2010 and includes the communities of Burnaby, Abbotsford, and Chilliwack. The province of Alberta (AB) contains the third site and data collection began in June of 2014. The fourth site was established in Quebec (QC) in July 2019. See Appendix B for boundary maps.
Results are reported for the ON, AB and BC sites, unless otherwise stated, and some preliminary results are included for the QC site. Readers should be cautious when extrapolating these results to areas beyond the sentinel communities. As additional sentinel sites are established, comprehensive information from laboratory and epidemiological analyses from all sites will provide more representative national trends in enteric disease incidence and exposure sources to inform accurate estimates for all of Canada.
In 2019, the farm and retail components were active across all sentinel sites in ON, AB, BC, and QC whereas the water component was active in ON, AB and BC. The non-human surveillance data collected by FoodNet Canada represents possible exposure sources for human enteric illnesses within each sentinel site. The data are meant to be interpreted aggregately and cannot to be used to directly attribute a specific human case reported to FoodNet Canada to a positive isolate obtained from an exposure source. In this report, the non-human and human data are integrated using descriptive methods. The term "significant" is reserved in this report for describing trends that are statistically significant.
FoodNet Canada retail and farm sampling is integrated with CIPARS. This has included the streamlining and sharing of sampling and sampling sites, retrospective and prospective testing of antimicrobial resistance in selected bacteria isolated from FoodNet Canada samples, and improving data management mechanisms to maximize data linkages. CIPARS monitors trends and the relationship between antimicrobial use and antimicrobial resistance in selected bacterial organisms from human, animal, and food sources across Canada to inform evidence-based policy decision making to contain the emergence and spread of resistant bacteria. For further information about CIPARS, please refer to the program's website.
Surveillance strategy
Human surveillance
Public health professionals in each site use FoodNet Canada's enhanced standardized questionnaire to interview reported enteric disease cases (or proxy respondents). Information on potential exposures collected from the questionnaires is used to determine case classification (e.g. travel, endemic) and compare exposures between cases. In addition, advanced subtyping analyses on isolates from case specimens are conducted for further integration with non-human source information.
Retail surveillance
The retail stage of food production represents the point closest to consumers through which they can be exposed to enteric pathogens. Retail meats, meat products are collected from a variety of large and small food retail outlets on a routine basis throughout the year within each site. FoodNet Canada collects samples of raw fresh (chilled) skinless chicken breasts and ground beef on a weekly basis. Each year, FoodNet Canada and its partners assess knowledge gaps and from this process, select targeted retail products to sample for a given year (see Appendix C for 2019 details). In past years, targeted meats have included but were not limited to pork chops, ground chicken and turkey, veal and uncooked frozen breaded chicken products, such as nuggets and strips. In 2019, FoodNet Canada opted to continue the targeted investigation of uncooked frozen breaded chicken products that began in 2011 as well as incorporating cooked frozen breaded chicken products, fresh pork sausage and fresh bivalve molluscs (oysters and mussels). In 2019, FoodNet Canada also continued a targeted study collecting retail meat samples (chicken breast, ground beef and pork sausage) from farmers' markets in the AB and ON sentinel sites. Samples were collected once per month from May–August, replacing grocery store samples during those weeks. Microbiological testing continued in 2019 as in previous years with Campylobacter and Salmonella being tested for among all chicken products, Salmonella tested in pork sausage, Listeria spp. tested for in all retail meat products, and shigatoxigenic Escherichia coli (STEC) tested for in ground beef and pork sausage samples. Raw bivalve molluscs were tested for the presence of Escherichia coli, Listeria monocytogenes, Salmonella, Vibrio, Giardia duodenalis, Toxoplasma gondii, Cryptosporidium spp., Hepatitis A, and Norovirus.
Beginning in January 2018, a two-year targeted study was undertaken to describe the contamination of pathogens in raw, bivalve molluscs. In consultation with internal and external stakeholders, data from outbreak, surveillance, consumption, and research were used to define the study parameters. Raw shelled oysters and mussels were collected using the FoodNet Canada retail component sampling platform in all three sentinel sites (British Columbia, Alberta and Ontario). Sampling structure included large chain stores, and small independent stores and within the 2019 sampling schedule. Laboratory diagnostics for bacteria, viruses and parasites was conducted at FoodNet Canada-associated laboratories using culture-based methods for bacteria, PCR-based detection methods for viruses and PCR-based and microscopy methods for parasites. Enumeration of bacterial load was not conducted. Vibrio virulence genes associated with disease-causing properties were tested for using PCR methods in all Vibrio isolates. For the two-year study period, the results have been combined for the three sites.
On-farm surveillance
The presence of enteric pathogens on farms is a potential source of environmental exposure of enteric pathogens, and also represents an important source in the farm-to-fork transmission chain. In 2019, the farm component was active across all four sentinel sites, although commodities varied by site (Appendix C). Manure samples were collected from beef cattle, swine, broiler chicken, and turkey farms in order to estimate the pathogen levels on farms. Approximately 30 farms of each type of participating farm commodities are targeted in each site; however, the number of farms and sampling location is based on the representativeness of each commodity in a particular region. A short management survey, and up to ten manure samples (usually fresh pooled samples) were obtained at each farm visit. All samples were tested for Campylobacter and Salmonella with the beef samples additionally being tested for E. coli O157 and STEC. Throughout the report, farm results are reported at both the sample-level and farm-level to account for clustering within farms. Sample-level results include all manure samples collected on each farm, while farm-level results are based on a threshold of one positive manure sample per farm to report a farm as positive.
Water surveillance
Water is another environmental source of enteric pathogens collected in the FoodNet Canada surveillance program. In 2019, irrigation water was sampled in both the BC and AB sentinel sites, and surface water was sampled in the ON sentinel site. Samples from BC were tested for Campylobacter, Salmonella, and STEC, while samples from ON and AB were tested for STEC only (Appendix C). Sampling in BC occurred bi-weekly from January to April, bi-weekly in ON from May to September, and monthly in AB from May to September.
Appendix B: FoodNet Canada sentinel site boundaries
Sentinel site 1: Ontario (Middlesex-London Health Unit)
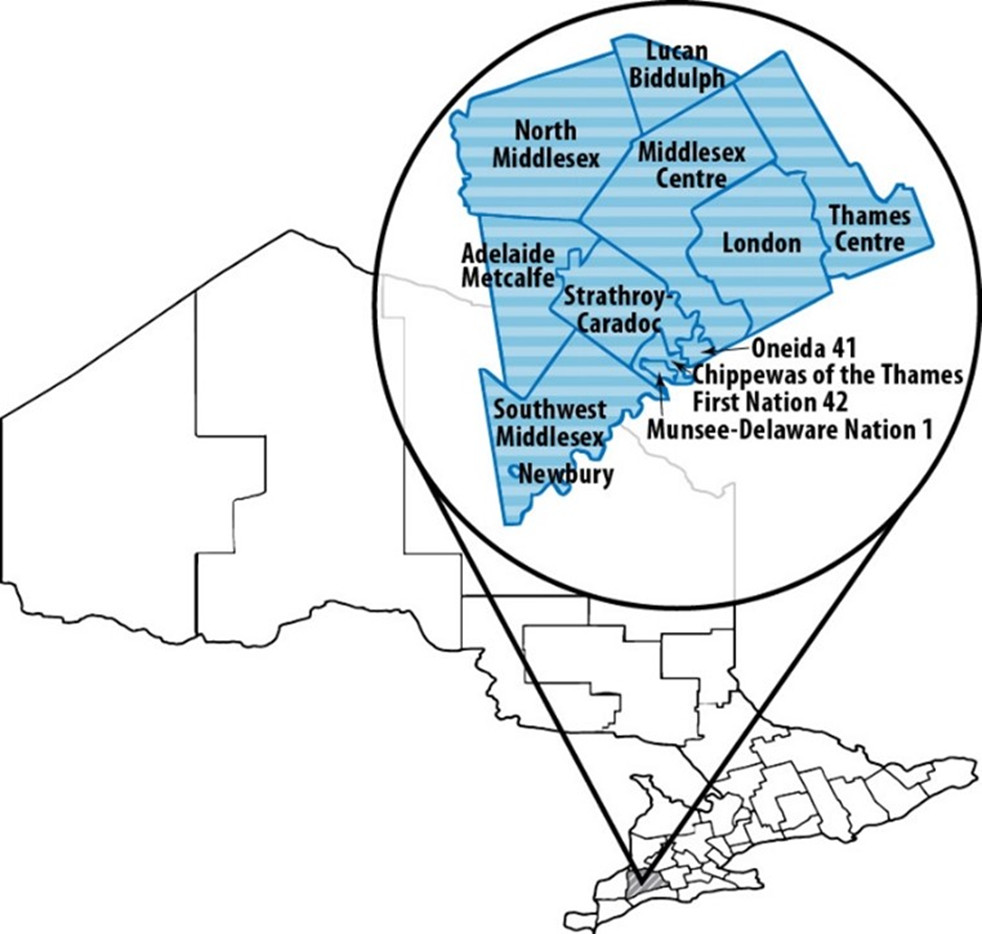
Sentinel site 2: British Columbia (Fraser Health)
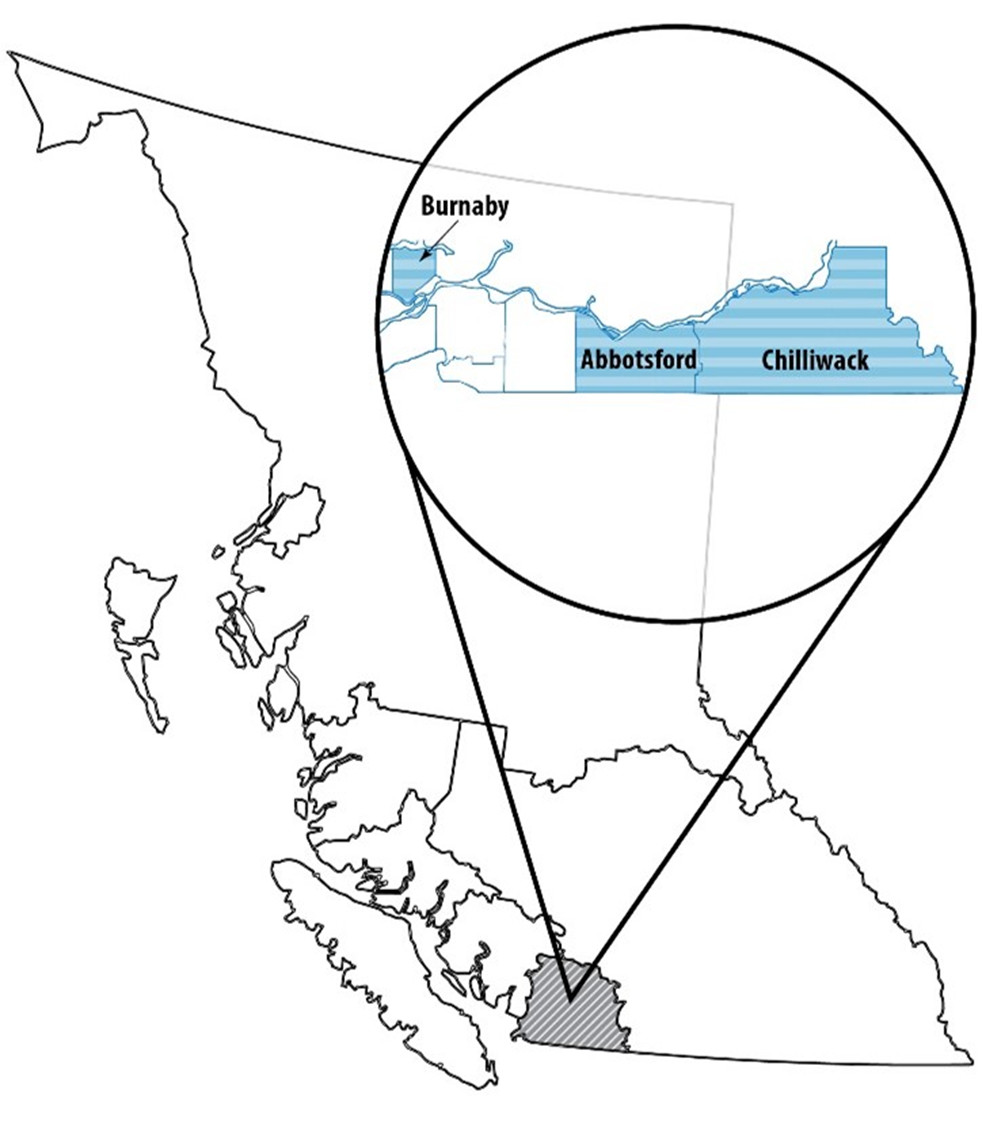
Sentinel site 3: Alberta (Alberta Health Services: Calgary and Central Zones)

Sentinel site 4: Quebec (Région sociosanitaire de la Montérégie)

Appendix C: Non-human sample types tested in 2019
| Site | Retail | Farm | Water |
|---|---|---|---|
| British Columbia | Ground beef, skinless chicken breast, frozen breaded chicken products (cooked/uncooked), pork sausage, bivalve molluscs | Broiler chickens, turkeys, dairyAppendix C Footnote * | Irrigation |
| Alberta | Ground beef, skinless chicken breast, frozen breaded chicken products (cooked/uncooked), pork sausage, bivalve molluscs | Broiler chickens, swine, turkeys, feedlot beef, dairyAppendix C Footnote * | Irrigation |
| Ontario | Ground beef, skinless chicken breast, frozen breaded chicken products (cooked/uncooked), pork sausage, bivalve molluscs | Broiler chickens, swine, turkeys, dairyAppendix C Footnote * | Surface |
| Quebec | Ground beef, skinless chicken breast, frozen breaded chicken products (cooked/uncooked), pork sausage | Broiler chickens, swine, turkeys, dairyAppendix C Footnote * | Not tested |
|
|||
Appendix D: Abbreviations
- AB:
- Alberta
- BC:
- British Columbia
- CIPARS:
- Canadian Integrated Program for Antimicrobial Resistance Surveillance
- FBCP:
- Frozen Breaded Chicken Products
- NT:
- Not Tested
- ON:
- Ontario
- PCR:
- Polymerase chain reaction
- PHAC:
- Public Health Agency of Canada
- QC:
- Quebec
- STEC:
- Shigatoxigenic Escherichia coli
Page details
- Date modified: