
Archived: Air Pollutant Emission Inventory report: chapter 2.11
2.11 Polycyclic aromatic hydrocarbons
The APEI reports emissions of four polycyclic aromatic hydrocarbons (PAHs): benzo(a)pyrene (B(a)p), benzo(b)fluoranthene (B(b)f), benzo(k)fluoranthene (B(k)f) and indeno[1,2,3-cd]pyrene (I(1,2,3-cd)p). The analysis presented here is based on the aggregate total of all four substances. In 2016, 106 t of PAHs were emitted in Canada (Table 2–13), with 96% (102 t) attributed to commercial/residential/institutional sources. This is almost entirely due to home firewood burning, which contributed 96% (102 t) of total PAH emissions. Fires contributed almost all the remaining 2% (2.4 t) of PAH emissions in 2016.
From 1990 to 2016, emissions of PAHs decreased by 68% (230 t) (Figure 2–11). This trend is primarily due to emission reductions in the aluminium industry and iron and steel industries. The aluminium industry experienced a large drop in PAH emissions from 2001 to 2010 due to process improvements and the progressive closure of old Söderberg aluminium production technology (ECCC 2014). It experienced additional decreases between 2014 and 2016, related to the replacement of old smelting equipment with a modern smelter at the facility which historically contributed the largest share of PAH emissions.
PAH emissions from iron and steel industries experienced a large drop earlier in the time series, from 1993 to 2006, and remained quite small and constant from 2006 to 2016. Reductions in this sector are a result of effective emission controls on coke ovens and electric arc furnaces.
Home firewood burning dominates PAH emissions throughout the time series. However, this source experienced a more modest 25% (34 t) emission decrease from 1990 to 2016. This can be attributed to a reduction in the use of wood as heating fuel and to the increased use of newer technologies in fireplace inserts, furnaces and stoves that limit the emission of both wood smoke and, as a result, PAHs by improving combustion efficiency.
The most significant changes in PAH emissions from 1990 to 2016 include:
- ore and mineral industries source emissions: decrease of almost 100% (188 t)
- aluminium industry: decrease of almost 100% (109 t)
- iron and steel industries: decrease of 99% (79 t)
- commercial/residential/institutional emissions: decrease of 25% (34 t)
- home firewood burning: decrease of 25% (34 t)
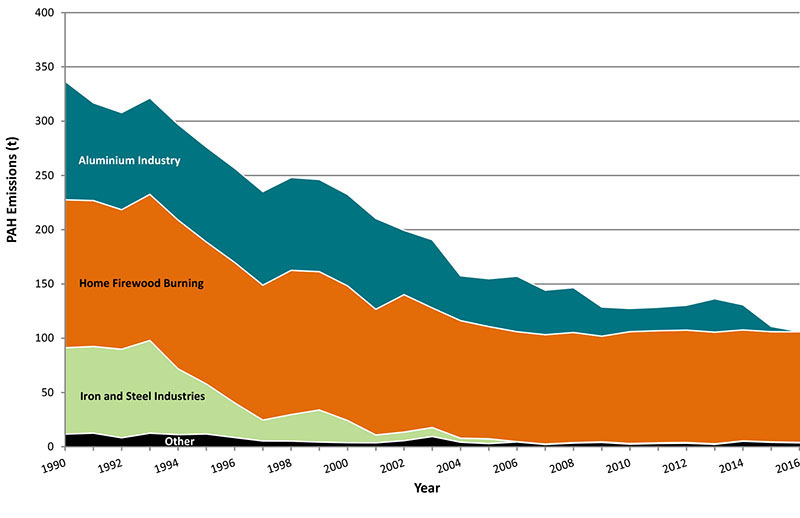
Long description for figure 2-11
Figure 2-11 displays the four major sections that contribute to national polycyclic aromatic hydrocarbons trends. The following table displays the contributions (t) for the years 1990 to 2016.
| Sector | 1990 | 1991 | 1992 | 1993 | 1994 | 1995 | 1996 | 1997 | 1998 | 1999 | 2000 | 2001 | 2002 | 2003 | 2004 | 2005 | 2006 | 2007 | 2008 | 2009 | 2010 | 2011 | 2012 | 2013 | 2014 | 2015 | 2016 |
|---|---|---|---|---|---|---|---|---|---|---|---|---|---|---|---|---|---|---|---|---|---|---|---|---|---|---|---|
| Sector 1 - Aluminium Industry | 109.2049 | 90.0343 | 89.3904 | 88.7464 | 88.1024 | 87.4584 | 86.8145 | 86.1705 | 85.5265 | 84.8825 | 84.2386 | 83.6766 | 59.2596 | 62.7673 | 41.3276 | 44.062 | 51.1181 | 40.97667 | 41.29323 | 26.84837 | 21.35634 | 21.58696 | 22.88757 | 30.76333 | 23.14169 | 4.860968 | 0.102881 |
| Sector 2 - Home Firewood Burning | 136.3088 | 134.4101 | 128.55 | 134.6032 | 137.0764 | 130.8123 | 129.369 | 124.2984 | 132.8719 | 127.452 | 124.0658 | 115.8105 | 126.6222 | 110.2249 | 108.3117 | 103.3678 | 101.2723 | 100.7754 | 101.4649 | 97.34415 | 103.0085 | 103.2815 | 103.5096 | 102.8849 | 102.2116 | 101.5637 | 101.9778 |
| Sector 3 - Iron and Steel Industries | 79.6273 | 79.9204 | 81.6688 | 85.5012 | 60.6542 | 46.1507 | 32.0213 | 19.2933 | 24.4801 | 29.6129 | 20.4732 | 7.2878 | 7.9436 | 8.2987 | 3.747 | 4.50904 | 0.339962 | 0.437893 | 0.457818 | 0.581929 | 0.720235 | 0.681403 | 0.744078 | 0.549212 | 0.403901 | 0.398873 | 0.444531 |
| Sector 4 - Other | 11.63907 | 12.52368 | 8.243694 | 12.47755 | 11.14175 | 11.71869 | 8.49185 | 5.318073 | 5.213273 | 4.302552 | 3.738195 | 3.613007 | 5.605673 | 9.424877 | 4.181229 | 2.880577 | 4.397852 | 2.082326 | 3.374705 | 3.9786 | 2.330871 | 2.993603 | 3.235948 | 2.19088 | 5.05892 | 4.073685 | 3.573171 |
| Source | Sector | 1990 | 2000 | 2005 | 2011 | 2012 | 2013 | 2014 | 2015 | 2016 |
|---|---|---|---|---|---|---|---|---|---|---|
| Ore and Mineral Industries | nil | 190 000 | 100 000 | 49 000 | 22 000 | 24 000 | 32 000 | 24 000 | 5 400 | 690 |
| Ore and Mineral Industries | Aluminium Industry | 110 000 | 84 000 | 44 000 | 22 000 | 23 000 | 31 000 | 23 000 | 4 900 | 100 |
| Ore and Mineral Industries | Asphalt Paving Industry | 14 | 14 | 15 | 15 | 12 | 12 | 13 | 13 | 13 |
| Ore and Mineral Industries | Cement and Concrete Industry | 17 | 13 | 19 | 0.77 | 1.6 | 1.7 | 3.1 | 2.8 | 0.23 |
| Ore and Mineral Industries | Foundries | no emissions (-) | - | - | - | - | - | - | - | - |
| Ore and Mineral Industries | Iron and Steel Industries | 80 000 | 20 000 | 4 500 | 680 | 740 | 550 | 400 | 400 | 440 |
| Ore and Mineral Industries | Iron Ore Industry | - | - | - | 18 | 19 | 18 | 19 | 20 | 20 |
| Ore and Mineral Industries | Mineral Products Industry | - | - | - | - | - | - | - | - | - |
| Ore and Mineral Industries | Mining and Rock Quarrying | 0.3 | 0.5 | - | 0.3 | 0.25 | 160 | 250 | 110 | 110 |
| Ore and Mineral Industries | Non-Ferrous Mining and Smelting Industry | 1.9 | 2.8 | 0.36 | 0.33 | 0.27 | 0.31 | 0.31 | 0.32 | 0.3 |
| Oil and Gas Industry | nil | 150 | 100 | 45 | 24 | 28 | 27 | 25 | 24 | 20 |
| Oil and Gas Industry | Downstream Oil and Gas Industry | 150 | 100 | 42 | 16 | 19 | 18 | 16 | 19 | 14 |
| Oil and Gas Industry | Upstream Oil and Gas Industry | 2.3 | 3.4 | 3 | 8.4 | 8.2 | 9 | 9.8 | 4.8 | 5.8 |
| Electric Power Generation (Utilities) | nil | 370 | 340 | 240 | 14 | 7.8 | 6.7 | 6.4 | 6.1 | 6.8 |
| Electric Power Generation (Utilities) | Coal | 240 | 230 | 240 | - | - | - | - | - | - |
| Electric Power Generation (Utilities) | Diesel | - | - | - | - | - | - | - | - | - |
| Electric Power Generation (Utilities) | Natural Gas | 2.9 | 2.3 | 0.22 | 0.93 | 0.069 | 0.032 | 0.033 | 0.044 | 0.045 |
| Electric Power Generation (Utilities) | Waste Materials | - | - | - | - | - | - | - | - | - |
| Electric Power Generation (Utilities) | Other Electric Power Generation | 130 | 110 | - | 13 | 7.7 | 6.7 | 6.4 | 6 | 6.8 |
| Manufacturing | nil | 320 | 300 | 300 | 100 | 170 | 130 | 170 | 110 | 98 |
| Manufacturing | Abrasives Manufacture | - | - | - | - | - | - | - | - | - |
| Manufacturing | Bakeries | - | - | - | - | - | - | - | - | - |
| Manufacturing | Biofuel Production | - | - | - | - | - | - | - | - | - |
| Manufacturing | Chemicals Industry | 0.6 | 20 | 29 | 28 | 28 | 25 | 24 | 25 | 25 |
| Manufacturing | Electronics | - | - | - | - | - | - | - | - | - |
| Manufacturing | Food Preparation | - | - | - | - | - | - | - | - | - |
| Manufacturing | Glass Manufacture | <0.01 | <0.01 | 1 | - | - | - | - | - | - |
| Manufacturing | Grain Industries | - | - | - | - | - | - | - | - | - |
| Manufacturing | Metal Fabrication | 1.1 | 1.1 | 7 | 4.6 | 4.1 | 4.1 | - | - | - |
| Manufacturing | Plastics Manufacture | - | - | - | - | - | - | - | - | - |
| Manufacturing | Pulp and Paper Industry | 110 | 130 | 190 | 59 | 120 | 91 | 130 | 73 | 64 |
| Manufacturing | Textiles | - | - | - | - | - | - | - | - | - |
| Manufacturing | Vehicle Manufacture (Engines, Parts, Assembly, Painting) | 0.02 | 0.23 | - | - | 0.015 | 0.024 | 0.026 | 0.021 | 0.014 |
| Manufacturing | Wood Products | 210 | 150 | 72 | 13 | 12 | 11 | 9.7 | 9.7 | 9.7 |
| Manufacturing | Other Manufacturing Industries | - | - | 2.2 | - | - | - | - | - | - |
| Transportation and Mobile Equipment | nil | 220 | 240 | 250 | 180 | 170 | 150 | 140 | 100 | 120 |
| Transportation and Mobile Equipment | Air Transportation | 13 | 11 | 7.7 | 6.8 | 8.3 | 8.6 | 8.6 | 9.2 | 9.6 |
| Transportation and Mobile Equipment | Heavy-duty Diesel Vehicles | 0.91 | 0.99 | 1.2 | 0.91 | 0.82 | 0.77 | 0.72 | 0.63 | 0.62 |
| Transportation and Mobile Equipment | Heavy-duty Gasoline Vehicles | 5.9 | 4.2 | 4.2 | 2.3 | 2.3 | 2.3 | 1.8 | 1.8 | 1.8 |
| Transportation and Mobile Equipment | Heavy-duty LPG/NG Vehicles | 1.1 | 1.3 | 0.33 | 0.016 | <0.01 | <0.01 | <0.01 | <0.01 | <0.01 |
| Transportation and Mobile Equipment | Light-duty Diesel Trucks | <0.01 | <0.01 | <0.01 | <0.01 | <0.01 | <0.01 | <0.01 | <0.01 | <0.01 |
| Transportation and Mobile Equipment | Light-duty Diesel Vehicles | <0.01 | <0.01 | <0.01 | <0.01 | <0.01 | <0.01 | <0.01 | <0.01 | <0.01 |
| Transportation and Mobile Equipment | Light-duty Gasoline Trucks | 4.3 | 5.3 | 3.8 | 3 | 3 | 2.9 | 2.8 | 2.8 | 2.9 |
| Transportation and Mobile Equipment | Light-duty Gasoline Vehicles | 11 | 7.5 | 5 | 3.2 | 3 | 2.9 | 2.6 | 2.5 | 2.5 |
| Transportation and Mobile Equipment | Light-duty LPG/NG Trucks | 0.047 | 0.025 | 0.012 | <0.01 | <0.01 | <0.01 | <0.01 | <0.01 | <0.01 |
| Transportation and Mobile Equipment | Light-duty LPG/NG Vehicles | 0.38 | 0.17 | 0.081 | <0.01 | <0.01 | <0.01 | <0.01 | <0.01 | <0.01 |
| Transportation and Mobile Equipment | Marine Transportation | 120 | 150 | 170 | 110 | 97 | 83 | 69 | 39 | 56 |
| Transportation and Mobile Equipment | Motorcycles | 0.038 | 0.037 | 0.042 | 0.039 | 0.039 | 0.037 | 0.036 | 0.037 | 0.039 |
| Transportation and Mobile Equipment | Off-road Diesel Vehicles and Equipment | - | - | - | - | - | - | - | - | - |
| Transportation and Mobile Equipment | Off-road Gasoline/LPG/CNG Vehicles and Equipment | - | - | - | - | - | - | - | - | - |
| Transportation and Mobile Equipment | Rail Transportation | 63 | 59 | 58 | 51 | 51 | 49 | 50 | 48 | 44 |
| Transportation and Mobile Equipment | Tire Wear and Brake Lining | - | - | - | - | - | - | - | - | - |
| Agriculture | nil | 0.32 | 0.31 | 0.21 | 0.37 | 0.34 | 0.34 | 0.37 | 0.33 | 0.34 |
| Agriculture | Animal Production | - | - | - | - | - | - | - | - | - |
| Agriculture | Crop Production | - | - | - | - | - | - | - | - | - |
| Agriculture | Fuel Use | 0.32 | 0.31 | 0.21 | 0.37 | 0.34 | 0.34 | 0.37 | 0.33 | 0.34 |
| Commercial / Residential / Institutional | nil | 140 000 | 120 000 | 100 000 | 100 000 | 100 000 | 100 000 | 100 000 | 100 000 | 100 000 |
| Commercial / Residential / Institutional | Cigarette Smoking | 1 | 0.9 | 0.68 | 0.63 | 0.62 | 0.53 | 0.54 | 0.48 | 0.48 |
| Commercial / Residential / Institutional | Commercial and Institutional Fuel Combustion | 2.6 | 3.1 | 3 | 2.3 | 2.2 | 2.2 | 2.4 | 2.2 | 2.1 |
| Commercial / Residential / Institutional | Commercial Cooking | 100 | 110 | 120 | 120 | 120 | 120 | 120 | 110 | 110 |
| Commercial / Residential / Institutional | Construction Fuel Combustion | 0.45 | 0.19 | 0.42 | 0.36 | 0.34 | 0.28 | 0.28 | 0.29 | 0.23 |
| Commercial / Residential / Institutional | Home Firewood Burning | 140 000 | 120 000 | 100 000 | 100 000 | 100 000 | 100 000 | 100 000 | 100 000 | 100 000 |
| Commercial / Residential / Institutional | Human | - | - | - | - | - | - | - | - | - |
| Commercial / Residential / Institutional | Marine Cargo Handling | - | - | - | - | - | - | - | - | - |
| Commercial / Residential / Institutional | Residential Fuel Combustion | 5.3 | 4.6 | 4.3 | 3.9 | 3.5 | 3.4 | 3.5 | 3.3 | 3 |
| Commercial / Residential / Institutional | Service Stations | - | - | - | - | - | - | - | - | - |
| Commercial / Residential / Institutional | Other Miscellaneous Sources | - | - | - | - | - | - | - | - | - |
| Incineration and Waste | nil | 670 | 630 | 690 | 690 | 680 | 680 | 690 | 690 | 700 |
| Incineration and Waste | Crematoriums | <0.01 | <0.01 | <0.01 | <0.01 | <0.01 | <0.01 | <0.01 | <0.01 | <0.01 |
| Incineration and Waste | Waste Incineration | 670 | 630 | 690 | 690 | 680 | 680 | 690 | 690 | 700 |
| Incineration and Waste | Waste Treatment and Disposal | - | - | 3 | 0.048 | 0.05 | 0.13 | 0.24 | 0.11 | 0.012 |
| Paints and Solvents | nil | - | - | - | - | - | - | - | - | - |
| Paints and Solvents | Dry Cleaning | - | - | - | - | - | - | - | - | - |
| Paints and Solvents | General Solvent Use | - | - | - | - | - | - | - | - | - |
| Paints and Solvents | Printing | - | - | - | - | - | - | - | - | - |
| Paints and Solvents | Surface Coatings | - | - | - | - | - | - | - | - | - |
| Dust | nil | - | - | - | - | - | - | - | - | - |
| Dust | Coal Transportation | - | - | - | - | - | - | - | - | - |
| Dust | Construction Operations | - | - | - | - | - | - | - | - | - |
| Dust | Mine Tailings | - | - | - | - | - | - | - | - | - |
| Dust | Paved Roads | - | - | - | - | - | - | - | - | - |
| Dust | Unpaved Roads | - | - | - | - | - | - | - | - | - |
| Fires | nil | 9 800 | 2 000 | 1 200 | 1 800 | 2 000 | 880 | 3 600 | 2 900 | 2 400 |
| Fires | Prescribed Forest Burning | - | - | - | - | - | - | - | - | - |
| Fires | Structural Fires | 9 800 | 2 000 | 1 200 | 1 800 | 2 000 | 880 | 3 600 | 2 900 | 2 400 |
| Grand Total | nil | 340 000 | 230 000 | 150 000 | 130 000 | 130 000 | 140 000 | 130 000 | 110 000 | 110 000 |
Notes:
totals may not add up due to rounding
- denotes no emissions
Page details
- Date modified: