
Archived: Air Pollutant Emission Inventory report: chapter 2.1
2.1 Particulate matter less than or equal to 2.5 microns in diameter (PM2.5)
In 2016, approximately 1.6 million tonnes (Mt) of PM2.5 were emitted in Canada (Table 2-3). Dust sources accounted for 62% (1.0 Mt) of total PM2.5 emissions, with the most important dust sources being construction operations at 51% (506 kt) of dust emisisons and dust from unpaved and paved roads at 49% (493 kt) of dust emissions. Agriculture was the second largest contributor and accounted for 19% (308 kt) of PM2.5 emissions, most of which are attributed to crop production (19% or 306 kt of annual PM2.5 emissions). In these sectors, PM is largely emitted by non-combustion sources.
Commercial/residential/institutional sources accounted for 11% (184 kt) of total PM2.5 emissions in 2016, with the most important sector being home firewood burning at 10% (163 kt) of total PM2.5 emissions. All other commercial/residential/institutional sources accountted for less than 2% of total PM2.5 emissions.
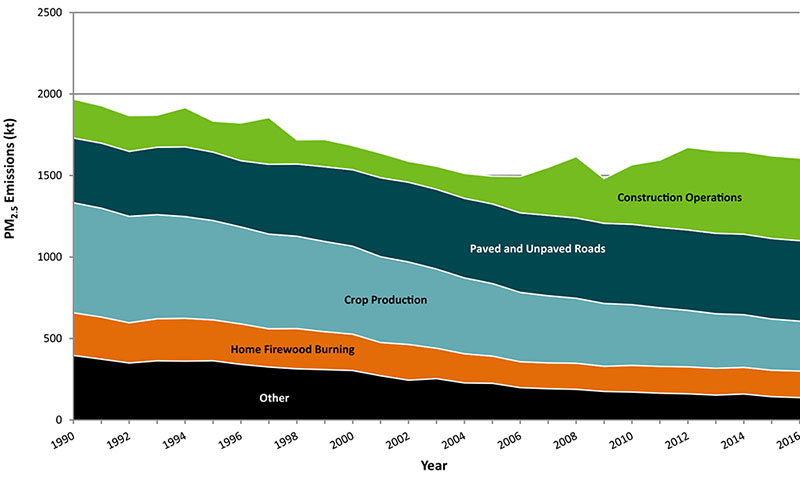
Overall, emissions of PM2.5 decreased from 1990 to 2016 (Figure 2-1), despite an increasing trend from construction operations, as well as paved and unpaved roads. The downward trend was influenced predominantly by decreasing emissions from crop production, home firewood burning and other sectors. Decreases in emissions from crop production can be attributed to the adoption of conservation tillage practices. Decreases in home firewood burning are due to the use of new fireplace inserts, furnaces and stoves with improved PM2.5 emission controls and combustion efficiencies. Emissions from construction operations tended to decrease until 2002, followed by an increase from 2002 to 2012. PM2.5 emissions from paved and unpaved roads followed a more gradual, consistent increasing trend from 1990 to 2002 and remained stable between 2002 and 2016. The trend in PM2.5 emissions from roads is driven predominantly by the use of unpaved roads in Alberta, Ontario and Quebec.
The most significant changes in PM2.5 emissions from 1990 to 2016 include:
- dust sources: increase of 57% (363 kt)
- construction operations: increase of 112% (268 kt)
- dust from paved and unpaved roads: increase of 24% (97 kt total)
- agriculture sources: decrease of 54% (369 kt)
- crop production: decrease of 55% (369 kt)
- commercial/residential/institutional sources: decrease of 35% (98 kt)
- home firewood burning: decrease of 38% (99 kt)
Figure 2-1: Major contributors to national PM2.5 trends
Long description for figure 2-1
Figure 2-1 displays the five major sections that contribute to national PM2.5 trends. The following table displays the contributions (kt) for the years 1990 to 2016.
| Sector | 1990 | 1991 | 1992 | 1993 | 1994 | 1995 | 1996 | 1997 | 1998 | 1999 | 2000 | 2001 | 2002 | 2003 | 2004 | 2005 | 2006 | 2007 | 2008 | 2009 | 2010 | 2011 | 2012 | 2013 | 2014 | 2015 | 2016 |
|---|---|---|---|---|---|---|---|---|---|---|---|---|---|---|---|---|---|---|---|---|---|---|---|---|---|---|---|
| Sector 1 - Construction operations | 238.9555 | 229.6539 | 219.0167 | 196.5789 | 241.2005 | 190.1205 | 231.615 | 286.8852 | 148.3081 | 167.0638 | 148.1197 | 151.38 | 128.499 | 141.6295 | 152.5457 | 169.9461 | 222.9783 | 294.8435 | 376.1876 | 273.9083 | 365.0895 | 413.2349 | 506.5722 | 506.151 | 506.3659 | 506.7945 | 506.4629 |
| Sector 2 - Paved and Unpaved Roads | 396.9091 | 398.9573 | 398.4322 | 413.55 | 427.6426 | 419.9424 | 406.0253 | 428.1065 | 442.8795 | 458.4625 | 468.7888 | 484.312 | 488.8503 | 489.001 | 488.1663 | 488.1921 | 488.2054 | 493.2445 | 492.5005 | 491.6804 | 493.0168 | 492.934 | 493.1796 | 493.284 | 493.5344 | 493.8907 | 493.4034 |
| Sector 3 - Crop production | 674.9502 | 667.8055 | 652.9787 | 638.6437 | 624.0048 | 609.295 | 594.9226 | 580.7797 | 566.9177 | 553.2839 | 539.6686 | 526.2972 | 506.1853 | 485.9478 | 465.3296 | 445.4399 | 425.2976 | 411.9146 | 398.6366 | 385.5322 | 372.4581 | 359.1012 | 346.5857 | 334.4518 | 323.5903 | 314.1733 | 305.7803 |
| Sector 4 - Home Firewood Burning | 262.0868 | 258.3628 | 246.9699 | 258.4548 | 263.1002 | 251.239 | 248.0165 | 234.7572 | 246.9738 | 232.8501 | 223.1729 | 204.1993 | 219.2166 | 186.3784 | 179.2087 | 166.8228 | 158.8497 | 158.5303 | 160.3186 | 154.3881 | 163.7802 | 164.8025 | 165.7691 | 164.7069 | 163.5655 | 162.4652 | 163.2582 |
| Sector 5 - Other | 396.0651 | 373.3922 | 349.61 | 362.8908 | 360.8548 | 363.1857 | 341.4577 | 325.0408 | 313.7685 | 309.0418 | 303.5075 | 271.3512 | 244.26 | 254.0132 | 227.3115 | 225.2233 | 198.5433 | 191.903 | 188.0543 | 175.2987 | 171.4245 | 164.4056 | 160.6545 | 152.7522 | 159.3584 | 143.2066 | 136. |
| Source | Sector | 1990 | 2000 | 2005 | 2011 | 2012 | 2013 | 2014 | 2015 | 2016 |
|---|---|---|---|---|---|---|---|---|---|---|
| Ore and Mineral Industries | nil | 59 000 | 55 000 | 44 000 | 35 000 | 36 000 | 33 000 | 33 000 | 32 000 | 33 000 |
| Ore and Mineral Industries | Aluminium Industry | 5 400 | 4 500 | 4 700 | 4 500 | 4 500 | 4 100 | 3 700 | 3 300 | 3 400 |
| Ore and Mineral Industries | Asphalt Paving Industry | 1 900 | 1 700 | 1 500 | 1 800 | 1 500 | 1 400 | 1 600 | 1 600 | 1 600 |
| Ore and Mineral Industries | Cement and Concrete Industry | 11 000 | 9 600 | 13 000 | 7 500 | 7 800 | 7 800 | 7 600 | 7 600 | 7 400 |
| Ore and Mineral Industries | Foundries | 6 100 | 5 100 | 5 200 | 5 200 | 5 200 | 5 200 | 5 200 | 5 200 | 5 200 |
| Ore and Mineral Industries | Iron and Steel Industries | 11 000 | 9 400 | 5 100 | 2 100 | 2 600 | 2 100 | 2 500 | 2 400 | 2 200 |
| Ore and Mineral Industries | Iron Ore Industry | 1 600 | 4 500 | 1 700 | 1 100 | 1 100 | 1 100 | 950 | 950 | 1 000 |
| Ore and Mineral Industries | Mineral Products Industry | 1 200 | 1 100 | 940 | 270 | 230 | 330 | 350 | 300 | 260 |
| Ore and Mineral Industries | Mining and Rock Quarrying | 12 000 | 13 000 | 8 000 | 10 000 | 11 000 | 9 100 | 8 900 | 8 300 | 10 000 |
| Ore and Mineral Industries | Non-Ferrous Mining and Smelting Industry | 8 800 | 6 000 | 4 800 | 1 900 | 1 900 | 1 800 | 1 900 | 2 100 | 1 800 |
| Oil and Gas Industry | nil | 12 000 | 13 000 | 12 000 | 9 600 | 10 000 | 11 000 | 13 000 | 12 000 | 11 000 |
| Oil and Gas Industry | Downstream Oil and Gas Industry | 5 100 | 4 900 | 4 600 | 1 900 | 1 800 | 1 700 | 1 600 | 1 400 | 1 500 |
| Oil and Gas Industry | Upstream Oil and Gas Industry | 7 200 | 8 400 | 7 800 | 7 600 | 8 300 | 9 400 | 11 000 | 11 000 | 9 700 |
| Electric Power Generation (Utilities) | nil | 49 000 | 23 000 | 9 000 | 4 300 | 3 200 | 3 200 | 3 500 | 3 400 | 3 300 |
| Electric Power Generation (Utilities) | Coal | 46 000 | 20 000 | 5 000 | 2 500 | 2 300 | 2 200 | 2 500 | 2 400 | 2 200 |
| Electric Power Generation (Utilities) | Diesel | 260 | 400 | 380 | 170 | 160 | 160 | 180 | 190 | 200 |
| Electric Power Generation (Utilities) | Natural Gas | 1 300 | 2 000 | 1 800 | 1 300 | 440 | 470 | 390 | 390 | 350 |
| Electric Power Generation (Utilities) | Waste Materials | 0.41 | 2.9 | 1.6 | 4.0 | 4.5 | 2.5 | 2.3 | 2.4 | 16 |
| Electric Power Generation (Utilities) | Other Electric Power Generation | 1 300 | 740 | 1 800 | 430 | 330 | 340 | 440 | 450 | 530 |
| Manufacturing | nil | 120 000 | 79 000 | 44 000 | 21 000 | 20 000 | 21 000 | 19 000 | 19 000 | 18 000 |
| Manufacturing | Abrasives Manufacture | 390 | 210 | 200 | 5.4 | 7.8 | 8.1 | 8.4 | 15 | 14 |
| Manufacturing | Bakeries | 0.54 | 0.54 | 0.43 | 2.0 | 0.87 | 0.78 | 0.76 | 6.9 | 10 |
| Manufacturing | Biofuel Production | no emissions (-) | - | - | 4.2 | 4.3 | 3.9 | 4.4 | 4.6 | 4.2 |
| Manufacturing | Chemicals Industry | 4 800 | 4 500 | 4 000 | 1 400 | 1 500 | 1 600 | 1 400 | 1 300 | 1 300 |
| Manufacturing | Electronics | 120 | 39 | 5.2 | 0.46 | - | - | 0.55 | 0.49 | - |
| Manufacturing | Food Preparation | 1 400 | 2 100 | 1 700 | 780 | 730 | 810 | 770 | 740 | 720 |
| Manufacturing | Glass Manufacture | 920 | 1 300 | 1 100 | 230 | 140 | 140 | 150 | 150 | 160 |
| Manufacturing | Grain Industries | 2 200 | 2 900 | 2 000 | 2 500 | 2 600 | 2 400 | 2 800 | 2 800 | 2 900 |
| Manufacturing | Metal Fabrication | 820 | 1 300 | 960 | 850 | 850 | 780 | 420 | 410 | 410 |
| Manufacturing | Plastics Manufacture | 170 | 180 | 110 | 130 | 110 | 79 | 70 | 53 | 62 |
| Manufacturing | Pulp and Paper Industry | 61 000 | 25 000 | 17 000 | 9 200 | 8 400 | 9 000 | 8 400 | 7 600 | 6 900 |
| Manufacturing | Textiles | 16 | 23 | 18 | 3.4 | 2.7 | 2.8 | 2.5 | 1.2 | 0.37 |
| Manufacturing | Vehicle Manufacture (Engines, Parts, Assembly, Painting) | 1 700 | 1 600 | 600 | 330 | 220 | 210 | 190 | 180 | 180 |
| Manufacturing | Wood Products | 37 000 | 31 000 | 14 000 | 5 300 | 5 600 | 5 600 | 4 700 | 5 100 | 4 600 |
| Manufacturing | Other Manufacturing Industries | 6 200 | 8 800 | 2 900 | 200 | 170 | 190 | 180 | 170 | 190 |
| Transportation and Mobile Equipment | nil | 96 000 | 97 000 | 80 000 | 60 000 | 55 000 | 53 000 | 51 000 | 40 000 | 36 000 |
| Transportation and Mobile Equipment | Air Transportation | 640 | 840 | 830 | 770 | 860 | 880 | 860 | 870 | 890 |
| Transportation and Mobile Equipment | Heavy-duty Diesel Vehicles | 15 000 | 15 000 | 17 000 | 12 000 | 11 000 | 11 000 | 9 800 | 8 700 | 8 500 |
| Transportation and Mobile Equipment | Heavy-duty Gasoline Vehicles | 3 300 | 2 300 | 2 100 | 1 200 | 1 200 | 1 100 | 950 | 910 | 960 |
| Transportation and Mobile Equipment | Heavy-duty LPG/NG Vehicles | 600 | 680 | 160 | 8.5 | 5.0 | 2.7 | 1.4 | 1.2 | 1.8 |
| Transportation and Mobile Equipment | Light-duty Diesel Trucks | 13 | 13 | 14 | 11 | 9.8 | 10 | 12 | 14 | 16 |
| Transportation and Mobile Equipment | Light-duty Diesel Vehicles | 49 | 27 | 16 | 14 | 13 | 13 | 13 | 14 | 13 |
| Transportation and Mobile Equipment | Light-duty Gasoline Trucks | 2 000 | 2 400 | 1 600 | 1 300 | 1 300 | 1 300 | 1 200 | 1 200 | 1 300 |
| Transportation and Mobile Equipment | Light-duty Gasoline Vehicles | 4 800 | 3 500 | 2 200 | 1 400 | 1 300 | 1 300 | 1 200 | 1 100 | 1 100 |
| Transportation and Mobile Equipment | Light-duty LPG/NG Trucks | 23 | 12 | 5.3 | 0.13 | 0.062 | 0.027 | 0.020 | 0.018 | 0.023 |
| Transportation and Mobile Equipment | Light-duty LPG/NG Vehicles | 180 | 84 | 36 | 1.8 | 1.2 | 0.61 | 0.46 | 0.41 | 0.46 |
| Transportation and Mobile Equipment | Marine Transportation | 9 700 | 13 000 | 15 000 | 13 000 | 13 000 | 13 000 | 13 000 | 4 700 | 4 800 |
| Transportation and Mobile Equipment | Motorcycles | 21 | 21 | 23 | 21 | 21 | 20 | 19 | 20 | 21 |
| Transportation and Mobile Equipment | Off-road Diesel Vehicles and Equipment | 41 000 | 42 000 | 29 000 | 20 000 | 17 000 | 16 000 | 14 000 | 14 000 | 10 000 |
| Transportation and Mobile Equipment | Off-road Gasoline/LPG/CNG Vehicles and Equipment | 15 000 | 12 000 | 7 700 | 5 800 | 5 200 | 4 900 | 4 900 | 4 900 | 4 400 |
| Transportation and Mobile Equipment | Rail Transportation | 3 600 | 3 400 | 3 300 | 2 900 | 2 900 | 2 800 | 2 900 | 2 700 | 2 500 |
| Transportation and Mobile Equipment | Tire Wear and Brake Lining | 710 | 1 100 | 1 200 | 1 400 | 1 400 | 1 400 | 1 400 | 1 500 | 1 500 |
| Agriculture | nil | 680 000 | 540 000 | 450 000 | 360 000 | 350 000 | 340 000 | 330 000 | 320 000 | 310 000 |
| Agriculture | Animal Production | 1 700 | 2 100 | 2 300 | 2 000 | 2 000 | 2 000 | 2 000 | 2 100 | 2 100 |
| Agriculture | Crop Production | 670 000 | 540 000 | 450 000 | 360 000 | 350 000 | 330 000 | 320 000 | 310 000 | 310 000 |
| Agriculture | Fuel Use | 120 | 140 | 130 | 280 | 280 | 280 | 290 | 260 | 250 |
| Commercial / Residential / Institutional | nil | 280 000 | 240 000 | 190 000 | 190 000 | 190 000 | 190 000 | 190 000 | 180 000 | 180 000 |
| Commercial / Residential / Institutional | Cigarette Smoking | 810 | 690 | 530 | 490 | 480 | 410 | 410 | 370 | 370 |
| Commercial / Residential / Institutional | Commercial and Institutional Fuel Combustion | 2 000 | 2 600 | 2 600 | 2 400 | 2 300 | 2 400 | 2 600 | 2 400 | 2 400 |
| Commercial / Residential / Institutional | Commercial Cooking | 14 000 | 15 000 | 17 000 | 17 000 | 17 000 | 17 000 | 16 000 | 15 000 | 15 000 |
| Commercial / Residential / Institutional | Construction Fuel Combustion | 180 | 110 | 160 | 150 | 160 | 150 | 140 | 140 | 150 |
| Commercial / Residential / Institutional | Home Firewood Burning | 260 000 | 220 000 | 170 000 | 160 000 | 170 000 | 160 000 | 160 000 | 160 000 | 160 000 |
| Commercial / Residential / Institutional | Human | - | - | - | - | - | - | - | - | - |
| Commercial / Residential / Institutional | Marine Cargo Handling | 180 | 140 | 100 | 46 | 43 | 75 | 75 | 68 | 83 |
| Commercial / Residential / Institutional | Residential Fuel Combustion | 2 400 | 2 600 | 2 500 | 2 500 | 2 300 | 2 400 | 2 500 | 2 400 | 2 100 |
| Commercial / Residential / Institutional | Service Stations | - | - | - | - | - | - | - | - | - |
| Commercial / Residential / Institutional | Other Miscellaneous Sources | - | - | - | - | - | - | - | - | - |
| Incineration and Waste | nil | 5 100 | 4 500 | 3 800 | 2 900 | 2 700 | 2 700 | 2 700 | 2 700 | 2 700 |
| Incineration and Waste | Crematoriums | 4.3 | 6.6 | 5.1 | 5.9 | 6.1 | 6.4 | 6.6 | 7.1 | 7.0 |
| Incineration and Waste | Waste Incineration | 4 500 | 3 800 | 3 100 | 2 400 | 2 200 | 2 200 | 2 200 | 2 200 | 2 200 |
| Incineration and Waste | Waste Treatment and Disposal | 620 | 650 | 630 | 490 | 490 | 480 | 510 | 510 | 480 |
| Paints and Solvents | nil | 3.7 | 7.1 | 25 | 22 | 19 | 15 | 11 | 15 | 13 |
| Paints and Solvents | Dry Cleaning | 0.32 | 0.32 | 0.62 | 15 | 9.4 | 9.1 | 4.9 | 6.1 | 4.5 |
| Paints and Solvents | General Solvent Use | - | - | - | - | - | - | - | - | - |
| Paints and Solvents | Printing | 3.0 | 6.4 | 23 | 7.3 | 8.7 | 5.5 | 5.5 | 8.3 | 6.7 |
| Paints and Solvents | Surface Coatings | 0.37 | 0.37 | 0.94 | - | 0.83 | 0.78 | 0.63 | 1 | 1.5 |
| Dust | nil | 640 000 | 620 000 | 660 000 | 910 000 | 1 000 000 | 1 000 000 | 1 000 000 | 1 000 000 | 1 000 000 |
| Dust | Coal Transportation | 310 | 270 | 230 | 270 | 280 | 300 | 280 | 240 | 270 |
| Dust | Construction Operations | 240 000 | 150 000 | 170 000 | 410 000 | 510 000 | 510 000 | 510 000 | 510 000 | 510 000 |
| Dust | Mine Tailings | 1 200 | 1 300 | 660 | 660 | 660 | 660 | 660 | 660 | 660 |
| Dust | Paved Roads | 110 000 | 130 000 | 140 000 | 140 000 | 140 000 | 140 000 | 140 000 | 140 000 | 140 000 |
| Dust | Unpaved Roads | 280 000 | 330 000 | 350 000 | 350 000 | 350 000 | 350 000 | 350 000 | 350 000 | 350 000 |
| Fires | nil | 36 000 | 6 900 | 4 500 | 6 400 | 7 600 | 3 200 | 12 000 | 10 000 | 9 100 |
| Fires | Prescribed Forest Burning | 36 000 | 6 600 | 4 200 | 6 200 | 7 300 | 2 900 | 12 000 | 10 000 | 8 900 |
| Fires | Structural Fires | 350 | 280 | 250 | 280 | 280 | 280 | 200 | 190 | 190 |
| Grand Total | nil | 2 000 000 | 1 700 000 | 1 500 000 | 1 600 000 | 1 700 000 | 1 700 000 | 1 600 000 | 1 600 000 | 1 600 000 |
Notes:
totals may not add up due to rounding
- denotes no emissions
Page details
- Date modified: