
Technical report: Cost-benefit analysis - Incorporating public health care costs savings in the context of the labour market programs evaluation
On this page
- Alternate formats
- Preface
- List of abbreviations
- List of tables
- List of figures
- Acknowledgement
- Abstract
- Introduction
- Literature review
- Incorporating public health care spending in the accounting framework of cost-benefit analysis
- Data and methodology
- Key findings
- Robustness check
- Limitations
- Conclusion
- References
- Annex A: Cost-benefit analysis
- Annex B: Net impact analysis
Alternate formats

Large print, braille, MP3 (audio), e-text and DAISY formats are available on demand by ordering online or calling 1 800 O-Canada (1-800-622-6232). If you use a teletypewriter (TTY), call 1-800-926-9105.
Preface
Technical report: Cost-benefit analysis - Incorporating public health care costs savings in the context of the labour market programs evaluation
By: Jérôme Mercier, Andy Handouyahia, Jamil Sayeed, Momath Wilane, Essolaba Aouli, Azadeh Heydarirad
Evaluation Directorate
Strategic and Service Policy Branch
Employment and Social Development Canada
April 2024
The views expressed in the Evaluation directorate technical reports are the authors’ and do not necessarily reflect the opinion of Employment and Social Development Canada or of the federal government. Technical reports consist of secondary research in the form of background studies that support the research efforts of the Evaluation directorate.
List of abbreviations
- AHCC
- Annualized Health Care Cost
- AAHCC
- Adjusted Annualized Health Care Cost
- CIHI
- Canadian Institute for Health Information
- CPP
- Canada Pension Plan
- CRA
- Canada Revenue Agency
- DID
- Difference-in-Differences
- EI
- Employment Insurance
- ESDC
- Employment and Social Development Canada
- LMDA
- Labour Market Development Agreements
- QPP
- Quebec Pension Plan
List of tables
- Table 1: Costs accounting framework from the perspectives of participants, government, and society
- Table 2: Benefits accounting framework from the perspectives of participants, government, and society
- Table 3: Annualized health care cost (ahcc) under 3 different approaches
- Table 4: Estimates for scaling factors under 3 different approaches
- Table 5: Annual net impact on public health care costs for active claimants in skills development intervention
- Table 6: Annual net impact on public health care costs for active claimants in skills development interventions under 3 different scenarios
List of figures
Acknowledgement
We would like to express our appreciation to those who contributed to this technical report. We gratefully acknowledge the valuable inputs and comments received from Georges Awad, Lynne Lapointe, Himavanth Vempati and Erik Sagmoen. In addition, we extend our thanks to Professor Jeff Smith and Professor Michel Grignon for their expert advise and peer review.
Abstract
This study proposes a novel methodology to incorporate public health care spending in the cost benefit analysis of Labour Market Development Agreements evaluation. Labour Market Development Agreements foster labour market inclusion of various groups, including vulnerable population with relatively weaker labour market attachment in Canada. Cost-benefit analysis of previous evaluations were limited to the change in the earnings profile of participants and its associated effects on the collection of tax revenues and government outlays on social assistance and Employment Insurance benefits. However, literature suggests that positive outcomes associated with increased labour market attachment can affect health outcomes of the program participants. This study uses the labour market program data platform of Employment and Social Development Canada, and average public health care cost data from a report of the Canadian Institute for Health Information to estimate the impact of increased labour market attachment on government's health care expenditures. The findings of this study suggest that public health care cost decreases on average by $29 per participant per year over a 4-year post-participation period under Skills Development intervention.
Introduction
The Evaluation Directorate of Employment and Social Development Canada conducts evaluation studies focused on assessing the effectiveness of various labour market programs (for example, Labour Market Development Agreements) to ensure relevancy to program design and development. The net impact analysis of an evaluation assesses the effectiveness of labour market programs using annual impact estimates of socio-demographic and labour market indicators during participation and up to 5 years following participation. For some interventions, such as skills development, impacts are examined up to 10 years following participation (post participation period consists of 4 years of observed and 6 years of projected data). Cost-benefit analysis is a complementary study conducted along with net impact analysis to assess the longer-term impacts of the program on participants. Depending on the intervention, a typical cost-benefit analysis evaluates the cost effectiveness of a labour market program by comparing the economic costs and longer-term benefits arising from interventions over a 5-year or 10-year horizon after program participation.
The cost-benefit analysis of labour market programs accounts for all quantifiable costs and benefits directly attributable to the program that could be estimated using the available administrative data. In addition to considering the direct program cost, the existing methodology for cost-benefit analysis considers indirect costs like the Marginal Social Cost of Public Fund (MSCPF) and forgone earnings. In regard to estimating benefits from program participation, a typical cost-benefit analysis considers only the direct benefits such as increased employment income resulting from increased labour market attachment of the participants. However, there can be other indirect benefits from the participation in labour market programs, such as improvement of participants' mental and physical well-being associated with increased income. This study attempts to improve the existing methodology of the cost-benefit analysis by incorporating the indirect benefits associated with the improved health status of participants following their participation in a labour market program, relative to non-participants with similar characteristics.
When a labour market program participant enters or re-enters the job market after the completion of the program, their employment income can potentially reach higher levels relative to the employment income of non-participants with similar characteristics. In turn, higher employment income may increase access to better-quality food and shelter, exercise and leisure facilities, as well as out-of-pocket health services (in other words, prescription drugs, rehabilitation therapy, vision and dental care). Overall, this can have a positive impact on mental and physical health. In addition, training or employment can lead to psychological benefits (for example increase in self-confidence, self-esteem, social interaction) which can improve overall mental health. Since Canada's health care system is primarily publicly funded, better health outcomes for labour market programs participants can potentially translate to a decline in health care utilization, which can reduce health care expenditures incurred by governments. The main goal of this study is to estimate the change in public health care costs in Canada due to participation in labour market programs. Ideally, the impact of labour market program participation on public health care expenditures would be estimated using individual level data on both the income and health care utilization of participants and the comparison group. However, the disaggregated data on the health care utilization of the participants and comparison group is not available. Therefore, this cost-benefit analysis uses secondary data on the distribution of public health care costsFootnote 1 by income quintiles from the CIHI (2013) report to take into account the economic benefits resulting from the change in health care expenditures for labour market program participants.
To the best of our knowledge this is among the first attempts to incorporate the benefits of improved labour market attachment on the public health care system in a cost-benefit analysis for labour market program evaluation in Canada. This study uses the data of all active Employment Insurance (EI) claimants who started Skills Development interventions under Labour Market Development Agreements between January 1st, 2010 and December 31st, 2012. We use propensity score matching combined with the Difference-in-Differences method to estimate the net impact of the Labour Market Development Agreement on public health care costs. On average for a Skills Development participant, improved labour market attachment led to a public health care cost reduction of $29 per year over a 4-year post-participation period. The total discounted benefit of government from the reduction in public health care cost is $178 per participant over a 12-year period. The 12-year period includes 2 years during participation and 10 years after participation period (post participation period consists of 4 years of observed and 6 years of projected data).
The findings of this study are robust under alternative data and model specification. Under both alternative scenarios, the health care cost savings are higher compared to the baseline scenario. This suggest that the estimates of health care cost savings under baseline model is conservative.
There are few limitations of this study. The estimates of health care cost savings are only approximations, given that we use secondary data on public health care cost from the CIHI (2013) report due to the lack of individual level data on health care utilization. In addition, the analysis is limited to public health care expenditures, which represent about 70% of total health spending.
This study is organized as follows. Section 2 presents the literature review. Section 3 describes how we can incorporate public health care spending in the accounting framework for the cost benefit analysis. Section 4 discusses the data sources and the methodological approach. Section 5 presents the key findings and section 6 discusses the robustness of these findings. Finally, Section 7 highlights some of the limitations of this study and Section 8 provides the concluding remarks.
Literature review
A typical cost-benefit analysis for a labour market program evaluation assesses quantifiable costs and benefits attributed to an intervention from the participant and the government perspective. However, there is no standard methodology in cost-benefit analysis to estimate the "intangible," non-pecuniary and indirect benefits that are also related to finding and maintaining employment. Some of these benefits can have important implications on participants, government and society as a whole. For example, intangible benefits may include improvement in participants' mental and physical well-being associated with increased incomes (Butler-Jones, 2008) and reduction in crime (Bjerk, 2004; Lochner, 1999).
It is well-established in the literature that the loss of a job or a lack of employment impacts one's health. In literature, findings from papers that look into this linkage vary depend on the context, such that even when losing a job does not necessarily entail living on low-income (because social safety nets exist), being unemployed impacts both physical and mental health. Browning and Heinesen (2012) find that losing a job (in Denmark) increases the risk of dying in the year by 76% and the risk of being hospitalized in one year by 5%. Reducing the duration of job loss on the other hand, can have a positive impact on mental health. In addition, shortening the duration of job loss and improving incomes can have spin-off benefits that improve the psychological and social impacts on partners and families (Mendolia, 2014).
Health care expenditures are notably higher within lower income groups compared to higher income groups (CIHI, 2013). The Public Health Agency of Canada (2016) finds that Canadians in the lowest income group account for 60% ($3.7 billion) of the total direct economic burden. This distribution also informs the influence of socio-economic health inequalities on expenditures within the health care system. In particular, it informs the estimated reduction in health care costs that could be incurred if all Canadians had the same health care utilization and cost patterns as those in the highest income quintile. A recent study by Feed Ontario (2019) estimates that health expenditures could potentially decrease by $3.9 billion annually by moving the lowest income quintile population to the 2nd lowest quintile. Bushnik et al. (2020) showed that life expectancy at age 25 was 7.7 (5.4) years higher for men (women) in the highest vs. the lowest income quintile. With respect to health-adjusted life expectancy (in other words, expected years of life "in full health"), these disparities climbed to 12.2 for men and 10.1 for women. Mortality and morbidity could therefore potentially be reduced by moving people from lower to higher income levels, but such gains will only materialize if changes in income actually cause changes in health.
Participating in labour market training programs and finding employment can potentially improve the health status of participants and reduce their health care utilization. Because socioeconomic disadvantages (for example, unemployment, lower income) are linked to poorer health outcomes, it is reasonable to assume that labour market programs that help to enhance the likelihood of obtaining employment can improve the health status of participants. Puig-Barrachina, et al. (2020) reviewed some of the studies on the impact of labour market programs on health in high income countries. Their findings suggest that labour market programs have a positive impact on health and quality of life. Vinokur et al. 2000 argue that those who find a job as a result of a training program (in the US) benefit from a dramatic reduction of their depressive symptoms. Vuori and Versalainen (1999) use a quasi-experimental approach to explore the health benefit of Labour Market Programs for participants. Their findings suggest that compared to a control group (in other words, similar individuals who did not go through any labour market program), labour market programs participants have better health outcomes.
Incorporating public health care spending in the accounting framework of cost-benefit analysis
A typical cost-benefit analysis evaluates the effectiveness of a labour market program by comparing the economic costs and longer-term benefits arising from interventions over a 5-year or 10-year horizon after program participation. Costs and benefits are assessed from both the participant and the government perspective and then combined to see the ultimate impact of government investment in labour market programs on society as a whole. Annex A provides more details on the types of costs and benefits and the indicators used in a typical cost-benefit analysis.
An important aspect of the cost-benefit analysis is the determination of who bears a particular cost or receives a benefit. For instance, a gain from the government's perspective can be a cost from an individual's perspective. In particular, a decrease in EI benefits received is viewed as a reduction in income for the participant, but it can be viewed as a savings from the government's perspective. Table 1 and 2 show the different components of costs and benefits from all three perspectives (in other words, individual, government and society). The societal perspective shows the net effect from the individual and the government perspectives. For a given factor, a net gain to society occurs only when a gain to one entity does not occur at the expense of another. For example, increased earnings represent a benefit for participants but neither a benefit nor a cost to the government. Thus, the net result is a gain for society. A cost to society occurs when a factor is a cost from one perspective but neither a benefit nor a cost from the other perspective. For example, program costs represent a cost to the government, but not to participants; thus they are considered as a cost to the society. Factors that constitute a net gain from one perspective but a net loss from the other perspective are equal to zero from the societal perspective. For example, EI reductions may represent a cost to participants and a benefit to the government, and are neither a cost nor a benefit for the society.
A large portionFootnote 2 (except for dental, eye care and prescription drug) of health care is publicly funded in Canada. As a result, when there is a decline in health care utilization due to better physical and mental health among labour market programs participants, the benefit accrues to the government because of the reduction in public health care costs. Therefore, health care cost savings are considered a benefit to the government but neither a benefit nor a cost to the participant. As a result, the society will have a net gain.
Table 1 provides the different components of cost associated with the labour market program from the perspectives of the individual, government, and society.
| Costs factors | Individual | Government | Society | Estimation methods |
|---|---|---|---|---|
| Program cost | 0 | n/a | n/a | Cost estimates based on program expenditure data |
| Foregone earnings | n/a | 0 | n/a | In-program net impacts on earnings |
| Marginal social cost of public funds | 0 | n/a | n/a | 20% of program costs minus sales taxes minus income taxes minus EI minus social assistance |
Table 2 presents the different components of benefits associated with the labour market program from the perspectives of the individual, government, and society. The public health care cost savings is incorporated as a new component under the benefits of the labour market program.
| Benefits factors | Individual | Government | Society | Estimation methods |
|---|---|---|---|---|
| Employment earnings | + | 0 | + | Net impacts |
| Fringe benefits | + | 0 | + | Estimates are measured by 15.09 % of employment earnings |
| Federal and provincial income taxes | - | + | 0 | Estimates based on earnings and federal and provincial income tax rate |
| Federal and provincial sale taxes | - | + | 0 | Net impacts on earnings multiplied by the propensity to consume (95.6%), the proportion of household spending on taxable goods and services (51%) and by the total average federal and provincial sales tax rate (12%) |
| EI | -/+ | +/- | 0 | Net impacts |
| Social assistance | -/+ | +/- | 0 | Net impacts |
| CPP and QPP contribution | -/+ | +/- | 0 | Net impacts |
| EI premiums | -/+ | +/- | 0 | Net impacts |
| Public health care costs savings | 0 | + | + | Net impacts |
Data and methodology
4.1 Data
One of the challenges of this study is obtaining reliable data on the public health care costs of labour market programs participants. Ideally, the change in health care costs due to labour market program participation must be estimated using individual level data on both the income and health care utilization of participants and members of the comparison group. However, the disaggregated data on health care utilization of labour market program participants are currently not available. Therefore, this cost-benefit analysis study proposes an innovative approach using secondary data on the distribution of public health care costs by income quintiles to impute the individual health care costs. It is very challenging to find reliable sources of data on the distribution of health care costs by income level, because administrative datasets that include information on health care costs do not have information on individual income. Lifetime Distributional Effects of Publicly Financed Health Care in Canada (2013) report by the Canadian Institute for health Information (CIHI) is one of the rare sources of Canadian data on the distribution of health care costs by income. This report provides the average public health care costs by income quintiles by linking administrative data on health with survey data on income. The total public health care cost is calculated from the government spending for hospitals, physicians and drugs.
The CIHI (2013) report provides average annualized health care costs under three different approaches as shown in Table 3 to demonstrate the importance of considering age when assessing public health care costs. The three approaches are: (1) cross-sectional (2) lifetime with equal life expectancy and (3) lifetime with unequal life expectancy. The cross-sectional approach uses data on public health care costs for a single year, while the other 2 approaches consider the life course of the individual and can capture the variation in health care utilization across age groups.
One of the main limitations of the cross-sectional approach is that it fails to account for the differences in health care costs across different age groups. There are important variations in health care use over the life course. Health care costs increase substantially with age because individuals tend to receive more health care services when they are older. On the other hand, middle-aged people have higher income compared to younger and older people. As a result, simply using a distribution of health care costs by income from cross sectional data would fail to account for differences in health care costs due to aging. The interactions among income, health and age suggest that average health care expenditures are more evenly distributed among different income groups when they are measured over the lifetime than when they are measured for a single year. Therefore, life course approaches are more robust compared to the cross-sectional approach.
The main distinction between the 2 life course approaches used in the CIHI (2013) report is that the lifetime with unequal life expectancy approach takes the differences in mortality by income groups into account whereas the lifetime with equal life expectancy approach does not. For instance, people in lower-income groups have shorter averageFootnote 3 life expectancies than those in higher-income groups and therefore experience relatively lower health care costs associated with their shorter life expectancy. As a result of their longer life expectancy, individuals with higher income cost relatively more to the health care system over their lifetime. In the baseline model of this study, we use average health care costs based on the lifetime with unequal life expectancy approach as it provides estimates of public health care costs that consider the differing life expectancy of low and high-income groups.
| Quintiles | Lower bound ($) | Upper bound ($) | Average income within each income quintile ($) | AHCC under cross section 2011 ($) | AHCC under cross section 2011 (% change) | AHCC under lifetime (Equal life expectancy) ($) | AHCC under lifetime (Equal life expectancy) (% change) | AHCC under lifetime (Unequal life expectancy) ($) | Lifetime (Unequal life expectancy) (% change) |
|---|---|---|---|---|---|---|---|---|---|
| Q1 | 0 | 24,040 | 17,500 | 3860 | n/a | 4580 | n/a | 4220 | n/a |
| Q2 | 24,041 | 36,920 | 31,400 | 3320 | -14.0 | 4020 | -12.2 | 3820 | -9.5 |
| Q3 | 36,921 | 51,024 | 43,900 | 2880 | -13.3 | 3760 | -6.5 | 3650 | -4.5 |
| Q4 | 51,025 | 71,756 | 60,100 | 2710 | -5.9 | 3720 | -1.1 | 3650 | 0.0 |
| Q5 | 71,757 | 114,900 | 2410 | -11.1 | 3350 | -9.9 | 3350 | -8.2 | |
| Ratio Q1/Q5 | n/a | n/a | n/a | 1.6 | n/a | 1.37 | n/a | 1.26 | n/a |
Source: Lifetime Distributional Effects of Publicly Financed Health Care in Canada (2013)
Table 3 shows that health care costs are higher for low-income groups. However, the differences in health care cost across different income quintiles become less pronounced when they are estimated over the life course instead of in a single year. For example, changes in health care cost across income quintiles are smaller under lifetime approaches, especially under the lifetime with unequal life expectancy approach. Also, the difference between the top and bottom income groups (shown by the ratio of health care costs of Q1 and Q5) is the lowest under the lifetime with unequal life expectancy approach.
This study uses the data from labour market program data platform of Employment and Social Development Canada on the socio-demographic characteristics and labour market indicators of all active claimants who started a Skills Development intervention under the Labour Market Development Agreements between January 1st, 2010 and December 31st, 2012. The Labour Market Development Agreements are bilateral agreements between the Government of Canada and each of the thirteen provinces and territories. Under the Labour Market Development Agreements, the federal government provides $2.4 billion annually to provinces and territories to design, deliver and manage skills and employment programs which are mainly targeted to unemployed Canadians who are eligible for EI. The objective of these programs and services is to assist individuals to obtain or keep employment. One of the important types of interventions under Labour Market Development Agreements are Skills Development interventions. Skills Development provides direct financial assistance to individuals to select, arrange, and pay for training. Training is tailored to the needs of participants through counselling and career orientation. It can include adult-based education, literacy and essential skills, language training, short-term training and occupational training leading to certification from an accredited institution. Training duration averaged close to a year (between 46 and 48 weeks).
4.2 Methodology
The main goal of this study is to estimate the change in public health care cost when a participant experiences an increase in employment income after participating in labour market program, relative to non-participants with similar characteristics. A simplistic approach for estimating this reduction in health care costs would be to use data on Annualized Health Care Cost (AHCC) to check how health care costs are reduced when a participant moves from a lower quintile to a higher quintile after participation. However, the drawback of this approach is that one cannot estimate the reduction in health care costs for those participants whose income increased after participation and remained in the same quintile. For example, an individual's health care cost would be unchanged if the increase in earnings is not large enough to move the participant to a higher quintile after participation. To allow for variability in individual public health care costs within each income quintile, we propose a scaling factor for smoothing the health care cost within each income group. The formula of the scaling factor "s" is the following:

sJ,J+1 is the scaling factor for a participant whose income falls in between the average income of income quintile J and J+1. It estimates how the health care cost changes when the income of an individual changes by 1$.
Once we estimate the scaling factors, we can define the annual public health care cost of a participant by constructing the indicator Adjusted Annualized Health Care Cost (AAHCC) using the following formula:

Where, AHCCJ is the annualized lifetime (unequal life expectancy) health care costs per person in income quintile J. Yi is the employment income of participant i whose income is between average incomes of adjacent quintiles i.e., YJ≤Yi≤YJ+1 , where YJ is the average income of quintile J and YJ+1 is the average income of quintile J+1. Therefore, the formula of scaling factor sJ,J+1 can be written as the following:

To estimate the Adjusted Annualized Health Care Cost for each participant, first we need to derive the scaling factor. The scaling factors are calculated using average incomes and average health care costs for different quintiles. Table 4 provides the scaling factors for different income groups under the three different health care cost estimation approaches. In the baseline model, we use the scaling factors estimated using the average health care costs from the lifetime with unequal life expectancy approach. The interpretation of a scaling factor for a given income range is that it shows how much the health care cost decreases when a participant earns one additional dollar of income. For example, under the lifetime unequal life expectancy approach for the income range of $17,500≤Y≤ $31,400 the scaling factor is s1,2 =-0.0288 . This implies that any participant within this income group reduces the public health care cost by 0.0288 dollars when there is a dollar increase in income. However, the scaling factor for the income range $43,901≤ Y≤ $60,100 is zero because there is no variability in health care cost between the participants in the third and fourth income quintiles. Moreover, the proposed scaling factor cannot be derived for the lowest (Y < $17,500) and the highest (Y > $114,900) income groups. This implies that there will be no variation in participants' health care costs who are within these income groups.
| Income range | Cross section 2011 | Lifetime (Equal life expectancy) | Lifetime (Unequal life expectancy) |
|---|---|---|---|
| Y < $17,500 | n/a | n/a | n/a |
| $17,500≤ Y≤ $31,400 | s1,2=-0.0388 | s1,2=-0.040 3 | s1,2=-0.0288 |
| $31,401≤ Y≤ $43,900 | s2,3=-0.0352 | s2,3=-0.0208 | s2,3=-0.0136 |
| $43,901≤ Y≤ $60,100 | s3,4=-0.0105 | s3,4=-0.0025 | s3,4=0 |
| $60,101≤ Y≤ $114,900 | s4,5=-0.0055 | s4,5=-0.0068 | s4,5=-0.0055 |
| Y > $114,900 | n/a | n/a | n/a |
Source: Lifetime Distributional Effects of Publicly Financed Health Care in Canada (2013)
Using the values for AHCCJ (Table 3) and scaling factors "sJ,J+1 " (Table 4) under the lifetime unequal life expectancy approach in formula (2), we calculate the Adjusted Annualized Health Care Cost for participants in different income groups as the following:
- AAHCCi = $4,220
- = $4,220 + (Yi -$17,500) (-0.0288)
- = $3,820+ (Yi -$31,400) (-0.0136)
- = $3,650 + (Yi -$43,900) (0)
- = $3,650 + (Yi -$60,100) (-0.0055)
- = $3,350
- If Yi < $17,500
- If $17,500 ≤ Yi ≤ $31,400
- If $31,401 ≤ Yi ≤ $43,900
- If $43,901≤ Yi ≤ $60,100
- If $60,101≤ Yi ≤ $114,900
- If Yi > $114,900
The figure 1 shows the graphical representation of Adjusted Annualized Health Care Cost. In general, Adjusted Annualized Health Care Cost decreases with income.

Source: Lifetime Distributional Effects of Publicly Financed Health Care in Canada (2013)
Figure 1 - Text version
| Income quintile | Adjusted Annualized Health Care Cost | Income |
|---|---|---|
| First | $4,220 | $17,500 |
| Second | $3,820 | $31,400 |
| Third | $3,650 | $43,900 |
| Fourth | $3,650 | $60,100 |
| Fifth | $3,350 | $114,900 |
For example, consider a participant who has an annual income of $20,000. This person falls under the second income group with income ranging between $17,500≤ Y_i≤ $31,400. As this participant’s income is higher than $17,500 (average income of first quintile), the health care cost is estimated to be lower than a participant having an income of $17,500. To estimate by how much the health care cost would decrease compared to a participant earning $17,500, we use the scaling factor for the $17,500≤ Y_i≤ $31,400 income group, which is -0.0288. This participant’s health care cost would be $72Footnote 4 less compared to the participant earning $17,500. Therefore, the Adjusted Annualized Health Care Cost of a participant with an annual earning of $17,500 would be $4,220, while the Adjusted Annualized Health Care Cost of a participant with an annual earning of $20,000 would be $4,148.Footnote 5
Once we impute Adjusted Annualized Health Care Cost for all participants and comparison group members, we include this variable as an outcome variable along with other socio demographic and labour market characteristics in the net impact analysis. The procedure for estimating net impacts is based on a quasi-experimental approach that measures the effectiveness of the program by comparing the actual outcomes for the participants to outcomes of a group of non-participants with similar characteristics (that is, the outcomes they would have experienced in the absence of an intervention). This report uses propensity score matching combined with the Difference-in-Differences method to estimate the net impact of Skills Development interventions on public heath care cost. Annex B presents the detailed methodology on the estimating net impact analysis.
Key findings
5.1 Net impact results
This study proposes a novel methodology to incorporate the health care spending in the cost-benefit analysis. We implement this proposed methodology on all the active EI claimants under the 3rd cycle of the Labour Market Development Agreements, who started a Skills Development intervention between January 1st, 2010 and December 31st, 2012. We first calculate Adjusted Annualized Health Care Cost for all participants and comparison group members of the Skills Development intervention under Labour Market Development Agreements for a 5-year pre-participation period and a 4-year post-participation period. Then we include the Adjusted Annualized Health Care Cost as an outcome variable along with other socio demographic and labour market characteristics in the net impact analysis. Finally, propensity score matching combined with the Difference-in-Differences method is used to estimate the net impact of Skills Development interventions on public heath care costs.
On average, an active claimant in a Skills Development intervention experiences a decrease in public health care cost of $29 per year over a 4-year post-participation period. During the program participation period, there is an increase in health care cost for the Skills Development participants because they experienced a decrease in income due to lock-in effectFootnote 6, which shows the opportunity costs of participating into a training program.
| Indicator | In program 1st year | In program 2nd year | 1-year post program | 2-year post program | 3-year post program | 4-year post program | Annual post-program average |
|---|---|---|---|---|---|---|---|
| Public health care cost per capita ($) | 63table 5 note *** | 60table 5 note *** | -2 | -32table 5 note *** | -41table 5 note *** | -42table 5 note *** | -29table 5 note *** |
Source: Labour Market Program Data Platform of Employment and Social Development Canada, and Lifetime Distributional Effects of Publicly Financed Health Care in Canada (2013)
Table 5 Notes
- Table 5 Note
-
Note: Significance level: ***1%, **5%, *10%
5.2 Savings on public health care costs
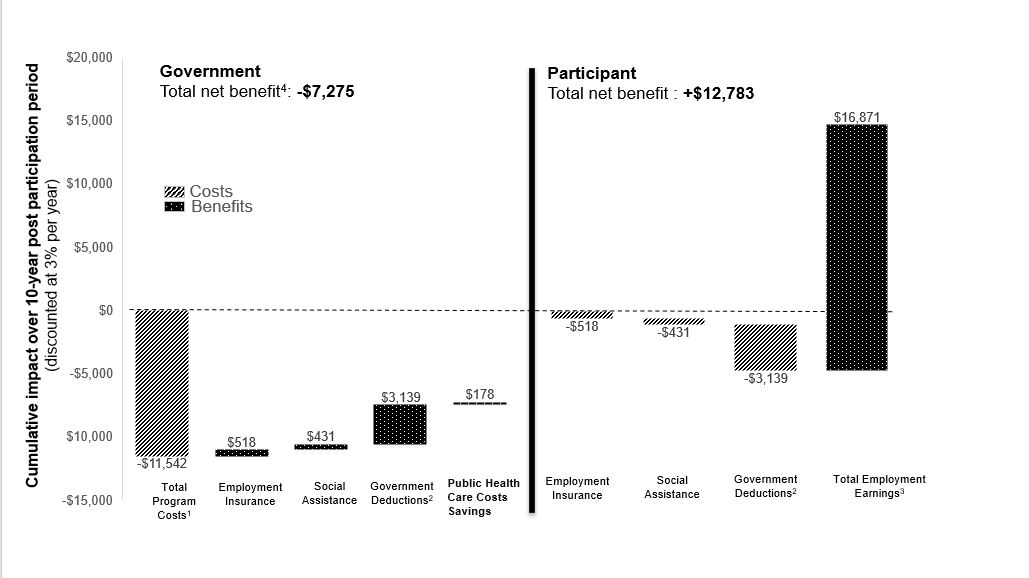
This study uses 3% discount rate to derive the total discounted savings in the public health care expenditure of the government during the post participation period. The total discounted benefit to Government from the reduction in public health care cost is $178 per participant over a 12-year periodFootnote 8. The figure 1 demonstrates how the public health care costs savings is incorporated as an indirect benefit to the government.
The total program costs include the program direct cost and the indirect cost due to the distortionary tax to finance the program, which defined as MSCPF. Government deductions include EI premiums, CPP/QPP contributions, income and sales taxes. Total employment earnings of the participant includes employment earnings, fringe benefits and forgone earnings.
The total net benefit for the participant is $12783 and the total net cost for the government is $7275 over a 12-year period. This translates into a social net benefit (combining government and participant perspectives) of $5508 or a social rate of returnFootnote 9 of 54%.
- Source: Labour Market Program Data Platform of Employment and Social Development Canada, and Lifetime Distributional Effects of Publicly Financed Health Care in Canada (2013)
- Note:
- 1. Total program costs include the program direct cost, estimated at $10,193, and the loss incurred by society when raising additional revenues, such as taxes to fund government spending, estimated at $1,349.
- 2. Government deductions include EI premiums, CPP/QPP contributions, and income and sale tax paid.
- 3. Total Employment Earnings includes employment earnings, fringe benefits and earnings lost due to time spent in the program.
- 4. The estimated net benefits of government is rounded by default.
Figure 2 - Text version
Net present value for government
| Components analysis | Government |
|---|---|
| Total program costs ($) | -$11,542 |
| Employment Insurance ($) | $518 |
| Social assistance ($) | $431 |
| Government deductions ($) | $3,139 |
| Public health care cost savings | $178 |
| Net present value ($) | -$7,275 |
Net present value for participant
| Components analysis | Participant |
|---|---|
| Employment Insurance ($) | -$518 |
| Social assistance ($) | -$431 |
| Government deductions ($) | -$3,139 |
| Employment earnings ($) | $16,871 |
| Net present value ($) | $12,783 |
Robustness check
6.1 Alternative model specification
One of the limitations of using average public health care costs from CIHI (2013) is the lack of variability in health care cost for some income groups. Specially, there is no variation in health care cost for individuals who have income below the average income of the lowest quintile (Y < $17,500) and above the average income of the highest quintile (Y > $114,900) because the scaling factor cannot be derived for these income groups. Adding more variation in these income groups can potentially increase health care cost savings. One way to add more variation in health care cost within these income groups is to assume the same scaling factor of the adjacent income groups. For example, to add more variation in health care cost for people whose income is below average income of the lowest quintile, we can apply the scaling factor of the adjacent income group s1,2 . On the other hand, we can apply the scaling factor s4,5 for those whose income is above average income of the highest quintile.
| Public health care cost per capita ($) | In program 1st year | In program 2nd year | 1-year post program | 2-year post program | 3-year post program | 4-year post program | Annual post-program average |
|---|---|---|---|---|---|---|---|
| Baseline model | 63table 6 note *** | 60table 6 note *** | -02 | -32table 6 note *** | -41table 6 note *** | -42table 6 note *** | -29table 6 note *** |
| Alternative model specification | 146table 6 note *** | 135table 6 note *** | -7table 6 note ** | -57table 6 note *** | -71table 6 note *** | -72table 6 note *** | -52table 6 note *** |
| Alternative public health care cost data | 89table 6 note *** | 86table 6 note *** | -2 | -46table 6 note *** | -60table 6 note *** | -61table 6 note *** | -42table 6 note *** |
Source: Labour Market Program Data Platform of Employment and Social Development Canada, and Lifetime Distributional Effects of Publicly Financed Health Care in Canada (2013)
Table 6 Notes
- Table 6 Note
-
Note: Significance level: ***1%, **5%, *10%
Under this alternative model specification, a Skills Development participant reduces public health care costs on average by $52 per year over a 4-year post-participation period. The total discounted benefit to government from the reduction in public health care cost is $241 per participant over the 12 year period, which is higher compared to the baseline findings.
6.2 Alternative data on average health care cost
The baseline model uses the average health care cost from the lifetime with unequal life expectancy approach from the CIHI (2013) report. Under this approach there is no variation in health care costs for people whose income falls in the Q3 and Q4 income quintiles. Using the other approaches such as the lifetime with equal life expectancy approach can provide variation in health care costs in all income quintiles. However, this approach assumes that both high and low income groups have the same life expectancy which is not the case in reality.
As a robustness check, we estimate the net impact of Skills Development intervention on public heath care costs using the health care costs from the lifetime with equal life expectancy approach. Under this alternative data on public health care cost, a Skills Development participant experiences a decrease in public health care costs on average by $42 per year over a 4-year post-participation period. The total discounted benefit of government from the reduction in public health care costs is $260 per participant over the 12 year period, which is higher compared to the baseline findings.
The key findings from robustness tests suggest that adding more variability in health care costs across different income groups leads to an increase in the magnitude of the change in health care cost incurred by the Government. Therefore, we can conclude that the findings on the health care cost savings from the baseline model of this study are conservative.
Limitations
This study has the following limitations:
- the findings of this study on health care cost savings are only an approximation, given that we used aggregate level data on public health care costs from the CIHI (2013) report to impute the individual level health care costs due to the unavailability of the individual level data on health care utilization
- we cannot take into account the variation in health care cost for individuals who have an income below the average income of the lowest quintile or above the average income of highest quintile because the scaling factor cannot be derived for these income ranges
- the analysis is limited to public health care expenditures, which represents about 70% of total health spending
Conclusion
The cost-benefit analysis compares the costs incurred by the government in delivering the program with the longer-term direct benefits (for example, increases in employment earnings, increased tax revenues, decreases in social assistance use) associated with program participation. Even though a typical cost-benefit analysis mainly focuses on the direct and quantifiable impacts of labour market programs, indirect impacts such as better health outcomes of participants after program participation are also important to society. This study attempts to incorporate the health benefits in the cost-benefit analysis by estimating the change in per capita public health care cost due to the change in health care utilization resulting from program participation.
Using secondary data on average health care cost across income quintiles from a study conducted by CIHI (2013), this study finds that public health care cost decreases by $29 per year over a 4-year post-participation period for an active Skills Development participant under the Labour Market Development Agreements. The total discounted benefit to government from the reduction in public health care cost is $178 per participant over a 12-year period. The findings of this study are robust under alternative data and model specification.
This study is a part of an ongoing effort to improve the methodology of the current cost-benefit analysis in labour market program evaluation. There are some important implications of the findings of this study. First, the findings suggest that the estimated health benefit from participating in the labour market programs is not negligible. Secondly, the estimated health care cost savings from the baseline model of this study is conservative. Using alternative data on average health care cost or different model specification can lead to a higher variation in the estimated change in public health care cost. Finally, the model used in this study, which includes savings to public health care costs in the cost benefit analysis, will be considered for future evaluations of labour market programs.
References
Allin, S., Corscadden, L., Gapanenko, K., & Grignon, M. (2013). Lifetime Distributional Effects of Publicly Financed Health Care in Canada
Bjerk, D. (2004). Youth criminal participation and household economic status (No. 2004-10).
Browning, M., & Heinesen, E. (2012). Effect of job loss due to plant closure on mortality and hospitalization. Journal of health economics, 31(4), 599 to 616.
Bushnik, T., Tjepkema, M., & Martel, L. (2020). Socioeconomic disparities in life and health expectancy among the household population in Canada. Health Rep, 31(1), 3 to 14.
Butler-Jones, D. (2008). Report on the state of public health in Canada 2008: Addressing health inequalities. Ottawa: Public Health Agency of Canada.
HECKMAN, J. J. AND J. A. SMITH (1999): "The Pre-Program Earnings Dip and the Determinants of Participation in a Social Program: Implications for Simple Program Evaluation Strategies," Economic Journal, 109(457), 313 to 348.
Lee, C. R., & Briggs, A. (2019). The Cost of Poverty in Ontario.
Lochner, L. (1999). Education, work, and crime: Theory and evidence. Rochester center for economic research working paper, (465).
Mendolia, S. (2014). The impact of husband's job loss on partners' mental health. Review of Economics of the Household, 12(2), 277 to 294.
Public Health Agency of Canada. (2016). The direct economic burden of socio-economic health inequalities in Canada.
Puig-Barrachina, V., Giró, P., Artazcoz, L., Bartoll, X., Cortés-Franch, I., Fernández, A., & Borrell, C. (2020). The impact of active labour market policies on health outcomes: a scoping review. European journal of public health, 30(1), 36 to 42.
Raaum, O., Torp, H., & Zhang, T. (2002). Do individual programme effects exceed the costs? Norwegian evidence on long run effects of labour market training (No. 2002, 15). Memorandum.
Vinokur, A. D., Schul, Y., Vuori, J., & Price, R. H. (2000). Two years after a job loss: long-term impact of the JOBS program on reemployment and mental health. Journal of occupational health psychology, 5(1), 32.
Vuori, J., & Vesalainen, J. (1999). Labour market interventions as predictors of re‐employment, job seeking activity and psychological distress among the unemployed. Journal of Occupational and Organizational Psychology, 72(4), 523 to 538.
Annex A: Cost-benefit analysis
Cost-benefit analysis is an essential component of any evaluation study of labour market program. It compares the costs and benefits from the perspective of the individual (that is, the participant) and the Government. When combined, these estimate the ultimate impact on society. The cost and benefits from these 3 perspectives can be characterized as the following:
- government: Costs for government are incurred upfront and consist of program costs. On the other hand, benefits accrue over time in the form of increased taxed revenues and decreased outlays from support programs (for example, social assistance)
- individual: Benefits accrue over time for individuals and take the form of higher earnings which may contribute to improved social outcomes. Costs of participating in the labour market program for an individual includes foregone earnings during the participation period
- society: The total net benefits of the Government and individual show the net benefit of the society from labour market programs
The following subsections discuss the types of costs and benefits considered in this study, the indicators used for a cost-benefit analysis, assumptions about the parameters, indirect and intangible benefits from program participation, and the accounting framework of cost-benefit analysis.
A1. Definition of costs
The 3 types of costs taken into account in the cost-benefit analysis calculation include:
- Program costs: Program costs are the costs of the Government to deliver the program, including administration costs and the direct costs of programs and services provided to participants (for example, direct program costs)
- Foregone earnings : These are the estimated net impacts on participants' earnings during the participation period. During labour market program participation, some individuals have lower earnings than what they would have received if they had not participated. For example, participants under the Skills Development intervention are in training and unable to work full-time. Therefore, they experience a loss in earnings while participating in the program
- Marginal Social Cost of Public Funds (MSCPF): This represents the loss incurred by society when raising additional revenues such as taxes to fund government spending. The MSCPF represents 20% of the program costs minus all changes in the government's revenues and changes in the government's expenses during the post participation period. In order words, the calculation for MSCPF is as follows:
- (Program costs - impacts on sales taxes - impacts on income taxes - impacts on EI - impacts on SA) * 20%.
A2. Definition of benefits
The following benefits are typically included in the cost-benefit analysis:
- Employment earnings: It shows the net impacts on participants' earnings after program participation. CRA and EI databases are used to derive the total employment earnings
- Fringe benefits: This includes employer-paid health and life insurance as well as pension contributions. The average treatment effect on fringe benefits is equal to a proportion of the average treatment effect on employment income. The net impact on fringe benefits is defined as:
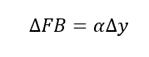
Where:
- ∆FB is the average treatment effect on fringe benefits
- ∆y is the average treatment effect on employment income
- α is a parameter which represents the share of fringe benefit in employment earnings
- the parameter α will be fixed at 0.15 in the planned cost-benefit analysis study
- Income taxes: The variation in earnings affects the amount of federal and provincial income taxes paid by participants. Total federal and provincial income taxes paid by the participants are derived from the CRA tax files
- Sales taxes: Sales taxes are estimated as the sum of the federal sales taxes rate and the average of provincial sales taxes rate. The national average of the provincial tax rates between 2012 and 2017 was 7% while the average federal tax rate was 5%. The national average of propensity to consume between 2010 and 2017 was 0.956. An increase in employment earnings affects sales taxes paid by the participants as they gain additional purchasing power
The sales tax is equal to the tax paid by the participant when they use a part of their income to purchase taxable consumer goods. The impact on sales taxes paid is estimated using the following formula:

Where:
- ∆STP is the incremental impact on sale taxes
- ∆Y is the incremental impact on employment net earnings
- tp is the average of provincial sales taxes rate
- tf is the federal sales taxes rate
- PMS is the national average of propensity to save between 2010 and 2017, which is 0.044
- λ is the part of taxable goods and services in the total consumption. It is estimated at 51% in 2017
- Employment Insurance (EI) and Social Assistance (SA): Since the main objective of labour market programs is to help individuals return to employment, it is expected that participants would reduce their use of SA and EI following participation. Therefore, a decline in EI or SA benefit due to program participation represents a decline in cost of government in delivering income support program. The information on EI and SA usage are extracted from CRA tax files
- CPP/QPP Contribution and EI Premium : An increase in earnings affect the premiums paid by the participants for transfer programs (in other words, EI, CPP and QPP). The CPP and QPP contribution and EI premiums are obtained from the CRA tax files
A3. Cost-benefit indicators
- Net Present Value (NPV): Following the dominant approach in the literature (Heckman, al., (1997), Raaum et al., (2002)), the analysis determines the NPV (PVreturn) by subtracting the program costs (PVcosts) from the discounted benefits (PVbenefits).

Where PVbenefits denotes the present value of the benefits and PVcosts denotes the present value of the costs.
Or more precisely, PVreturn is equal to PVbenefits which can be expressed as the discounted sum of benefits less PVcosts which can be expressed as the discounted sum of costs.

Where Bt and Ct are the benefits and costs in year t , r is the discount rate of return and T is the time period (number of years) considered in the analysis.
- Benefits-cost ratio: It shows whether the amount of benefits generated from the program outweigh the program costs. The benefit-cost ratio is measured by dividing the sum of discounted benefits by the program cost
- Payback period: It estimates the amount of time required for the discounted benefits to equal costs
- Social rate of return: It is the ratio between the discounted net benefit to the society and direct program cost to the government. In other words, it shows the dollar value of the discounted net benefit to the society when the government spends 1 dollar in a program. Following the prevailing approach in the evaluation literature (refer to Heckman et al. (1999), the net social benefit was measured by subtracting the costs of the program from their discounted social benefit streams
A4. Assumptions about the parameters
Discount rate (that is used to derive net present value of benefits and costs) and MSCPF are the 2 key parameters in the cost-benefit analysis. The cost-benefit analysis assumes a discount rate of 3% and MSCPF of 20%.
Annex B: Net impact analysis
B1. Implementation of the matching estimator combined with Difference-in-Differences method
We used quasi-experimental propensity-score based weighting approach to measure the program impacts. This approach aims to ensure that the participants and comparison group are balanced in terms of background factors (that is, sociodemographic and labour market history variables) prior to estimating the program impacts. We applied the Kernel matching technique, which uses the entire control group and re-weights control group members each time they are compared with a new participant, based on propensity-score differentials. We used Inverse Probability Weighting (IPW) and Nearest Neighbour matching as alternative methods to validate the results. Note that these methods were combined with Difference-in-Differences (DID) estimation of program impacts. The DID method allows for the participants and comparison groups to differ on time-invariant unobserved characteristics, by assuming common time trends in the pre- and post-participation period in these characteristics. Figure 1 and 2 provide illustrations of matching and DID method.

Figure 3 - Text version
This figure illustrates a simple example of the matching method. A quasi-experimental propensity-score based weighting approach is used to measure the program impacts. This approach aims to ensure that the participants and comparison group are balanced in terms of background factors (that is, sociodemographic and labour market history variables) prior to estimating the program impacts. We applied the kernel matching technique, which uses the entire control group and re-weights control group members each time they are compared with a new participant, based on propensity-score differentials.

Note: For example, employment insurance claimants who participated in the program earn on average $8,000 more than they did at the start of the program, compared to an increase on average of $5,000 earned by similar individuals in the program. The net impact of the program would be an increase of $3,000 on average.
Figure 4 - Text version
This figure illustrates a simple example of difference-in-difference method. Suppose, employment insurance claimants who participated in the program earn on average $8,000 more than they did at the start of the program, compared to an increase on average of $5,000 earned by similar individuals in the program. The net impact of the program would be an increase of $3,000 on average.
A brief description of the Propensity score model and the Difference-in-Differences method is provided below.
B2. Propensity score model
This report uses the logit regression model to estimate propensity scores. The propensity score is the conditional probability of participating in the program given the pre-participation variables. Propensity-score matching uses the distance between estimated propensity scores to find similar individuals. The participants are pooled with potential comparison cases, and logistic models are estimated to predict the likelihood of participating in the program based on the background characteristics of the participants and the comparison group members. The data used for the model cover a large number of characteristics reflecting the labour market experiences and socio-demographic characteristics of participants and comparison cases. These characteristics include age, gender, marital status, and disability status. For both groups, the data include information on their economic region and province and qualifications (for example, occupational group, skill levels related to the last job before opening their EI claim, industry codes). Finally, the data also include labour market history (including EI benefits, the incidence of employment, and employment earnings) in the 5 years preceding participation.
B3. Difference-in-Differences
DID is one of the most popular methods to assess the causal effect on key outcome indicators of participating in an intervention or program. The DID method is used when outcome variables for participants and the comparison group are observed for 2 or more time periods (that is, before and after an intervention). The DID method requires that, in the absence of the intervention, the expected difference in outcome indicators between the participants and the comparison group is constant over time. This refers to a common trend assumption or constant bias assumption (Lechner, 2010). It is conventionally measured by comparing the observable trends in the pre-intervention period.
In order to use propensity score matching combined with Difference-in-Differences methods, this report applies 3 identifying assumptions, which are briefly explained below.
Conditional independence assumption
The conditional independence assumption requires that the common variables that affect participation assignment and intervention-specific outcomes be observable. An advantage of this analysis is that the available administrative data contains rich information about the type of disability for both participants and the comparison group. This allow for the inclusion of the most relevant variables influencing the decision to participate in the interventions and the labour market outcomes in the propensity-score model. In this context, this report assumes that the conditional independence assumption is satisfied.
Common support (overlap) assumption
This assumption ensures that persons with the same covariate values have a positive probability of being both participants and non-participants (Heckman, LaLonde, and Smith, 1999). In other words, each participant has one or more "counterparts" in the comparison group with the same covariate profile, such that appropriate counterfactuals can be constructed. The common support assumption can be verified empirically. The most straightforward way to do this is through a visual inspection of the density distribution of the propensity score in both groups.
Conditional bias stability assumption
The motivation for the conditional bias stability assumption comes from the concern that some relatively stable unobserved characteristics, such as ability, motivation, and/or attractiveness, may persistently affect labour market outcomes, but not fully capture conditioning on the available pre-program data. To satisfy this property, this analysis includes the pre-participation variables in the propensity score model.
This report uses the kernel matching algorithm to match participants and the comparison group with respect to their propensity scores. Kernel matching is a non-parametric technique that uses weighted averages of the outcomes of all individuals in the comparison group to construct the counterfactual. A major advantage of this approach is that it reduces the variance of the estimated effects.
Page details
- Date modified: