
Evaluation of the Canada Student Financial Assistance Program: Loan Repayment
On this page
- List of figures
- List of tables
- List of abbreviations
- Executive summary
- Management response and action plan
- Introduction
- Findings
- Conclusion
- Recommendations
- Appendices
- Appendix A: Logic model of the CSFA Program
- Appendix B: Measures introduced during the pandemic to help students and recent graduates
- Appendix C: Profile of borrowers not making payment (delinquent) on their CSL at the time of the survey (2023)
- Appendix D: Lines of evidence used in this evaluation
- Appendix E: Methodological limitations
- Appendix F: The calculation of a complementary measure of debt-to-income ratio (Ri), over the repayment period
- Appendix G: Supplemental Tables and Figures
- References
Alternate formats

[Evaluation of the Canada Student Financial Assistance Program: Loan Repayment] [PDF - 7,404 KB]
Large print, braille, MP3 (audio), e-text and DAISY formats are available on demand by ordering online or calling 1 800 O-Canada (1-800-622-6232). If you use a teletypewriter (TTY), call 1-800-926-9105.
List of figures
- Figure 1: A student loan lifecycle
- Figure 2: Direct loan portfolio at the end of the 2021-2022 loan year
- Figure 3: The rise of the average student loan balance (in nominal dollars)
- Figure 4: Share of borrowers entering repayment each year by debt level
- Figure 5: Distribution of borrowers by institution type and debt level, cohort 2007-2008 vs. 2020-2021
- Figure 6: Distribution of borrowers by level of study and debt level, cohort 2007-2008 vs. 2020-2021
- Figure 7: The cumulative percentage of borrowers who paid their debt in full each year, among cohorts 2007-2008 to 2020-2021
- Figure 8: The percentage of borrowers who defaulted each year, among cohorts 2007-2008 to 2020-2021
- Figure 9: Three-year default rates for direct loans (based on amounts), overall and by institution type
- Figure 10: Percentage of borrowers in default each year after entering repayment
- Figure 11: Distribution of survey respondents by repayment status (January to March 2023)
- Figure 12: Debt-to-income ratio of survey respondents
- Figure 13: Ratio of outstanding CSL debt to 2022 annual income at the time of survey by RAP enrollment
- Figure 14: Current monthly CSL payment relative to monthly household income in 2022 by RAP enrollment
- Figure 15: Current monthly total student loans payment relative to monthly household income in 2022
- Figure 16: Ratio of consolidated CSL debt amount to average annual family income over the repayment period, by key socio-demographic characteristics
- Figure 17: Reasons for not currently making payments
List of tables
List of abbreviations
- CERB
- Canada Emergency Response Benefit
- CESB
- Canada Emergency Student Benefit
- CRA
- Canada Revenue Agency
- CSFA Program
- Canada Student Financial Assistance Program
- CSG
- Canada Student Grant
- CSL
- Canada Student Loan
- CSLP
- Canada Student Loan Program
- GPA
- Grade Point Average
- NGS
- National Graduate Survey
- SPDB
- Severe Permanent Disability Benefit
- STEM
- Science, Technology, Engineering, and Mathematics
- RAP
- Repayment Assistance Plan
- ROT
- Revision of Terms
Executive summary
This report presents the results of the evaluation of the Canada Student Financial Assistance Program. Canada Student Financial Assistance Program was designed to meet the Department's commitments following the Auditor General of Canada's 2020 Report on Student Financial Assistance and the Standing Committee on Public Accounts' 2021 Report on Student Financial Assistance.
The objective of this evaluation is to use multiple lines of evidence to examine if borrowers were able to repay their federal student loans in Canada and the factors contributing to repayment challenges such as missed payments, defaults, and non-repayment.
The findings indicate an overall improvement in repayment outcomes from borrowers' perspectives. However, early evidence suggests that borrowers who recently started repaying still find it challenging to meet their obligations.
Government support, which includes the RAP, had a positive effect on repayment capacity. Additionally, the implementation of new assistance measures during the pandemic helped with repayment capacity and borrowers acknowledged it as beneficial in managing these challenges.
Key findings:
- the ability to repay student loans has improved as trends show a higher rate of full loan repayment and a lower default rate over time for borrower cohorts in repayment between 2007 to 2008, and 2020 to 2021; specifically by the end of the first year, 24% of borrowers who began repayment in 2020 to 2021 paid in full, compared to 19% of borrowers who began repayment in 2007 to 2008
- more than half (52%) of borrowers surveyed said that it was difficult to make payments, with certain demographic subgroups experiencing more difficulties than others
- since 53% of borrowers reported that they would not be able to make payments on their loans if the repayment moratorium was not in place, this indicates that temporary Government income support measures introduced in March 2020 effectively alleviated short-term repayment challenges
- early results of borrowers who started loan repayment during the pandemic (2019 to 2020) show a slightly higher percentage (29%) of borrowers who paid in full compared to previous cohorts after the second year of repayment
Recommendations:
- take additional steps to improve awareness of student financial assistance measures, including repayment assistance supports
- monitor recent changes to student loan repayment under the Canada Student Financial Assistance Program, such as enhancements to the Repayment Assistance Plan and the elimination of interest accrual on loans, and assess their impact on student loan borrowers and repayment over time, particularly concerning loans in delinquency or default
Management response and action plan
Overall management response
This management response addresses the recommendations of the Evaluation of the Canada Student Financial Assistance Program: Loan Repayment. It provides information about recent measures implemented by the Learning Branch and outlines plans for further action to respond to the evaluation findings and recommendations.
The evaluation indicates that the ability to repay student loans is stronger among recent cohorts in repayment. The Learning Branch views this finding as positive, and a testament to the actions undertaken in recent years to improve repayment. Nonetheless, the evaluation identified 2 recommendations where further work could be done. The Learning Branch accepts these recommendations, as outlined below.
Recommendation #1
Take additional steps to improve awareness of student financial assistance measures, including repayment assistance support.
Management response
The Learning Branch agrees with this recommendation.
Currently, the Learning Branch regularly engages with internal and external stakeholders, as well as provinces and territories, as part of broader awareness-building activities and information sharing on student financial assistance supports. Going forward, the Learning Branch will explore opportunities for targeted approaches to enhance the awareness of available student financial assistance supports, and to help improve financial literacy.
Within the Learning Branch, the Canada Student Financial Assistance Program undertakes several activities to increase awareness of Canada Student Grants and Canada Student Loans, as well as supports that may be available to those in repayment, such as the Repayment Assistance Plan. The Canada.ca website provides clear information on the support available, as well as information on how to apply, depending on one's province or territory of residence. In addition, from time to time, Employment and Social Development Canada runs various communications and social media campaigns to promote these supports.
Concerning the repayment of Canada Student Loans, targeted awareness strategies help to maintain the status of borrowers whose loans are in good standing, facilitate access to repayment assistance for those who need it, and help those who are delinquent bring their loans back into good standing. Through its third-party Service Provider, the Program communicates and promotes repayment options, including the Repayment Assistance Plan. Targeted communications also provide information to delinquent borrowers to help prevent them from defaulting on their loans.
The Program is also collaborating with the Financial Consumer Agency of Canada, provinces and territories, and other stakeholders to develop new tools and resources to improve the awareness of student financial assistance support. This includes developing an approach to test the impact of financial literacy training modules on applicants and borrowers entering repayment.
Going forward, the Canada Student Financial Assistance Program will continue to gather and analyze information on student loan borrowers and will explore opportunities to leverage findings from this analysis to develop targeted strategies to promote and enhance awareness of support.
Management action plan
Recommendation 1.1: The Learning Branch will explore opportunities for targeted approaches to enhance the awareness of available student financial assistance supports, and to help improve financial literacy.
Completion Date: March 2025
Recommendation 1.2: The Canada Student Financial Assistance Program will continue to gather and analyze information on student loan borrowers and will explore opportunities to leverage findings from this analysis to develop targeted strategies to promote and enhance awareness of supports.
Completion Date: September 2026
Recommendation #2
Monitor recent changes to student loan repayment under the Canada Student Financial Assistance Program, such as enhancements to the Repayment Assistance Plan and the elimination of interest accrual on loans and assess their impact on student loan borrowers and repayment over time, particularly with respect to loans in delinquency or default.
Management response
The Learning Branch agrees with this recommendation.
The evaluation indicates an overall improvement in repayment outcomes from a student loan borrower's perspective. However, the evaluation also suggests through early evidence that borrowers who recently started repaying still face challenges meeting their student loan obligations.
The Canada Student Financial Assistance Program provides several supports for those who face challenges in repaying their loans. Through the Repayment Assistance Plan, the Government assists eligible borrowers who cannot make their monthly loan payments. In November 2022, the Government implemented several enhancements to the Repayment Assistance Plan to help more borrowers in need. Key changes include increasing the income eligibility threshold for a single individual from $25,000 to $40,000, making commensurate increases to borrowers with families, and indexing the thresholds to inflation. In fact, as of August 2023, the threshold for a single borrower is now $42,720. In addition, monthly payments have been reduced from 20 % to 10 % of a borrower's family income for Repayment Assistance Plan recipients who are above the no-payment income thresholds.
In addition, as of April 1st, 2023, the Government has eliminated the accrual of interest on Canada Student Loans. This builds on a 2-year, temporary waiver of interest accrual, and represents a significant investment to reduce the burden of loan repayment on students, while providing predictability in the face of fluctuating interest rates.
Given that these significant changes have only recently been implemented, the Learning Branch's view is that time is needed to measure the impact of these changes on the repayment behaviour and outcomes of borrowers.
The Learning Branch assesses repayment trends on an ongoing basis as part of regular program management. The Canada Student Financial Assistance Program monitors key indicators, such as the percentage of loans repaid each year, the 3-year default rate, and uptake of the Repayment Assistance Plan. The Program also works with its third-party Service Provider to conduct detailed analysis by demographic groups, track repayment behavior and patterns, and review default rates. In addition, the Office of the Chief Actuary produces an annual Actuarial Report, which includes trends and forecasts on the amount of student loans issued, the utilization of the Repayment Assistance Plan, and information on defaulted loans. That report is also used to monitor trends in repayment for the Program.
In the short term, the Canada Student Financial Assistance Program will continue to monitor trends in repayment using these existing mechanisms and processes.
It is anticipated that, in 5 years' time, there will be sufficient data to draw evidence-based observations and conclusions about the impact of these investments. This is because default is measured retrospectively, and it takes 3 years to measure a single repayment cohort's default rate. The 5-year timeframe will allow the analysis of 3 consecutive repayment cohorts, which will account for the multiple factors that could influence default rates. Therefore, 5 years from now, the Canada Student Financial Assistance Program will conduct a more thorough analysis to assess the impact of recent program changes on repayment, including repayment length, delinquency, and default.
Management action plan
Recommendation 2.1: 5 years from now, the Canada Student Financial Assistance Program will conduct analysis to assess the impact of recent program changes on repayment, including repayment length, delinquency, and default.
Completion Date: March 2029
Introduction
The Canada Student Financial Assistance Program (CSFA Program) ensures that Canadians have access to affordable and accessible post-secondary education. Administered by the federal government in collaboration with provinces and territoriesFootnote 1, the CSFA Program provides loans and grants to students with financial needs who wish to pursue post-secondary education.
This report presents the findings and recommendations of the evaluation of the CSFA Program, which examined the ability of borrowers to repay their student loans. This evaluation aims to meet the Department's commitments following the Auditor General of Canada's 2020 Report on Student Financial Assistance and the Standing Committee on Public Accounts 2021 Report on Student Financial Assistance.
The evaluation addresses three main questions using multiple lines of evidence. Lines of evidence includes administrative data analyses, surveys, and focus groups with student loan borrowers in repayment.
- To what extent are borrowers able to repay their student loans?
- Why are some borrowers having difficulty repaying their student loans?
- To what extent has the temporary elimination of interest on student loans during the pandemic helped program participants?
The Canada Student Financial Assistance Program
One of the Government of Canada's goals is to help Canadians access post-secondary education and get the skills and training they need to succeed in the labour market.Footnote 2 The CSFA Program is one of the federal programs that helps students in the form of Canada Student Loans (CSLs) and Canada Student Grants (CSGs) for low- and middle-income Canadians. The CSFA Program also aims to mitigate financial constraints on access to post-secondary education, and to ensure that borrowers can meet their student loan repayment obligations (see Appendix A - Logic model).
According to the CSFA Program's annual reports and statistical reviews, 763,000 post-secondary students received approximately $6.2 billion in financial assistance in the 2021 to 2022 academic year. Of this amount, $2.9 billion were disbursed as CSLs to 558,000 students.Footnote 3
In addition to providing loans and grants to eligible students, the CSFA Program also offers repayment assistance to borrowers who have trouble in repaying their loans. The program introduced the Repayment Assistance Plan (RAP) in 2009 to replace the Interest Relief and Debt Reduction in Repayment measures.Footnote 4 Other repayment assistance measures include the Revision of Terms (ROT), payment of interest only, and Canada Student Loan forgiveness for family doctors and nurses.
The CSFA Program has undergone several changes in recent years to make post-secondary education more affordable. In response to the COVID-19 pandemic, the Government of Canada also provided financial relief to borrowers in repayment through a series of measuresFootnote 5 described below (See Appendix B for more details).
From March 30 to September 30, 2020:
- repayment moratorium
- suspension of interest accrual on CSLs
April 2021:
- elimination of interest on the repayment of CSLs until March 31, 2023
November 1, 2022:
- increased RAP thresholds
- lowered cap on monthly student loan payments
Moreover, the temporary suspension of interest accrual on Canada Student Loans and Canada Apprentice Loans announced in 2020, became a permanent measure as of April 1st, 2023.Footnote 6
Lifecycle of student loan repayment
The CSFA Program provides grants and loans to eligible post-secondary students based on their assessed financial needs. While grants are up-front and non-repayable, students must repay their loans. Student loan repayment is an integral part of the loan lifecycle.
A student loan lifecycle begins with the disbursement of loans while students are in school or in study.
- When they have finished their studies, there is no requirement to make repayment for a six-month grace period
- Once the grace period ends, all previously received loans consolidate, and the borrower enters the repayment phase
The consolidation process determines the borrower's repayment period and the corresponding monthly payment amount. Typically, the calculation of monthly payment uses information based on standard 114-month (or 9.5 years) amortization period.
Student loan repayment experience varies by borrower circumstances, as shown in Figure 1 below:
- borrowers who return to school after the grace period do not need to make any payments on their loans and they may also be eligible to receive additional financial assistance (loans or grants)
- loans of borrowers who consistently make the required monthly repayments are considered "current" or in "good standing"
- however, when borrowers miss their payment, loans are delinquent or in arrears and a loan that remains in arrears for more than 270 days is classified as in default and is referred to the Canada Revenue Agency (CRA) for collection
- a payment equivalent to two regular monthly payments and paying off any outstanding interest or adding unpaid interest to the loan balance can rehabilitate and return default loan to good standing, while loans in default that are neither rehabilitated nor collected will eventually be written off

- Source: Canada Student Loan Repayment Patterns: Insights of Administrative Data from 2007 to 2022 (2023)
Text version – Figure 1
This figure outlines the life cycle of student loans. A student loan lifecycle begins with the disbursement of loans while students are in school or in study. When they have finished their studies, there is a six-month grace period where repayment is not required. Once the grace period ends, all previously received loans are consolidated, and the borrower enters the repayment phase. The consolidation process determines the borrower's repayment period and the corresponding monthly payment amount.
Borrowers facing financial difficulties in repaying their loans may seek assistance through the Repayment Assistance Plan (RAP). RAP allows borrowers to either make no payment on the principal and interest or make reduced payments (known as affordable payments) based on their income, family size, and other debt obligations. It is important to note that enrollment in RAP is not automatic, and borrowers must apply for a period of six months at a time if they still need repayment assistance.
RAP offers different benefits depending on whether borrowers need short-term assistance soon after entering repayment or longer-term assistance after multiple years in repayment:
- for the first 5 years on RAP (RAP Stage 1), the Government of Canada pays the interest that is not covered by a borrower's monthly payment on their CSL
- for borrowers with longer-term financial difficulty (over 5 years), the Government contributes towards both the principal and interest (RAP Stage 2) so that the loan is fully paid off 15 years after leaving school
Certain borrowers may be eligible for loan forgiveness, such as doctors and nurses who practice in under served rural or remote communities, or borrowers with a severe permanent disability.
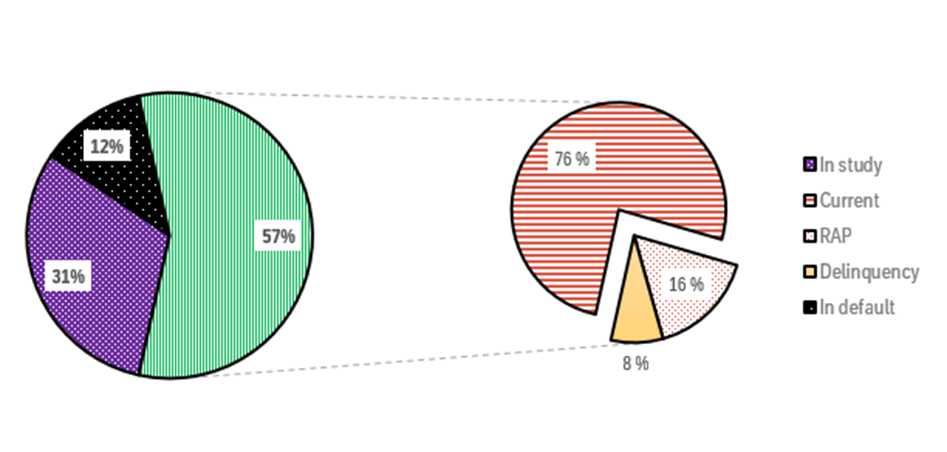
According to the most recent CSFA Program administrative data,Footnote 7 approximately 31% of borrowers in the direct loan portfolio were in study, 57% were in repayment, and 12% were in default in July 2022. Figure 2 below shows that out of those in repayment, about 76% of borrowers were currently making their payment, 16% were enrolled in the RAP, while 8% were in delinquency.
- Source: The 2021-2022 CSFA Program Statistical Review
In addition, the CSFA Program annual reportFootnote 8 indicated that around 6,100 borrowers rehabilitated a total of $83.5 million in CSLs in 2021 to 2022. This means CSFA program helped these defaulted loans back into good standing.
Consequences of student loan default
According to the CSFA Program, when borrowers consistently make the required monthly repayments, their loans are considered in "good standing." However, if borrowers miss payments, their loans become delinquent and will default after 270 days of delinquency. Then, the loan will be forwarded to the CRA for further administration.
As part of the process, borrowers receive a letter after 180 days of delinquency advising them of the risk of the loan being referred to the CRA. In the same letter, they are advised that they are being negatively reported to the Credit Bureau. When a loan is in default the borrower will be ineligible for further student financial assistance or repayment assistance options until the loan is returned to good standing or paid in full. A payment equivalent to 2 regular monthly payments and paying off any outstanding interest or adding unpaid interest to the loan balance can rehabilitate and return the default loan to good standing. Loans in default are eventually written off if they are neither rehabilitated nor collected.
The individual's credit rating is negatively impacted, which may affect their ability to borrow money in the future.
Cost of student loan repayment
After the CRA has exhausted all reasonable efforts to collect a debt, the Government of Canada annually writes off the loans deemed unrecoverable. The total amount written off in 2021 to 2022 for directly financed student loans was $168.8 million, lower than the $185.5 million in 2020 to 2021.
Another cost of student loan repayment is the RAP expense, which measures the amount of principal repaid by the Government of Canada through RAP each year, as a percentage of the total loan principal in repayment that same year. According to the 2021 to 2022 CSFA Program annual report, the RAP expense was $161.3 million and represented 1.3% of the loan principal in repayment for this academic year.
It is now well established that the repayment or non-repayment of CSLs has implications for the various stakeholders involved in the Program. However, as outlined earlier, the objective of this evaluation is to examine student loan repayment from the borrower's perspective only.
Previous evaluations
The CSFA Program has undergone several evaluations, each with a different focus. This evaluation is the first to cover repayment with a lens on borrowers' ability to meet their loan repayment obligations.
The 2021Footnote 9 evaluation of the Canada Student Loan Program (CSLP), now renamed the CSFA Program, examined the impact of loans and grants on access to post-secondary education, persistence in studies, and graduation. The findings outlined the importance of the Program in facilitating access to post secondary education and helping students persist during their studies and graduate. The evaluation recommended further examination of students' financial needs to identify the funding gaps they face, and to further enhance awareness and understanding of the Program among recipients.
With respect to CSL repayment, previous evaluations (especially 2016Footnote 10 and 2011Footnote 11 cycles) found that:
- more than 25% of college and university graduates with government debt at graduation experienced difficulty repaying their student loans
- repayment assistance helped borrowers avoid defaulting on their loans and pay back more of their loans, however, half of borrowers eligible for repayment assistance did not use it
- success at school (borrowers with high grades) and graduation (completing their program) were the 2 most significant factors in lowering the default rate on student loans
Findings
The evaluation aims to shed light on the ability of borrowers to repay their student loans in Canada and on contributing factors to the repayment challenges some borrowers face. Repayment challenges include missing payments, defaulting, and not repaying.
This analysis adopts a multifaceted approach by considering repayment patterns across multiple cohorts of students entering repayment between 2007 to 2008 and 2021 to 2022. This provides a historical perspective on CSL repayment. Section 1 further investigates the evolving default rate and its relationship with the RAP, offering insights into how this program has shaped borrowers' repayment experiences.
Additionally, section 2 focuses on individuals who consolidated their loans between 2018 and 2020 to understand the challenges they faced during the initial stages of repayment, including the impact of the pandemic on their experience. Moreover, the analysis examines the influence of sociodemographic factors on borrowers' repayment difficulties.
Finally, section 3 of this evaluation explores the effectiveness of new supports provided by the Government of Canada to borrowers during the COVID-19 pandemic.
Repayment capacity of CSL borrowers
This section uses administrative data from the Program to provide an overview of repayment performance of several cohorts of borrowers in repayment (period from 2007 to 2008, to 2020 to 2021). The analysis examines the patterns associated with borrowers' ability to repay their loans. The evaluation also provides insights into the effectiveness of the RAP in supporting borrowers who demonstrate a need for financial assistance to repay their loans.
Key findings:
- Student debt: The average loan balance has risen by 22% in the last decade (from 2011 to 2012, to 2021 to 2022), however, it has remained stable over time in real dollar value
- Recent cohorts of borrowers in repayment are outperforming earlier cohorts
- Upward trend in repayment outcomes: Share of borrowers who paid their loan in full by the end of the first year of repayment have increased since 2007 to 2008, pointing to improved repayment abilities given that by the end of the first year, 24% of borrowers who began repayment in 2020 to 2021 paid their loan in full, compared to 19% of borrowers in 2007 to 2008
- Downward trend: Default rates have been decreasing among borrowers since the 2009 to 2010 cohort due to factors including favourable economy, better management, and policy enhancements such as the RAP
- Effectiveness of the RAP: Borrowers who utilized the RAP have significantly lower default rates during the early years of repayment, relative to borrowers who did not take advantage of the Plan, although, some borrowers are not aware of the RAP and its benefits
Student debt: The average CSL balance at the time of leaving school has slightly increased in the past decade, however, it has been fairly stable over time in real dollar valueFootnote 12
Higher debt levels can present more significant repayment challenges and influence repayment outcomes.
The average loan balance (in nominal value dollar) for full time students at the time of leaving school has been on the rise over the past ten years.
From 2007 to 2008, to 2021 to 2022, there was a substantial increase of approximately 63% in the number of borrowers entering repayment every year, rising from 156,000 to 255,000, respectively.
According to the 2021 to 2022 CSFA Program Statistical Review, the average loan balance was $15,578, representing an 8% increase from the previous year, as shown in Figure 3 below.
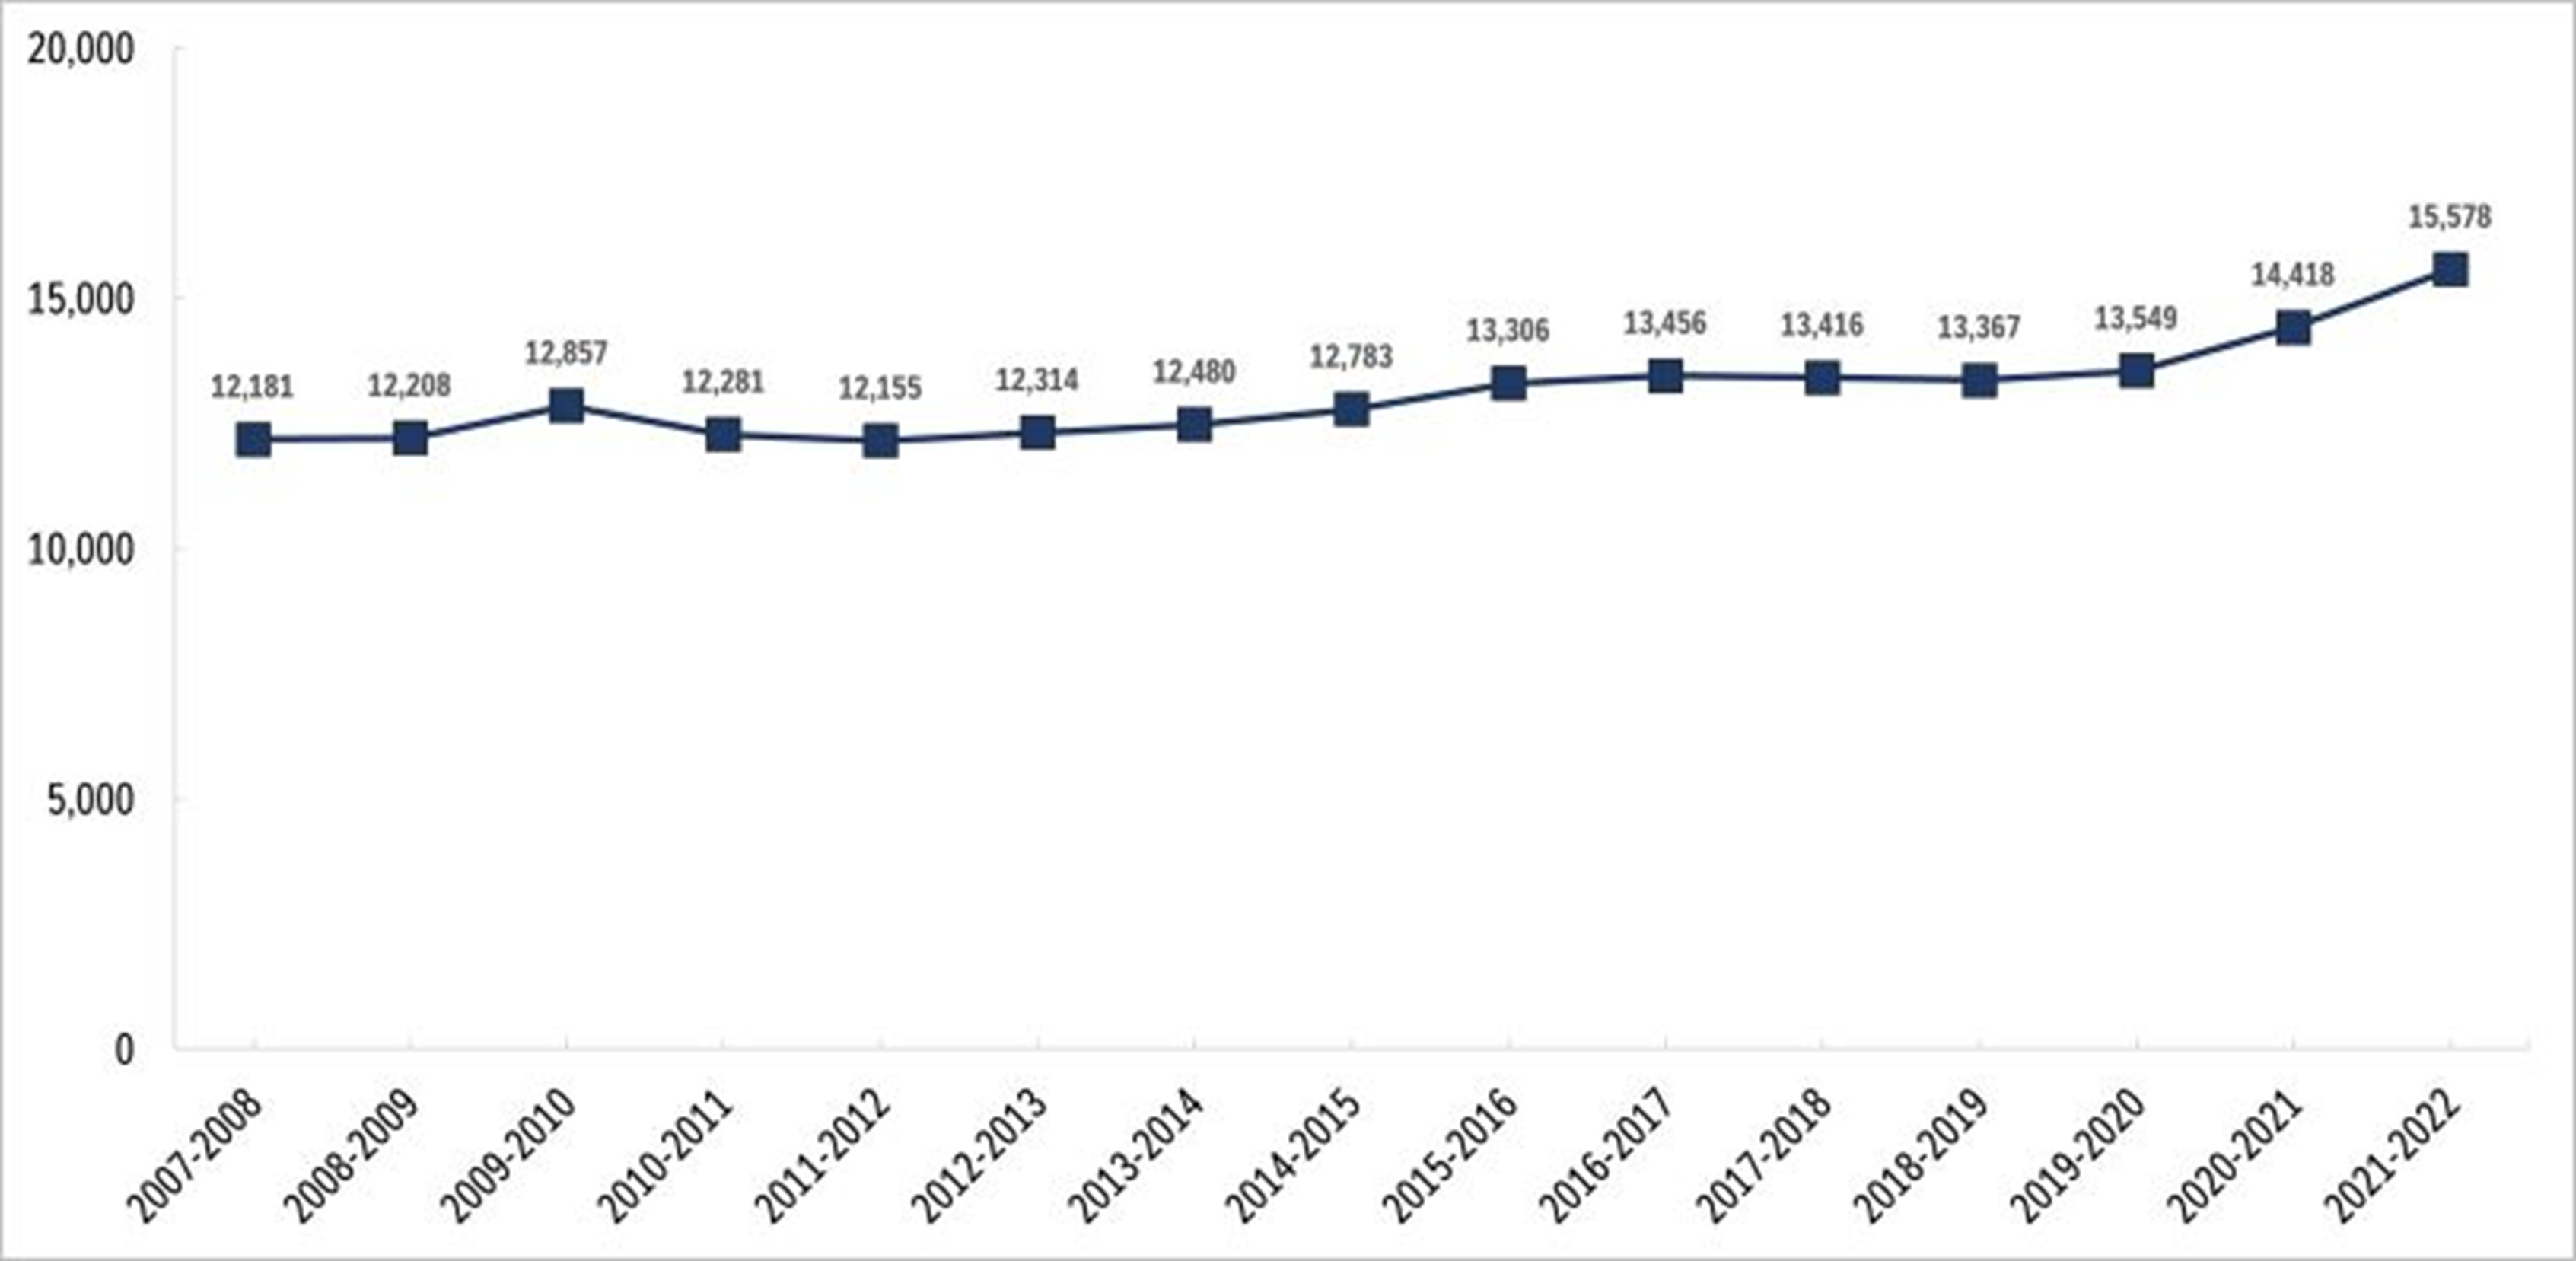
- Source: The 2021 to 2022 CSFA Program Statistical Review
The annual increase in loan balance observed in 2021 to 2022 can be partly attributed to the temporary increase in the loan limit from $210 to $350 from August 1, 2020, to July 31, 2021.Footnote 13 This loan limit increase was part of a series of CSL enhancements in response to the COVID-19 pandemic and may have impacted the loan balance of students at the time of leaving school.
Figure 4 below illustrates the distribution of loan balance among all repayment cohorts from 2007 to 2008, to 2020 to 2021 and provides insight into changes in the average debt level over time. For instance, the percentage of borrowers with student debt below $10,000 has slightly declined from 51% for the cohort of 2007 to 2008 to 48% for the cohort of 2020 to 2021. The percentage of borrowers with debt levels between $10,000 and $20,000 also slightly declined from 31% to 28%. However, the number of borrowers with debt exceeding $20,000 increased from 18% in 2007 to 2008 to 24% in the most recent cohort of 2020 to 2021.

- Source: Canada Student Loan Repayment Patterns: Insights of Administrative Data from 2007 to 2022 (2023)
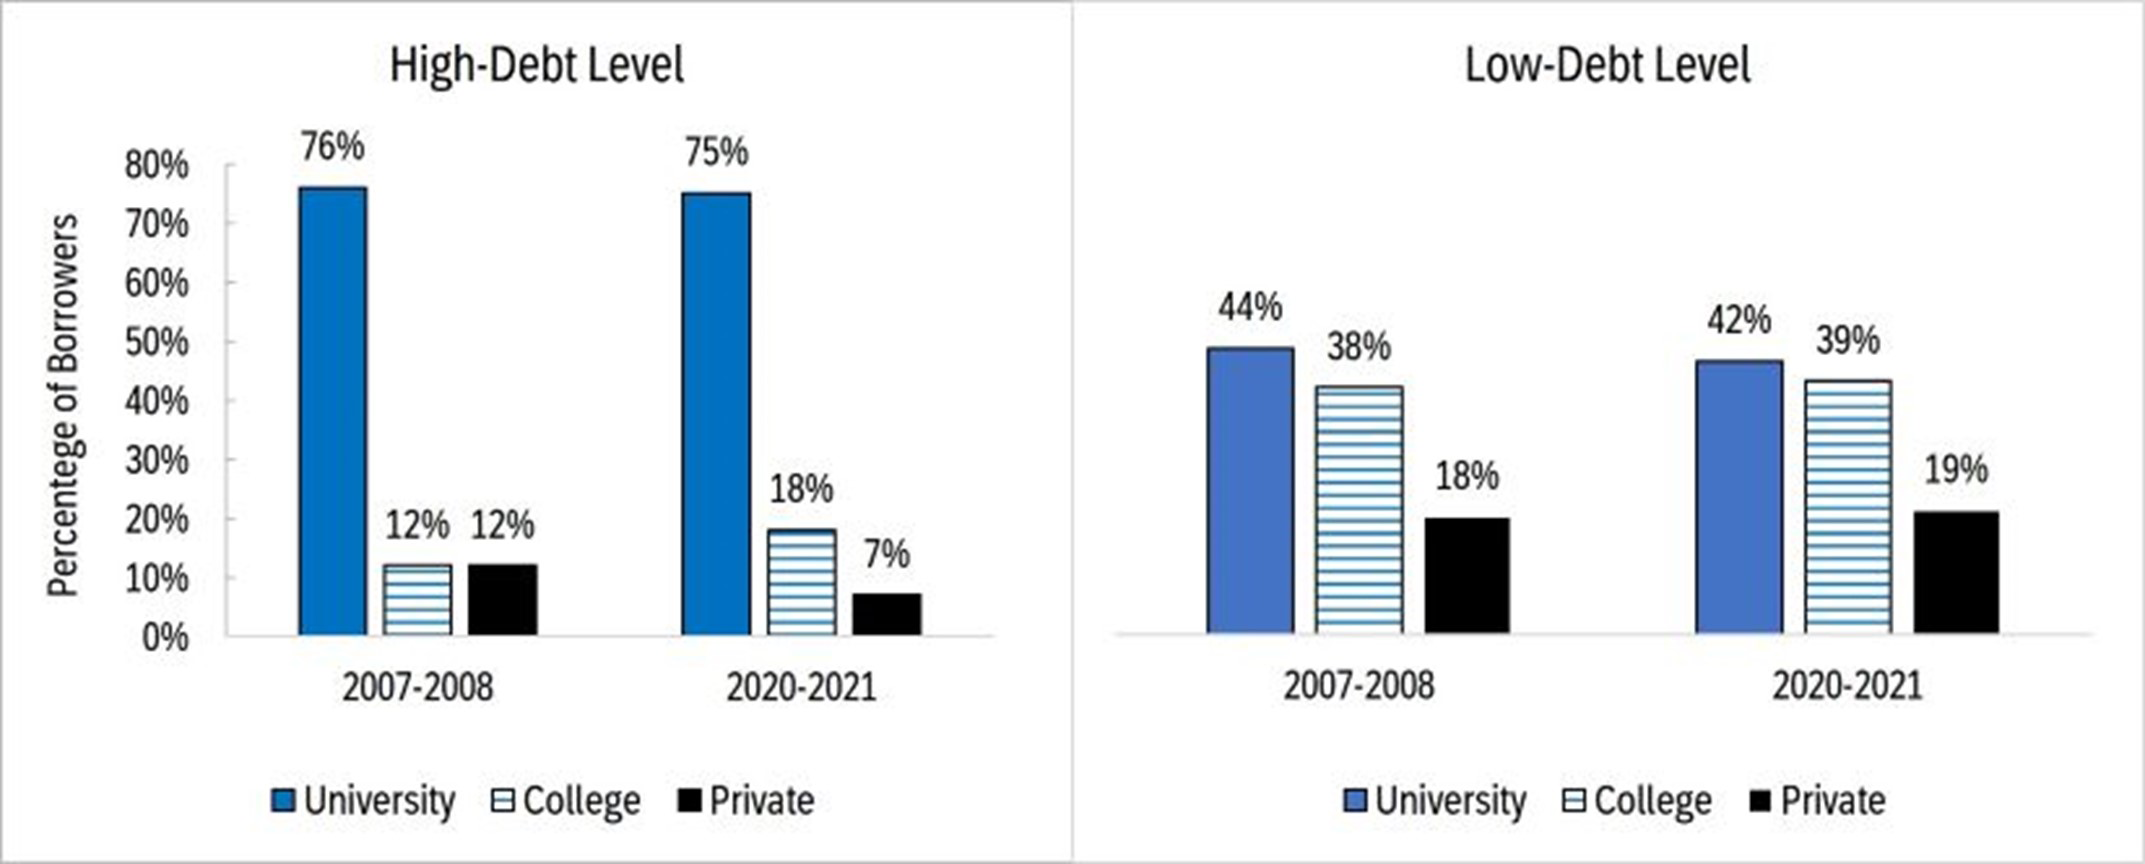
The analysis of 14 repayment cohortsFootnote 14 from 2007-2008 to 2020-2021 shows the distribution of borrowers by debt-levels across various types of educational institutions. For example, in Figure 5, a comparison between 2007-2008 and 2020-2021 cohorts reveals that the majority (75%) of borrowers in the high-debt group (debt level over $30,000) attended universities. However, despite the composition of institution types among the low-debt group ($30,000 or below) remained relatively constant, about 40% of borrowers attended both universities and colleges.
- Source: Canada Student Loan Repayment Patterns: Insights of Administrative Data from 2007 to 2022 (2023)
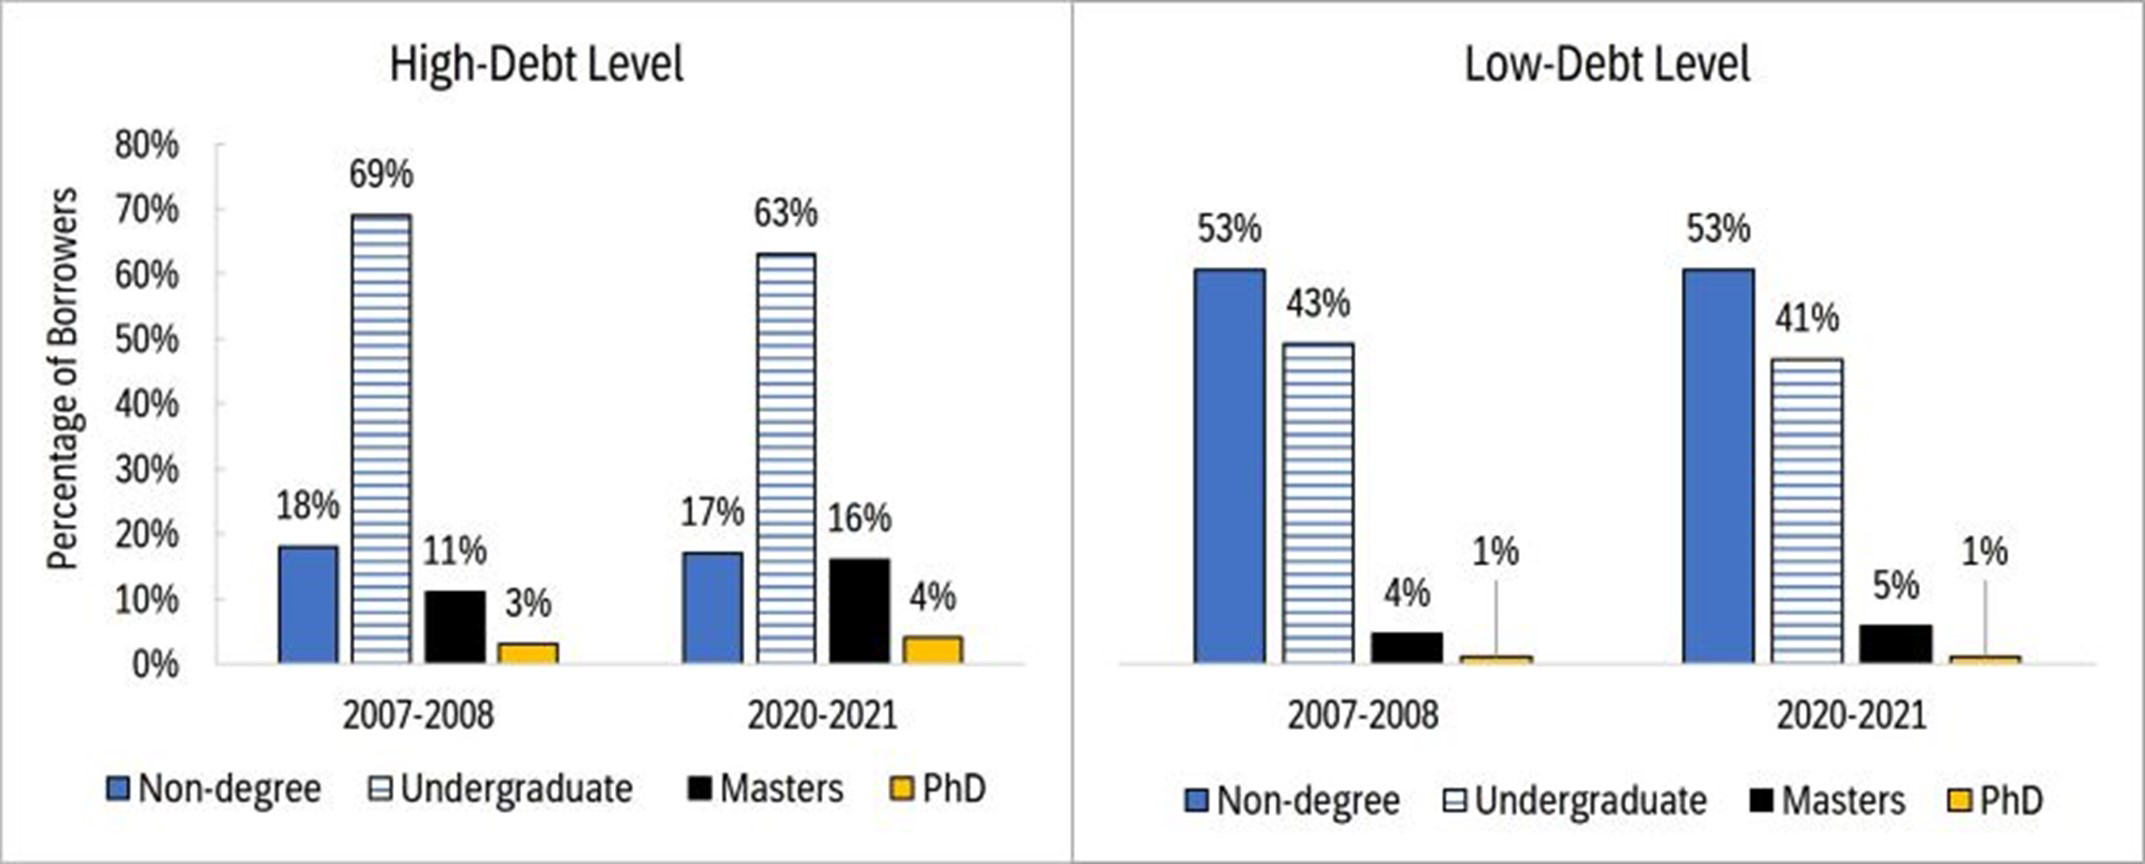
In terms of the distribution of borrowers by level of study and debt level, most undergraduate borrowers had a higher CSL amount compared to other levels of study. This reflects the fact that more than 60% of borrowers in the high-debt group accumulated debt during their undergraduate studies, although there has been a shift towards borrowers taking on debt for their master's degree in recent years.
- Source: Canada Student Loan Repayment Patterns: Insights of Administrative Data from 2007 to 2022 (2023)
Furthermore, older students tend to accumulate higher levels of CSL as they pursue multiple programs or degrees over several years. For example, borrowers aged between 25 and 29 years accounted for more than 40% of borrowers in the high-debt group (over $30,000) in both 2007- to 2008 and 2020-2021.
Promising progress: Improvements in repayment outcomes over time
Although the average CSL balance at the time of leaving school has slightly increased since 2007 to 2008, administrative data show a positive trend in student loan repayment through two indicators. These two indicators are the percentage of borrowers who paid their student loan in full, and the percentage of borrowers who defaulted, both among the 2007 to 2008, to 2020 to 2021 cohorts.
Repayment outcomes: The share of borrowers who paid in full is higher in recentFootnote 15 cohorts than in earlier cohorts, suggesting improved repayment ability
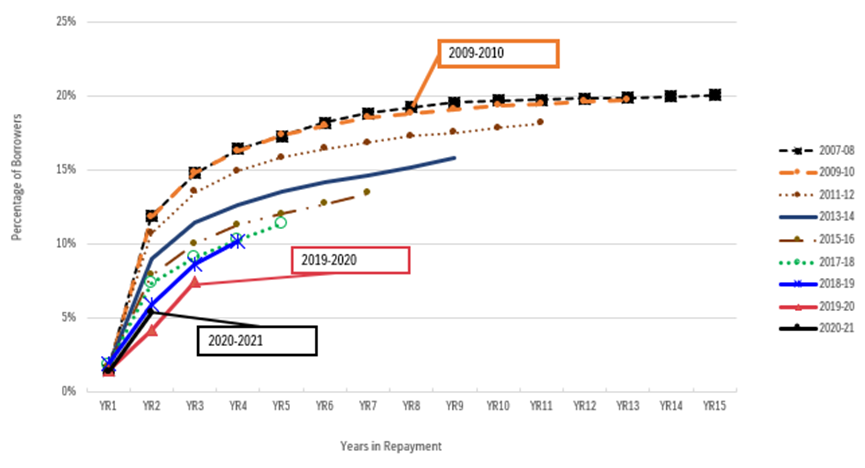
Figure 7 below shows the cumulative percentage of borrowers who paid their student loan in full at the end of each year since they began their repayment. The shorter curves represent more recent cohorts, while longer curves represent earlier cohorts. A shift in the shorter curves upward indicates that a higher percentage of recent borrowers rapidly paid their student debt in full relative to earlier cohorts. This suggests that borrowers' ability to repay student loan may be stronger among recent cohorts.
For instance, by the end of the first year of entering repayment, 24% of borrowers who began repayment in 2020 to 2021 paid their student debt in full, compared to 19% of borrowers in 2007 to 2008. Three years after the start of the repayment, one-third of the most recent cohort of borrowers (2018 to 2019, 2019 to 2020) had repaid their student debt in full compared to 26% for the 2009 to 2010 cohort. (For more information, see Figure G1 in Appendix G).

- Source: Canada Student Loan Repayment Patterns: Insights of Administrative Data from 2007 to 2022 (2023)
On the other end of the repayment spectrum, loans in default represent the opposite outcome compared to loans paid in full.
Downward trend: Default rates decreasing among borrowers since the 2009 to 2010 cohort
In addition to the increased rate of full loan repayment observed over time, more recent cohorts demonstrated a decrease in default rates compared to earlier cohorts. Many factors may have contributed to the decline in default rates, including:
- a favourable macroeconomic climate and robust labour market conditions for graduates since 2008Footnote 16
- improvements in the management of student loan portfolios
- better outreach and communication with borrowers
- successive enhancements in student financial assistance policies, in particular the Canada Student Grants and the introduction of the RAP (2009)
A detailed breakdown of CSFA Program expenditures spanning academic years 2009 to 2010 through 2021 to 2022 reveals that a main factor driving the escalation in total Program outlays has been the increase in grant disbursements (Figure G2 , Appendix G).
Figure 8 below shows a noticeable trend across cohorts, with earlier cohorts experiencing higher default rates each year than the recent cohorts. Cohort analysis also reveals that borrowers who entered repayment in the wake of the 2008 financial crisis (the 2009 to 2010 cohort) had less ability to repay their loan than other cohorts. This may be due to the long-lasting adverse effects of the crisis on economic and labor market conditions at the time of graduation and throughout the repayment period. Overall, these data demonstrate better student loan repayment outcomes over time (Figure G3, Appendix G).
- Source: Canada Student Loan Repayment Patterns: Insights of Administrative Data from 2007 to 2022 (2023)
This evaluation compared this default rate to the CSFA Program's key performance indicator, the 3-year cohort default rate. It shows the value of loans that enter repayment in a given academic year and default within 3 years to the value of all loans that entered repayment in that academic year.
This result is consistent with the 3-year default rate for direct loans for full-time students which has been on a downward trend over the last decade, indicating greater repayment ability. The 3-year default rate decreased from 15% in 2009 to 2010, to a low of 7% in 2019 to 2020.
Figure 9 below shows the 3-year default rates for direct loans (overall, based on loan amounts) and its distribution by institution type. It suggests that borrowers who attended university have much lower default rates compared to borrowers from other types of institutions (college and private institutions).
Studies have shown that borrowers’ income after graduation is strongly related to graduates’ level and field of study, with some exceptions. For example, bachelor graduates earned more than college graduates, which can explain their lowest default rate.Footnote 17

- Source: Canada Student Loan Repayment Patterns: Insights of Administrative Data from 2007 to 2022 (2023)
Effectiveness of the RAP: Borrowers who have utilized the RAP have a significantly lower default rate during the early years of repayment, relative to borrowers who did not take advantage of the Plan
Since 2009, borrowers facing financial difficulties in repaying their loans can seek assistance through the RAP.Footnote 18 Approximately 285,000 student loan borrowers received RAP support in the 2021 to 2022 academic year, a decrease of 8% from the previous academic year.
Table 1 shows that of the total number of borrowers entering repayment, about 20% in 2020 to 2021 and 16% in 2021 to 2022 received support under the RAP during their first year of repayment.
| Year | Number of borrowers entering repayment | Number of borrowers on RAP during the first year in repayment | First year RAP uptake rate (%) |
|---|---|---|---|
| 2017-18 | 203,459 | 59,510 | 29 |
| 2018-19 | 233,376 | 56,540 | 24 |
| 2019-20* | 248,604 | 40,553 | 16 |
| 2020-21 | 235,407 | 47,807 | 20 |
| 2021-22 | 254,831 | 41,813 | 16 |
- *To help support student loan borrowers, repayments were suspended for all borrowers between March 30, 2020, and September 30, 2020. No borrower was on RAP during that period, which resulted in a lower RAP uptake rate for the 2019 to 2020 academic year.
- Source: The 2021-2022 CSFA Program Statistical Review
The 2021-2022 CSFA Program Annual Report indicated that the decrease in the uptake of RAP can be attributed to a combination of factors including:
- the RAP eligibility thresholds had remained unchanged between 2016 and November 2022
- a favourable labour market for graduates as well as recent increases in minimum wages across PTs has led to income growth
In addition, the interest waiver on CSLs since April 2020 may have also resulted in fewer borrowers applying for RAP.
Interaction between RAP and CSL default rate
Figure 10 below compares the percentage of borrowers in default from four different cohorts (2009 to 2010, 2012 to 2013, 2015 to 2016, and 2018 to 2019) to understand the interaction between the RAP and default rate. Most borrowers in default have never used RAP. There are two borrower groups in this analysis: those who have used RAP and those who have never used RAP.

- Source: Canada Student Loan Repayment Patterns: Insights of Administrative Data from 2007 to 2022 (2023)
Please note that borrowers who have used RAP have done so at any time after entering repayment until the end of the reporting year, compared to those who have never used RAP during repayment.
The default trends among borrowers who have never utilized the Repayment Assistance Plan (RAP) show a significant positive shift from earlier cohorts relative to recent ones. To illustrate this shift, consider that the default rate for the 2009 to 2010 cohort was 20%, whereas it dropped to 13% for the 2015 to 2016 cohort in the sixth year of repayment (See Figure G4 in Appendix G for more details).
This decrease in default rates among borrowers without RAP experience in recent cohorts is a notable improvement. Much of this improvement can be attributed to the fact that many low-income borrowers have become RAP users. This strengthens the overall repayment performance of those who have never used RAP.
Borrowers who have used RAP tend to maintain stable default rates initially but experience an upward trend in later years, particularly by the sixth year of repayment. Conversely, for borrowers who have never used RAP, default rates increase significantly in the first 2 years of repayment but then level off after 5 years.
Analyzing cohort data reveals that borrowers with any history of using RAP exhibit lower default rates in the early years of repayment compared to those without any RAP experience. For instance, in the second year of repayment for the 2009 to 2010 cohort, borrowers with RAP experience had a default rate of 4%, while those without any RAP history had a default rate of 15%.
However, this gap between the two groups gradually narrows over time, and by the sixth year of repayment, their default rates become more similar. At the end of year 13, the gap has narrowed to 2 percentage points from the initial gap of 11 percentage points at the end of year 2.
Similar patterns are observed in the 2012 to 2013 and 2015 to 2016 cohorts. In summary, borrowers with RAP experienceFootnote 19 tend to utilize this assistance early in their repayment journey, preventing them from defaulting during that period. However, some of them may still fall into default once they are no longer on RAP. The faster increase in default rates in later years is due to their lower incomes during this time. This indicates that borrowers who have used RAP are more prone to default in the long term compared to those who have not.
Additionally, borrowers experiencing financial difficulties may become eligible for RAP, causing them to transition from the non-recipient group to the recipient group. This dynamic contributes to the increasing slope of the default curve in the later years of repayment. In some cohorts, the percentage of borrowers in default becomes higher among the recipient group in the later years of repayment.
Further analysis is necessary to fully understand why some borrowers who used RAP early in repayment later fell into default. One question to consider is whether the income threshold for RAP eligibility during the study period was too restrictive to provide effective assistance to borrowers with long-term repayment difficulties. The enhancements to RAP introduced in Budget 2021 present a valuable opportunity for conducting such an analysis.
Some borrowers may have defaulted early in their repayment period because they were not aware of the RAP or its benefits, leading them to miss payments and later default
The focus of this evaluation was not whether borrowers were aware of CSL repayment options. However, some surveys conducted by the CSFA Program indicate that most student loan borrowers are aware of the existence of the RAP. These results also show that certain groups are still unaware of this assistance and would be at risk of default.
Pulse surveys conducted by the CSFA Program in 2021 and 2022 that included RAP awareness components reported that most borrowers (76%) were aware of the RAP. Of those, one quarter (25%) claimed to have applied for RAP between April 2021 and June 2022. The CSFA Program 2021-2022 Annual Client Satisfaction Survey reports that 38% of respondents were not aware of the repayment options offered through the CSFA Program. Among those who knew about the options, well over four out of five (83%) indicated that they were aware of the RAP, making it the most widely known repayment option among borrowers. However, data from the annual client satisfaction surveys (2008 to 2022) and the Pulse surveys do not provide an understanding of the reasons why defaulting borrowers have not applied for RAP.
Understanding CSL borrowers' repayment experience
The following section reviews the repayment journey of individuals who consolidated their student loans between 2018 and 2020 and have been in repayment for at least 2 years. By focusing on this specific cohort through survey and focus groups, this evaluation seeks to gain a deeper understanding of borrowers' experiences during the initial years of repayment, including the challenges they encountered during the COVID-19 pandemic. In addition, and based on empirical research, the analysis examines the influence of various sociodemographic factors related to repayment difficulties.
Key findings:
- debt management ability: CSL borrowers well positioned themselves to manage their loan repayment
- debt-to-income ratio: student loan borrowers exhibit lower ratios over time
- almost four out of ten of borrowers surveyed (39%) reported having a debt-to-income ratio of 0% for their current student loan
- repayment-to-income ratio: Student loan borrowers can afford to repay their loans without difficulty
- a significant majority (72%) of borrowers surveyed make monthly payments that amount to 5% or less of their household income
- despite favorable repayment-to-income ratios: over half of borrowers reported struggling with making loan payments
- socio-demographic dynamics: certain variables are strongly associated with difficulty to repay student loans
Debt management ability: CSL borrowers are well positioned to manage their debt load and make their payments
This section focuses on analyzing borrowers' debt-to-income and repayment-to-income ratios based on the 2023 survey data.Footnote 20 It examines the ability to repay by exploring the repayment status of different cohorts over time. In fact, these ratios take into consideration borrowers' household income levelsFootnote 21 and debt (CSL and total student debt) to provide a more informed analysis based on financial capacity to manage loan repayment and meet their obligations.
As shown in Figure 11 below, two-thirds (66% or 2,050) of the borrowers surveyed were in repayment, that is, their CSL was not paid off, with 78% of them reporting that they were making payments toward their CSL, while 18% were receiving assistance from RAP to make affordable or zero payment. Finally, 4% of borrowers who were officially in repayment reported not making any payments (delinquent) at the time of the survey.

- Note: n=3,109 (excluding the “Don’t know”). Survey respondents provided their CSL repayment status at the time of completing the survey, which was between January to March 2023.
- Source: Survey for the Evaluation of the CSFA Program (2023)
Debt-to-income ratios
The debt-to-income ratio is calculated as the ratio of the consolidated CSL to the borrowers’ gross household income. The distribution of this ratio examines whether borrowers still owe on their government student loans at the time of leaving school and at the time of survey, as presented on Figure 12 below.

- Notes:
-
- n =2,420
- This figure presents income as a question with scales where the respondent was asked to choose their approximate total household income in 2022 from a series of income bands. For calculating the ratio income bands were converted to numerical values using the mid-point of the scale for estimated household income.
- Excludes borrowers who did not report their income. Excludes those with a government loan debt of $0 or who did not report their debt.
- Source: Survey for the Evaluation of the CSFA Program (2023)
Please note that there is no specific universally accepted threshold for an acceptable student loan debt to household annual income ratio. However, lower debt-to-income ratios would suggest that borrowers could manage their debt repayment over a shorter period while maintaining a reasonable level of financial flexibility.
More than one thirdFootnote 22 of borrowers reported having paid off their student loans at the time of survey. In addition, the data shows that among respondents who still had student loans at the time of the survey, around half (47%) of borrowers have a ratio below 20%, suggesting that they can manage their debt repayment while maintaining a reasonable level of financial flexibility.
77% of borrowers still owing on their CSL had a debt at the time of survey that was 50% or less of their annual household income in 2022. 24% of borrowers had a debt-to-income ratio of 10% or less, compared to only 12% when considering their CSL at the point of leaving school.
Scott-Clayton (2017) emphasizes the importance of Grade Point Average (GPA), family wealth, loan amount, and their debt-to-income ratio. Higher GPAs and greater family wealth are linked to a lower likelihood of default. While the likelihood of default decreases with the loan amount, it increases with the debt-to-income ratio, highlighting the individual's role in repayment.
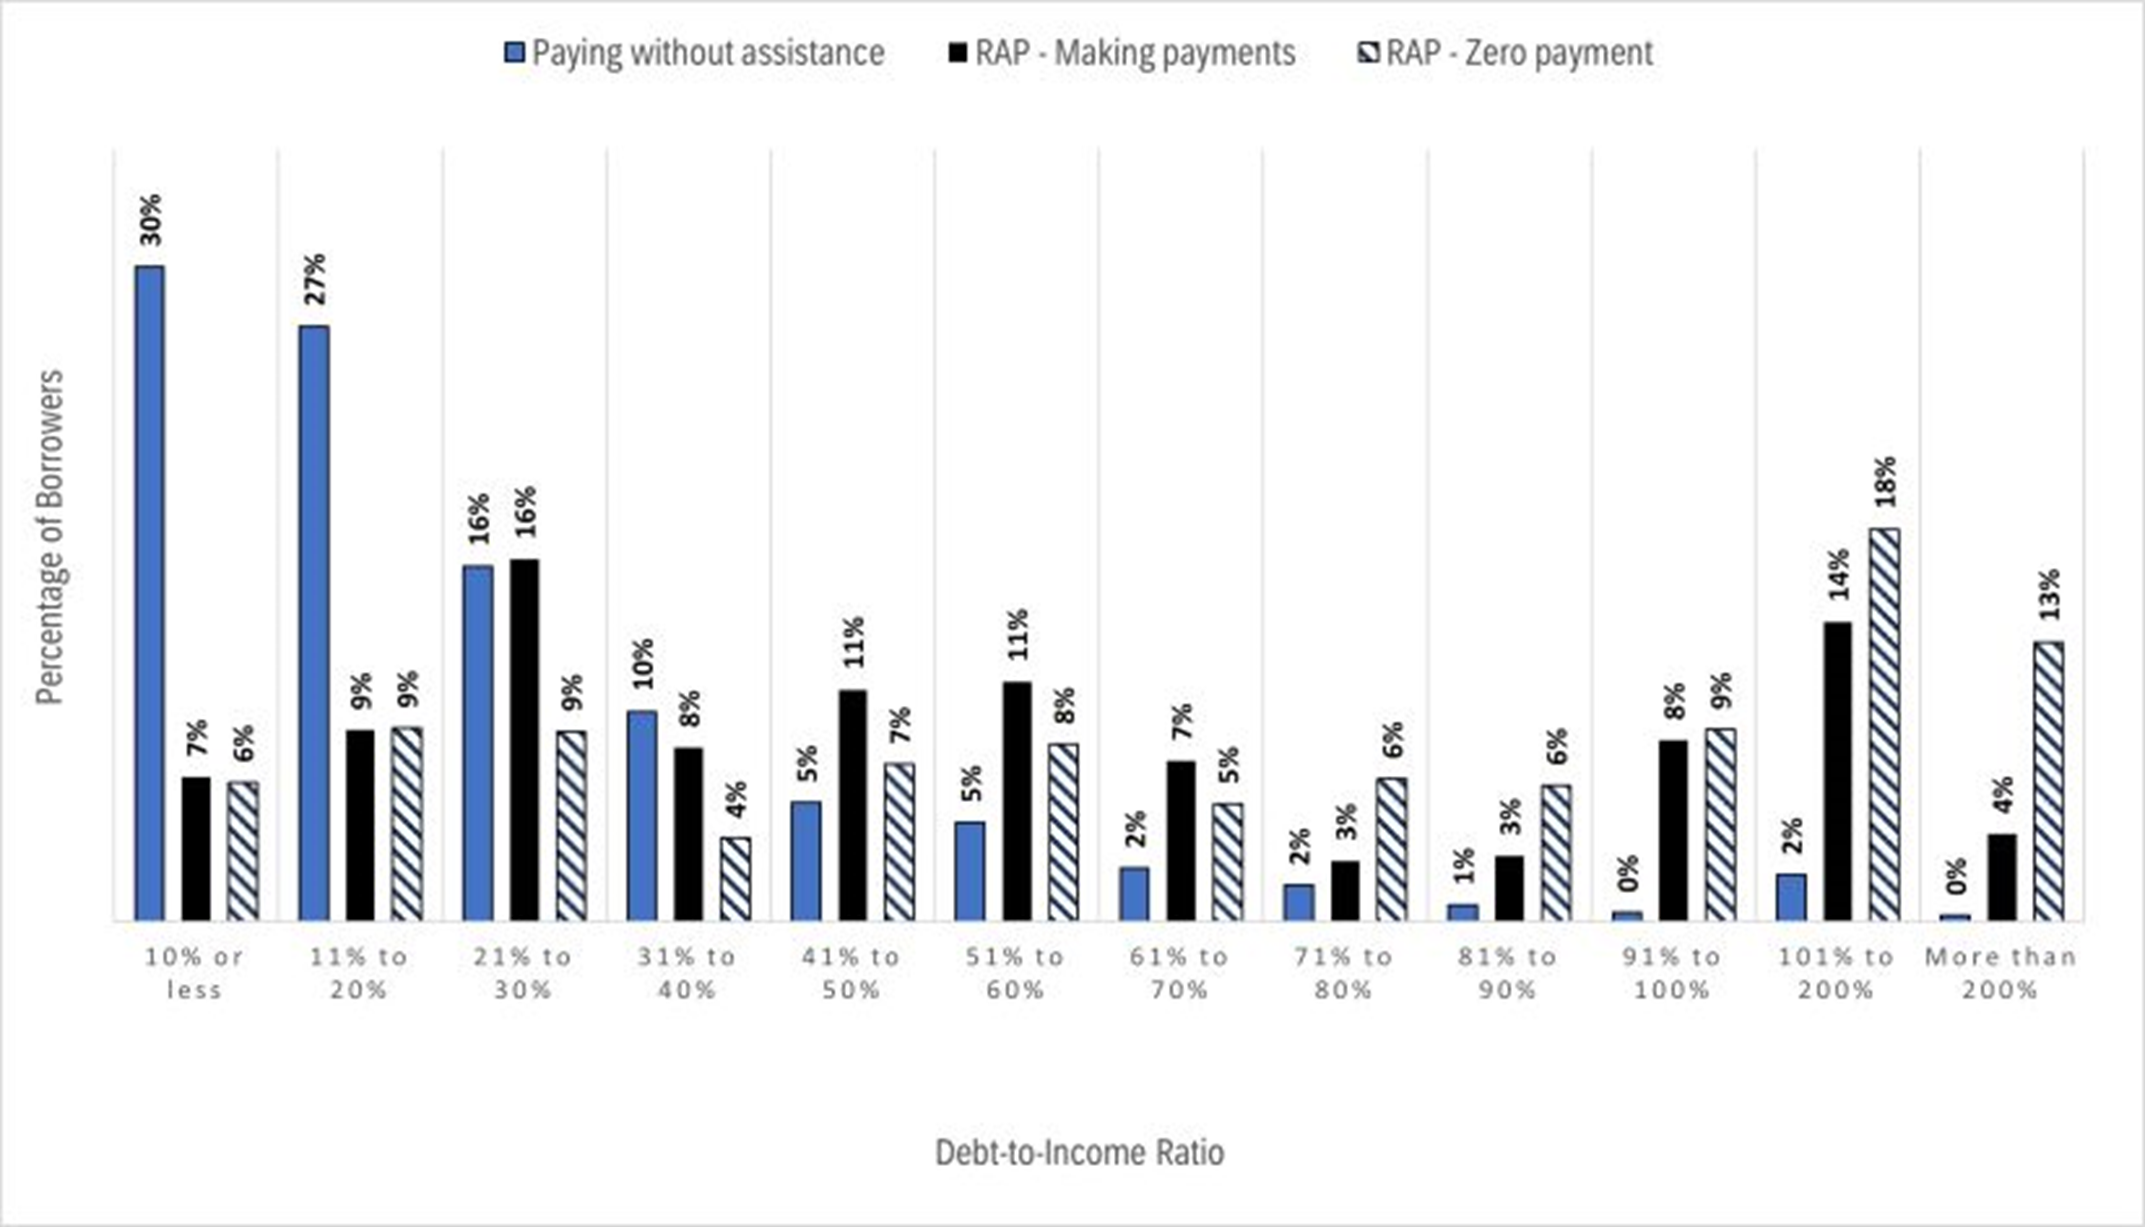
Figure 13 below shows the distribution of CSL debt-to-income at the time of the survey based on the extent of which the borrower was using the RAP for making payment. The majority of borrowers (88%) had a debt-to-income ratio of 50% or less, while this was the case for borrowers under the RAP making affordable payments (50%) and zero payment (35%).
These data also highlight the effectiveness of government assistance, the RAP, in focussing on borrowers with lower financial capacity.
The purpose of the RAP is to support borrowers facing financial difficulties in repaying their student loans. The figure below shows that at the time of survey, fewer borrowers benefiting from the RAP (making affordable and zero payment) had a debt-to-income ratio of 50% or less, compared to borrowers who were not benefitting from the RAP.
- Notes:
-
- n Paying without assistance = 1,125, n RAP - Making payments = 139, n RAP - Zero payment = 138
- This figure presents income as a scale question with the respondent asked to choose their approximate total household income in 2022 from a series of income bands. For calculating the ratio income bands were converted to numerical values using the mid-point of the scale for estimated household income.
- Excludes borrowers who did not report their income. Excludes those with a government loan debt of $0 or who did not report their debt.
- Source: Survey for the Evaluation of the CSFA Program (2023)
Repayment-to-Income ratios
The repayment-to-income ratio is the percentage of monthly gross household income used for student debt repayment. This ratio provides more information about the extent to which borrowers can afford to repay their loans without experiencing financial stress or difficulty.
Borrowers' repayment-to-income ratios were approximated by dividing reported monthly CSL payments at the time of the survey by monthly gross household income in 2022. Please note that a low ratio indicates a higher ability to repay, while a high repayment-to-income ratio may mean less flexibility in meeting loan obligations.
Survey data indicated that almost three-quarters (72%) of borrowers were making payments that were 5% or less of their monthly household income, while nearly two-thirds (65%) of RAP recipients were also making payments that were 5% or less of their monthly household income. Thus, these results indicate that a significant majority of borrowers well positioned themselves in terms of their ability to repay their student loan.
Figure 14 below shows the distributionFootnote 23 of monthly CSL payments at time of the survey to monthly household income based on whether the borrower was making payment with the support of the RAP or not. It excludes borrowers benefitting from the RAP and not making payments.

- Notes:
-
- n Paying without assistance = 1,368, n RAP - Making payments = 144
- This figure presents income as a scale question with the respondent asked to choose their approximate total household income in 2022 from a series of income bands. For calculating the ratio income bands were converted to numerical values using the mid-point of the scale for estimated household income.
- Excludes borrowers who did not report their income. Excludes those with a government loan debt of $0 or who did not report their debt.
- Source: Survey for the Evaluation of the CSFA Program (2023)
In addition, Figure 15 below shows the distribution of total repayment-to-income ratios, calculated by dividing monthly payments on total student loans (CSLs plus loans from banks, other financial institutions, family members, friends, and other acquaintances) at the time of the survey by monthly gross household income in 2022.
The results indicate that more than half (56%) of borrowers were making payments that were 5% or less of their monthly household income at the time of the survey, followed by RAP recipients making payments (48%) and RAP recipients making zero payment (38%). Note that RAP borrowers making zero payment may be reporting payments for loans other than CSLs since their government student loans were being fully covered by RAP.
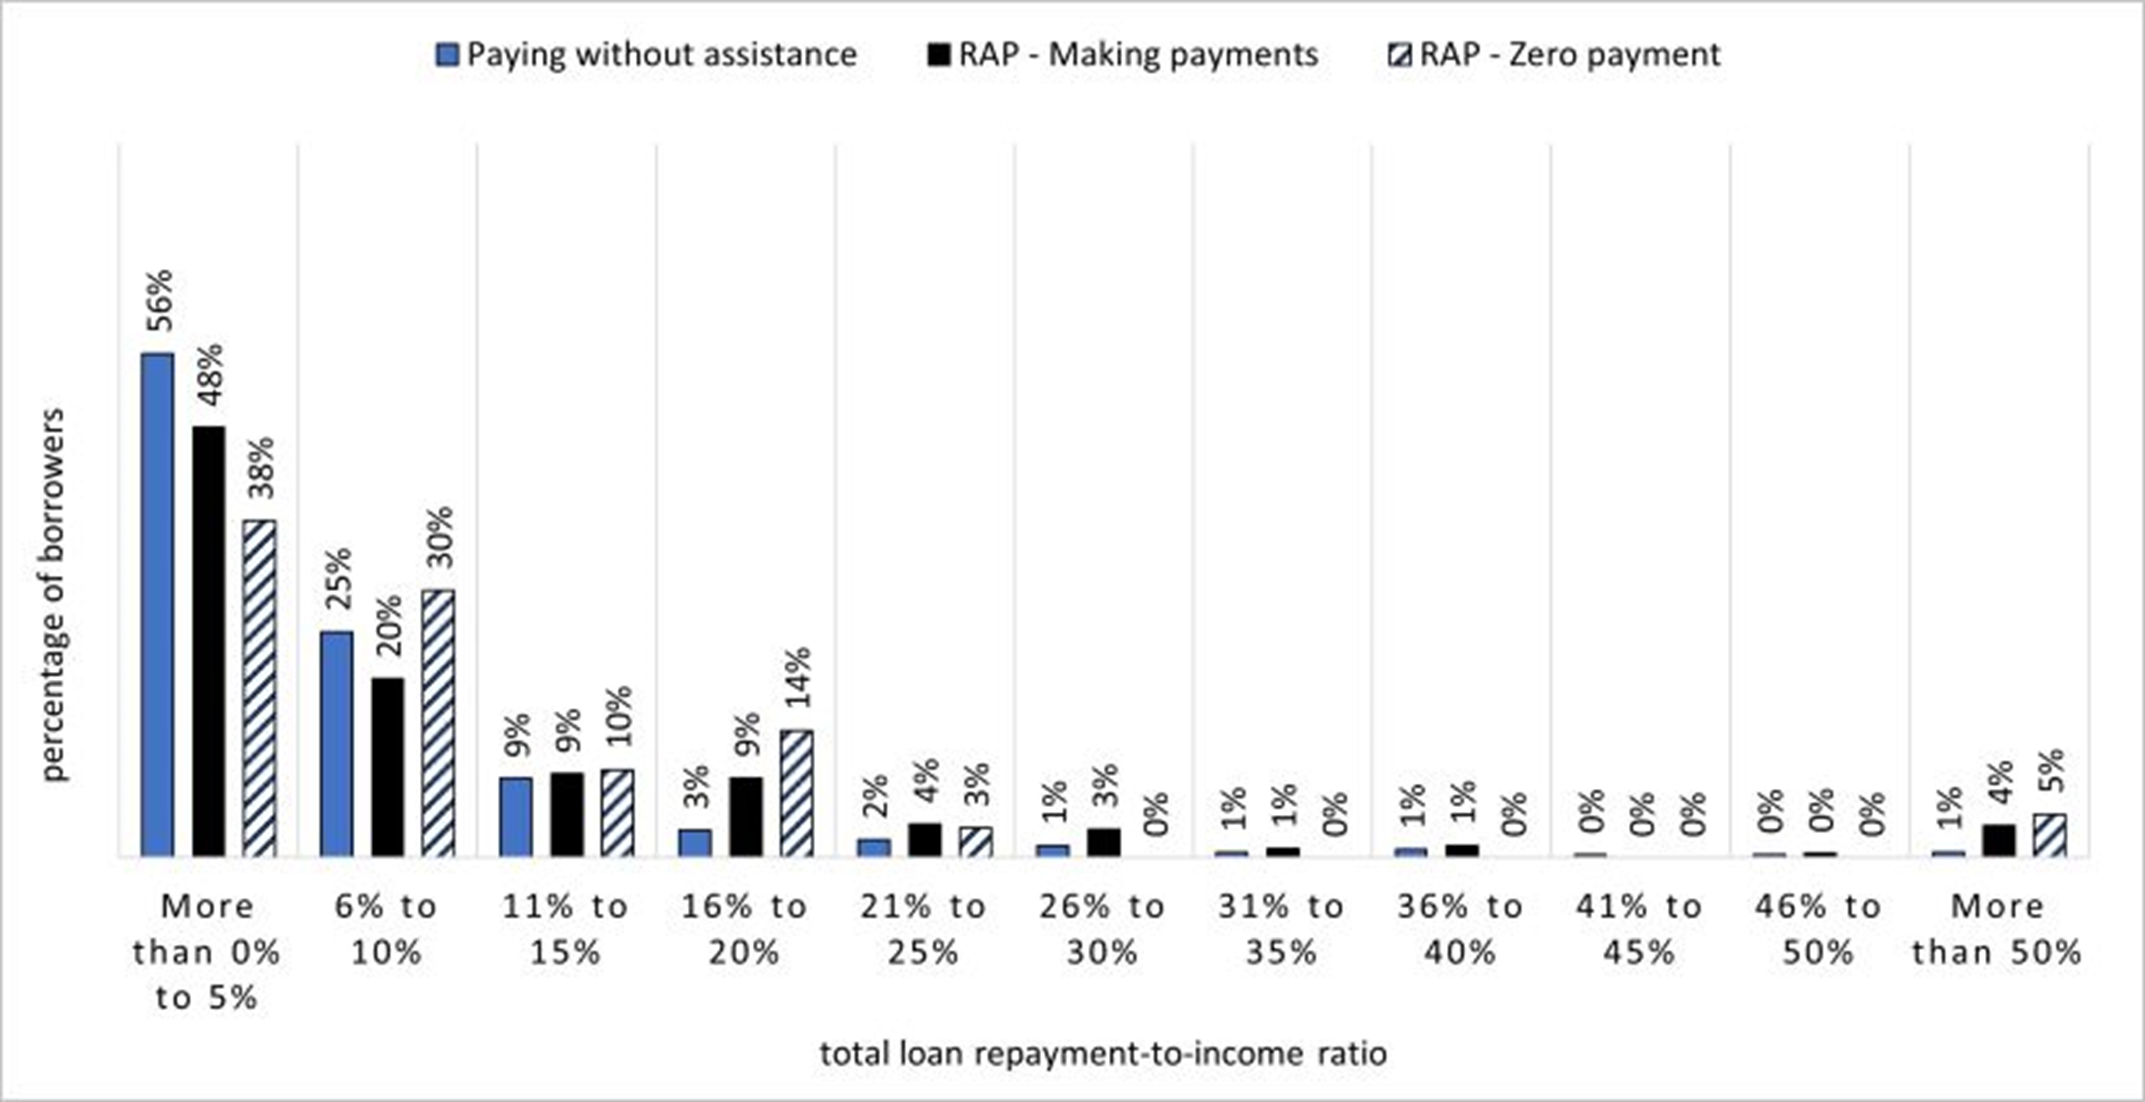
- Notes:
-
- n Paying without assistance = 1,382, n RAP - Making payments = 149, n RAP - Zero payment = 42
- Source: Survey for the Evaluation of the CSFA Program (2023)
Similar analysis for previous cohorts of borrowers using most recent linked dataFootnote 24 at Statistics Canada corroborate and point to a similar distribution. The analysis examines the ratio of CSL student loans payments to family income over the first year of repayment following loan consolidation. It also found that for most borrowers (more than 60%), their annual student loan repayments represented less than 5 % of their annual family income.
Using the same linked data, complementary analysis also examined the average annual CSL repayment to the family income ratio over different repayment periods. For example, for the cohort of borrowers who consolidated their loan in 2010 to 2011, the ratio was estimated over a period of up to 5 years following consolidation. The same analysis was conducted for the 2014 to 2015 cohort, but up to 2 years following consolidation. Overall, the average ratios of annual CSL repayment to family income ratio remain about the same at 15% over the repayment period (15.5% for the 2010 to 2011 cohort and 14% for the 2014 to 2015) cohort).
Student loan repayment-to-income ratio - Recent measures
Recent measures can potentially improve the student loan repayment-to-income ratio going forward. While not covered by this evaluation, these include enhancements to the RAP introduced in the 2021 Budget and effective November 1st, 2022. A borrower earning $40,000 per year or less (adjusted for family size) is no longer required to make any payments on their student loans while on RAP. Moreover, for those receiving assistance from RAP, the maximum monthly CSLs payment has been reduced from 20% to 10% of their household income. These changes aim to improve the effectiveness of RAP in providing relief to borrowers and preventing defaults.
Starting April 1st, 2023, the Government of Canada has implemented interest-free loans for students, turning the 2020 temporary suspension of interest accrual on Canada Student Loans and Canada Apprentice Loans into a permanent measure. This new change will address one of the suggestions made by focus groups participants to permanently remove interest from student loans to make repayment easier.
It is worth noting that international comparisons showed that Canada's interest rates (Prime plus 2.5% until 2019) for repayment were less generous compared to those of the United States, New Zealand, Australia, and the United Kingdom. Therefore, the implementation of interest-free loans can have a positive impact on borrowers' repayment ability.
Demographic factors and student loan debt to income ratios
Certain demographic groups tend to have a higher debt-to-income ratio, indicating a lower ability to repay their student loans on time. Notably, single, and older borrowers are consistently more likely to have a higher debt-to-income ratio than their counterparts.
In addition, borrowers who are likely to have higher student loan debt, such as borrowers from private colleges or universities, or who studied in high-cost programs such and medicine and dentistry are more likely to have difficulties repaying their student loans.
To gain insight into borrowers' loan-repayment difficulties, the evaluation performed 2 separate analyses that examined factors impacting student loan repayment.
The first analysis used current survey data to calculate the debt-to-income ratio already introduced in this report. A multiple linear regression analysis was conducted to identify demographic groups with higher debt-to-income ratios. The predictor variables were identified by responses to the relevant survey questions and included, among others, type of institution, age group, region of residence, marital status, and other statuses. The results of this analysis highlighted that:
- borrowers who attended university had higher ratios compared to those who attended public colleges
- individuals aged 25 to 44 also had higher debt-to-income ratios than those aged 18 to 24 years
- the ratio of student loan debt to household income was higher for residents of the Central or Atlantic/Quebec regions than for those living in the Eastern (Ontario) region
- single borrowers with no children had higher debt-to-income ratios compared to married or common-law (with or without children) borrowers at the time of the survey
- finally, borrowers who self-identified as having a disability or as Indigenous also had higher ratios than their counterparts, respectively
Complementary to the debt-to-income ratio, the second analysis seeks to inform borrowers' ability-to-repay, by examining the ratio of average family income during the repayment period to the consolidation amount.Footnote 25 This analysis used dataFootnote 26 linkage to inform borrowers' capacity to repay student loans and identified distinctive patterns among various socio-demographic characteristics, as shown in Figure 16 below. The analysis found that the average ratio is 13, which would be equivalent to an average family income of $65,000 over the repayment period divided by a consolidated CSL debt amount of $5,000. Therefore, below average ratios would suggest lower capacity to repay student loans.

- Source: Evaluation of the Canada Student Financial Assistance (CSFA) Program using Linked Administrative Data (2023)
Data linkage analysis also shows that single parents encountered significant limitations in repayment, and the presence of dependents further reduced their ability-to-repay ratio.
- Immigrants exhibited a lower ability-to-repay ratio despite having slightly smaller loan amounts than Canadian citizens
- Borrowers in the lowest age category (15 to 25) have a much higher ratio than any other age group
- Recipients of disability grants also displayed a higher ability-to-repay ratio than their counterparts
In addition, "field of study" emerged as a factor. For instance, medicine and dentistry are associated with lower ability-to-repay ratios due to higher student debt. Yet, borrowers who did not graduate had "higher ability-to-repay ratios" than those who did because of their lower incomes and debt loads.
Challenges despite positive repayment-to-income ratios: over half of borrowers reported struggling with loan payments
The data collected suggest that borrowers' repayment difficulties, namely delinquencyFootnote 27, default and/or participation in the RAP, are the result of precarious and unstable financial situations. Also, some sociodemographic factors are associated with repayment difficulty faced by borrowers.
To uncover the level of difficulty faced during repayment, borrowers who were paying their student loan (with or without the assistance from RAP) were asked how easy or difficult it was to make their monthly CSL payments. Among the surveyed borrowers, two-third (66%) indicated they were making payments toward their CSL, with 18% benefiting from RAP assistance to make either affordable (9%) or zero payments (9%).
Although the RAP does help borrowers during repayment by lowering their monthly CSL payments, survey data show that RAP recipients making affordable paymentsFootnote 28 were still more likely (74%) to report repayment difficultyFootnote 29, compared to those paying without assistanceFootnote 30 (50%).
Overall, despite the favorable repayment-to-income ratios described above, the repayment experience of borrowers is not always easy.
- More than one-half (52%) of all borrowers surveyed reported it was somewhat (33%) or very (19%) difficult to make these payments
- In contrast, only about one-quarter (23%) indicated it was very (12%) or somewhat (11%) easy to make payments (see Table 2 below)
| Rating | Borrowers (%) |
|---|---|
| Very Easy | 12 |
| Somewhat Easy | 11 |
| Neither Difficult nor Easy | 24 |
| Somewhat Difficult | 33 |
| Very Difficult | 19 |
- Note: n=1,776
- Source: Survey for the Evaluation of the CSFA Program (2023)
In addition, twenty one percent (21%) of borrowers making repayments reported that they had to make a late payment or miss at least one payment toward their government student loans.
The main reasons they provided included unexpected personal expenses (61%), need to prioritize payments on other loans (47%), and unstable source of income (46%).
To further this analysis the evaluation probed borrowers who were not meeting their student loan obligations to understand the reasons underlying their repayment status. As for borrowers in repayment who were not making any payments (delinquent)Footnote 31 and were not on the RAP at the time of the survey (2023), they indicated that unexpected personal expenses (49%), unstable source of income (42%), and need to prioritize payments on other loans (37%), followed by mental health issues (33%) as the main reasons for not currently making payments (Figure 17).
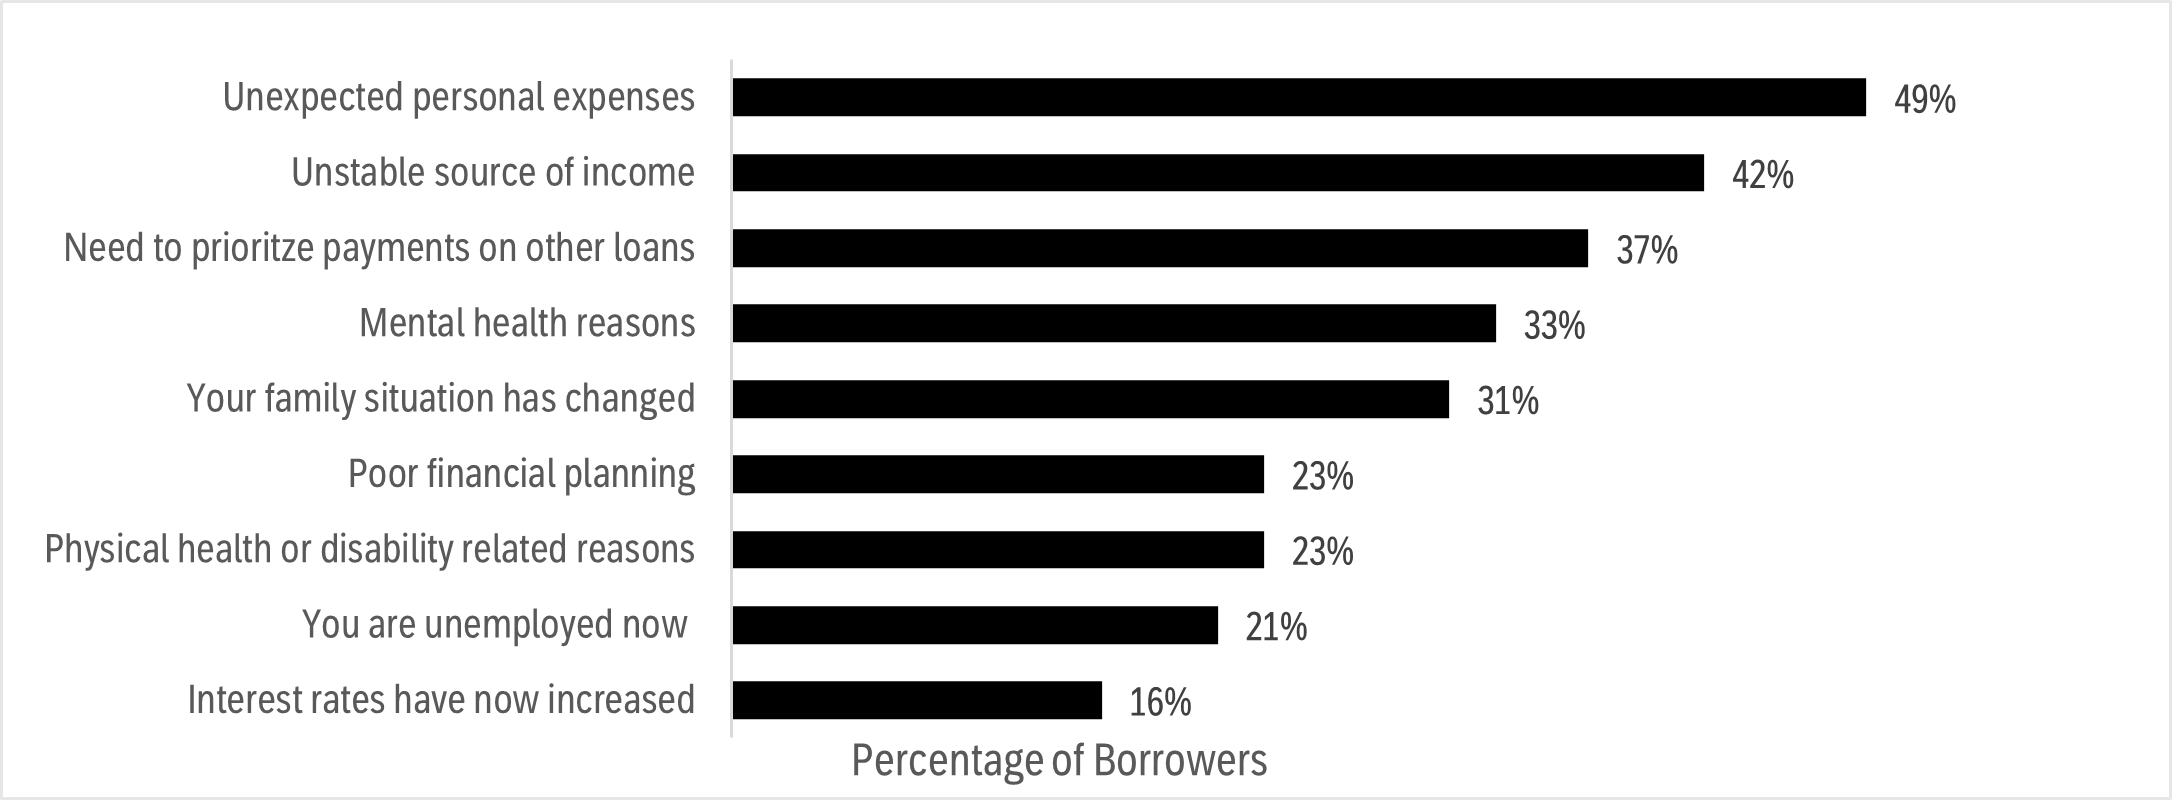
- Note: (n=80), Survey respondents could select more than one reason.
- Source: Survey for the Evaluation of the CSFA Program (2023)
This finding about reasons for missing payments or not repaying student loans is consistent with comments made in focus groups by participants with repayment difficulties (meaning individuals who have used the RAP, or who had become delinquent or defaulted on their loan payments).
- 7 out of 10 focus group participants cited lack of work or intermittent employment as limitations to make payment, leading to a reduction in income or a low salary that does not meet expectations or needs
- About 1 of 5 participants also cited other factors such as inability to find work in chosen field
- In addition, participants cited unstable source of income as one of the main reasons for difficulties, demonstrating the importance of this factor in the ability to repay student loans
The data collected during this evaluation also demonstrates that the RAP has a significant impact on participants; all focus group participants who commented about the RAP reported that it had been extremely helpful in reducing monthly payments to manageable levels. In addition, all participants enrolled in the RAP did not describe their loan experience as negative because of the ability to reapply and continue to use the RAP over time or as needed.Footnote 32
"I used the RAP, and it has been a huge help. I am a single mom with one child, and I have not been able to find work. How can I pay my bills let alone my loans?"
- Focus Group Participant
"I have applied for the RAP at times when I needed it. About half of the time, I have been on the RAP and half the time making the full payment."
- Focus Group Participant
When considering whether borrowers received assistance from the RAP and/or ROT, 97.9% reported they did receive assistance from RAP, while only 3.2% reported a ROT. Greater than eight-in-ten (82.9%) of these borrowers further indicate that if they did not receive assistance, their likelihood to pay their government-sponsored loan would be either very unlikely (70.0%), or somewhat unlikely (13.5%).
Sociodemographic influences: Marital and family status, region of residence, income, debt, and disability
As documented in the literature and as part of this evaluation, a range of factors influence a borrowers' ability to repay their student loan. While certain factors exhibit widespread consensus (marital and family status), others demonstrate varying degrees of significance across studies (disability).
For instance, in a 2020 studyFootnote 33 using data from the 2018 National Graduates Survey (NGS), Statistics Canada examines the relationship between student characteristics and debt reduction 3 years after graduation. This study demonstrated that factors associated with faster debt repayment include having a smaller debt size at graduation, having higher employment income, residing in Ontario, and being in a couple without children.
Conversely, factors associated with slower debt repayment include having a large amount of student debt at graduation, residing in the Atlantic provinces or Quebec, graduating at an older age, and having a disability.
Using the same set of data, a quantitative analysisFootnote 34 of the 2018 NGS as part of the evaluation, utilizes a logistic regression model to assess the likelihood of encountering difficulties in repaying student loans. This study expands on Statistics Canada's 2018 NGS research by incorporating the RAP as an indicator of loan repayment difficulty. The dependent variable of this regression was the use of RAP showing whether the participant is having difficulties in repaying student loan or not, and the explanatory variables included 17 most relevant variablesFootnote 35 that can affect the likelihood of having loan repayment difficulty (For more information, see Figure G6 in Appendix G).
The findings reveal that certain demographic characteristicsFootnote 36 of CSFA Program participants are associated with a higher likelihood of experiencing loan repayment difficulties:
- individuals who are single, widowed, separated, divorcedFootnote 37, belong to a visible minority group, or have disabilities face increased challenges in loan repayment than their counterparts
- residing in Ontario, Quebec, or the Western Provinces is associated with a lower likelihood of loan repayment difficulties compared to the Atlantic Provinces, however, factors such as gender, age, and immigration status did not yield statistically significant odds ratios
- additionally, participants with debt amounts below $25,000 have a lower likelihood of encountering repayment difficulties, while those with dependents, parents without post-secondary degrees, or who depend on government loans as their main funding source are more likely to face repayment challenges
- moreover, individuals with college degrees are more susceptible to loan repayment difficulties compared to those with master's or PhD degrees, while participants in STEM (science, technology, engineering, and mathematics) fields have a reduced likelihood of encountering difficulties
- the presence of grants, bursaries, scholarships, and the type of study did not significantly explain the likelihood of loan repayment difficulties
- finally, participants with earnings exceeding $50,000 during the interview period (3 years after graduation) exhibit a lower chance of encountering repayment difficulties compared to those with earnings below $10,000
Assessing the COVID-19 measures to support graduates
In addition to examining borrowers' ability to repay their student loan, another objective of this evaluation was to explore the extent to which the measures implemented by the Government of Canada during the pandemic have helped borrowers in repayment (for more information on these measures, see Appendix B). The surveyFootnote 38 (2023), the focus groups (2023), and the cohort analysis analyze the effects of repayment moratorium and the suspension of interest.
Because of the timing of this evaluation as well as the recency of the RAP enhancementsFootnote 39, it was deemed premature to analyze the effect of these enhancements on borrowers.
Key findings:
- an overwhelming majority of borrowers have acknowledged the positive impact of the repayment moratorium and the suspension of interest on their financial capacity and loan repayment capability during the COVID-19 pandemic as 53% of borrowers reported they would have been unlikely to have made payments on their loans if the moratorium were not in place
- cohorts entering loan repayment during the pandemic exhibit slightly improved outcomes, indicating that government's income support programs introduced in March 2020 may have effectively alleviated short-term repayment challenges
Pandemic measures positively impacted borrowers' financial capacity
The assessment of the impact of the moratorium on the financial situation of borrowers found that nearly three-in-four (74%) borrowers reported a positive impact on their financial situation, with only 15% who did not, and 12% reporting they were not aware of this measure.
Furthermore, the evaluation also examined the degree to which the suspension of interest had a positive impact on the financial situation of borrowers with respect to making payments towards their student loans (outstanding principal amount). 53% reported they would have been unlikely (very or somewhat) to have made payments on their loans during this period if the moratorium was not in place. 33% indicated they would have been likely (somewhat or very) to make their payments.
According to the survey results, two-thirds of borrowers (67%) indicated that this measure had a positive impact on their financial situation, with 18% reporting it did not, and 15% indicating they did not know about the suspension of interest.
Overall, borrowers surveyed reported that the suspension of interest and the moratorium on student loan payments positively impacted their financial situation. Surveyed borrowers indicated that both measures help them with covering the cost for basic necessities (69%), housing expenses (61%) and putting money away for savings (42%).
Focus groups participants endorse these survey findings:
"Yes, I was aware of the no interest part. It helped because it means that you are not paying interest and so the total amount to pay back is less."
- Focus Group Participant
In addition to the suspension of interest and the moratorium on student loan payments, the evaluation also explored the extent to which the labour market disruption associated with the COVID-19 pandemic may have affected borrowers' ability to make their payments.
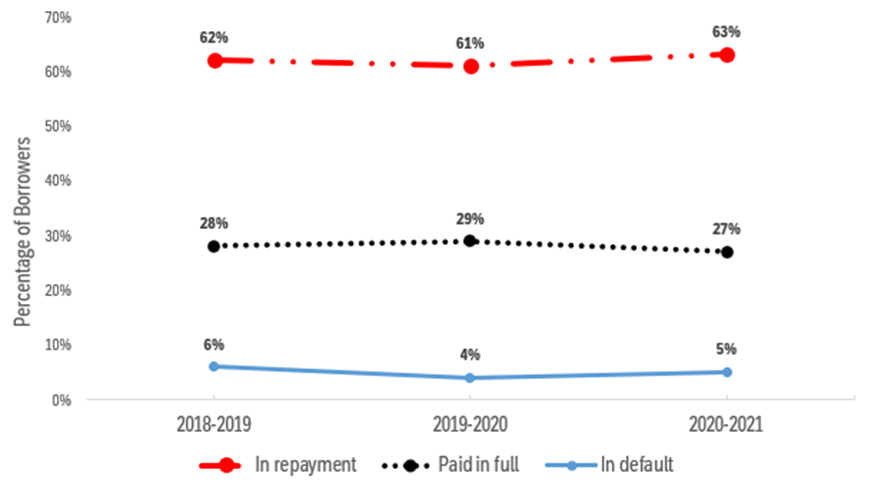
Using CSFA program administrative data, the evaluation also looked at the repayment outcomes of borrowers who entered repayment during the pandemic. Particularly, the repayment status at the end of the second year in repayment for 3 cohorts (2018 to 2019, 2019 to 2020, and 2020 to 2021) were analysed: cohort 2018 to 2019 entered repayment before the pandemic, while the other cohorts did so during the pandemic.
Data analysis shows that cohorts who entered repayment during the pandemic have similar outcomes than previous cohorts, suggesting that temporary measures and temporary income support programs introduced by the Government in March 2020 may have mitigated short-term repayment challenges.
Related survey data by borrower subgroups were similar. However, it is important to note that more females reported higher living expenses than males (64% vs. 56%, respectively) because of the pandemic, while borrowers who were Canadian citizens by naturalization and those who were legally married were less likely to report a lost of employment than their counterparts (Canadian citizens by birth and single/never married, respectively).
- Source: Canada Student Loan Repayment Patterns: Insights of Administrative Data from 2007 to 2022 (2023)
In fact, the cohort 2019 to 2020, which faced the most challenging labour market conditions, achieved slightly better repayment outcomes than the previous cohort. This is indicated by their higher percentage of borrowers who paid in full (29% vs. 28%) and lower default rate (4% vs. 6%).
In addition to measures to help borrowers in repayment throughout the pandemic, both the federal and provincial governments in Canada implemented various income support measures, including the Canada Emergency Response Benefit (CERB), Canada Emergency Student Benefit (CESB), Canada Recovery Benefits as well as enhanced Employment Insurance benefits. These measures mitigated the impact of lost earnings experienced by recent graduates.
Nevertheless, it is important to recognize that the impact of adverse economic conditions on repayment outcomes may continue over several years. The adverse economic effects of the 2008Footnote 40 recession had a long-lasting impact on the repayment ability of the 2009 to 2010 cohort, as evidenced by their lowest paid-in-full rates (60% after 13 years in repayment) of any cohort. Specifically, between October 2008 and October 2009, younger individuals and men aged 25 to 54 were more affected by job losses. Over this period, employment declined by 3.3% among men, and by 1.2% among women from age 25 to 54.
Although temporary measures may have alleviated financial difficulties that the pandemic has brought to students and recent graduates in the short term, more time and further analysis will be needed to understand the long-term effects of the health and economic disruptions.
Conclusion
The evaluation sought to inform borrowers' capacity and experience when fulfilling their student loan repayment obligations.
The findings indicate an overall improvement in repayment outcomes from borrowers' perspective. However, early evidence suggests that borrowers who recently started repaying still face challenges in meeting their obligations.
The government's support, which includes the RAP, had a positive effect on repayment capacity. Additionally, the implementation of new assistance measures during the pandemic helped with repayment capacity and borrowers acknowledged it as beneficial in managing these challenges.
The findings of this evaluation also point to possible evidence relative to the reasons behind borrowers not applying for RAP when they were on the verge of defaulting, such as the lack of awareness of the repayment assistance measures in place.
On the other hand, it is possible that borrowers' income exceeded the eligible threshold, preventing them from accessing RAP, putting them at risk of defaulting. Understanding the factors that hindered their participation in RAP can help identify areas for improvement and support borrowers in meeting can meet their student loan repayment obligations.
- As Budget 2021 introduced RAP enhancements effective November 1st, 2022, borrowers earning $40,000 or less annually (adjusted for family size) no longer need to make payments on student loans while on RAP, while the maximum monthly CSLs payment for those on RAP has decreased from 20% to 10% of household income, aiming to enhance relief and prevent defaultsFootnote 41
- In addition, April 1st, 2023, Canada has implemented interest-free loans for students, making the 2020 temporary suspension of interest accrual permanent
This addresses a focus group suggestion to permanently remove interest, improving loan repayment ease. Other suggestions included providing and/or requiring the provision of financial literacy education and specific information about loan terms and repayment to students and loan applicants and improving the nature and extent of information provided by the CSFA Program to students and individuals in repayment.
The shift to interest-free loans and RAP enhancements can potentially have a positive impact on borrowers' financial obligations.
In conclusion, to ensure effective monitoring and assessment of the impacts of all student loan repayment measures including on different socio-demographic's groups, this evaluation recommends analysing their effect, using available and all other up-to-date pertinent data. This will enable analysis of the outcomes resulting from the implementation of these measures.
Main findings:
- the ability to repay student loans has improved
- trends show higher rate of full loan repayment and lower default rate over time for borrower cohorts in repayment between 2007 to 2008 and 2020 to 2021
- by the end of the first year, 24% of borrowers who began repayment in 2020 to 2021 paid in full, compared to 19% of borrowers who began repayment in 2007 to 2008
- more than half (52%) of borrowers surveyed said that it was difficult to make payments with certain demographic sub-groups experiencing more difficulties than others
- 53% of borrowers reported they would have been unlikely to have made payments on their loans if the moratorium was not in place indicating that Government income support measures introduced in March 2020 have effectively alleviated short term repayment challenges
- early results of borrowers who started loan repayment during the pandemic (2019 to 2020) show slightly higher percentage (29%) of those who paid in full than previous cohorts after the second year in repayment
Recommendations
Based on these findings, the evaluation provides the following 2 recommendations:
- take additional steps to improve awareness of student financial assistance measures, including repayment assistance supports
- monitor recent changes to student loan repayment under the Canada Student Financial Assistance Program, such as enhancements to the Repayment Assistance Plan and the elimination of interest accrual on loans and assess their impact on student loan borrowers and repayment over time, particularly with respect to loans in delinquency or default
Appendices
Appendix A: Logic model of the CSFA Program
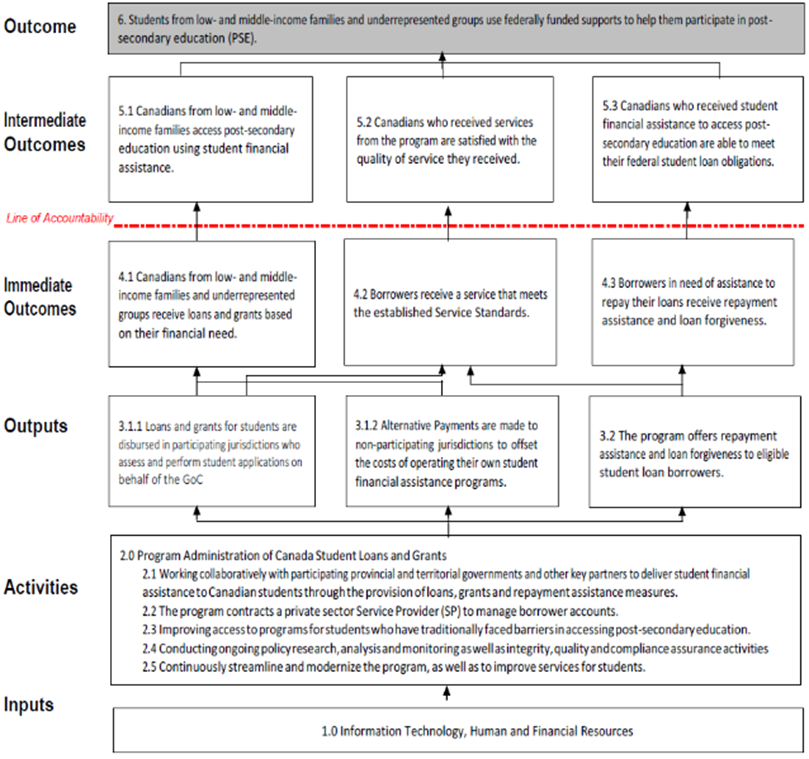
Text description – Appendix A
Outcome:
- Students from low- and middle-income families and underrepresented groups use federally funded supports to help them participate in post-secondary education (PSE)
Intermediate outcomes:
- Canadians from low- and middle-income families access post-secondary education using student financial assistance
- Canadians who received services from the program are satisfied with the quality of service they received
- Canadians who received student financial assistance to access post-secondary education are able to meet their federal student loan obligations
Immediate outcomes:
- Canadians from low- and middle-income families and underrepresented groups receive loans and grants based on their financial need
- Borrowers receive a service that meets the established Service Standards
- Borrowers in need of assistance to repay their loans receive repayment assistance and loan forgiveness
Outputs:
- Loans and grants are disbursed to participating jurisdictions who assess and perform student applications on behalf of the GoC
- Alternative Payments are made to non-participating jurisdictions to offset the costs of operating their own student financial assistance programs
- The program offers repayment assistance and loan forgiveness to student borrowers that qualify
Activities
- Program Administration of Canada Student Loans and Grants
- Working collaboratively with participating provincial and territorial governments and other key partners to deliver student financial assistance to Canadian students through the provision of loans, grants and repayment assistance measures
- The program contracts a private sector Service Provider (SP) to manage borrower accounts
- Improving access to programs for students who have traditionally faced barriers in accessing post-secondary education
- Conducting ongoing policy research, analysis and monitoring as well as integrity, quality and compliance assurance activities
- Continuously streamline and modernize the program, as well as to improve services for students.
Inputs
- Information Technology, Human and Financial Resources
Appendix B: Measures introduced during the pandemic to help students and recent graduates

Text description – Appendix B
For borrowers in repayment from March 30 to September 20, 2020:
- Suspension of interest on the loans
- No payment required for 6 months
For all students:
- Extending the $1,600 adult learner top-up to the full-time Canada Student Grant
- Waving interest on student loans until Mar. 31, 2023
For all borrowers:
- Using current year's income, instead of the previous years, to determine their eligibility for Canada student grants
For all students:
- Until July 2021:
- Eliminating the fixed student contribution and the spousal contribution in the student financial resources considered in the calculation of student loans
- Increasing the weekly maximum loan limit from $210 to $350 per week
- Until July 2023:
- For full-time students: Doubling of grant amounts to up to $6,000
- For part-time students: Doubling of grant amounts to up to $3,600
- For students with disabilities: $4,000
- For students with dependents: Doubling of grant amounts
For borrowers with persistent or prolonged disabilities that are not permanent:
- Up to $22,000 in grants, in-study supports, and specialized repayment assistance on their loans
For all borrowers on RAP:
- Increasing the threshold for repayment assistance to $40,000 for single borrowers
- Adjusting the threshold upwards based on family size
- Reducing the cap on monthly student loan payments from 20 % of household income to 10%
- Indexing eligibility for repayment assistance to inflation
Appendix C: Profile of borrowers not making payment (delinquent) on their CSL at the time of the survey (2023)
Borrowers not making payment on their CSL represent 4% of borrowers in repayment.
Profile information below is specific to this small group of borrowers.
- Last payment: 42.3% of this group reported that their last payment was more than 6 months ago, 11.7% indicated that their last payment was made between 3 to 6 months ago, and 22.8% reported that their last payment was made less than 3 months ago
- Resume payment: Just over half of them reported that they thought they would be able to resume payments within one year, while close to three-fifths indicated that their government-sponsored student loans were either already in default or are at risk of defaulting
- Concerns about their debt load were highest, with over 80% reporting they felt moderately or extremely concerned and borrowers primarily concerned about housing and not being able to afford basic necessities
- Impact of the pandemic: The majority (83%) reported that the COVID-19 pandemic negatively impacted their ability to make loan payments due to higher living expenses (62%), reduced work hours (60%), or job loss (53%) with most (80%) reporting that the pandemic impacted the time they expected they would need to pay off their loans
- Their demographic characteristics align with their inability to make payments toward government-sponsored student loans including lower levels of education (66% have received a PSE credential), lower levels of total household income in 2022 (31% had an income of $20,000 to Less than $40,000), and a more significant negative impact on household income caused by the pandemic (cited by 82%)
Appendix D: Lines of evidence used in this evaluation
| Line of evidence | Description |
|---|---|
| 2018 National Graduate Survey | An analysis of this survey data helped to determine the likelihood of defaulting student loans and to better understand the profile of borrowers based on the previously listed socio-economic characteristics. The integration of sociodemographic and economic factors as explanatory variables in this analysis also helped to identify and explain what factors contribute to the likelihood of defaulting. The final sample for this analysis consists of 4,525 respondents who graduated in 2015, had government-sponsored student loans, and did not complete further schooling after 2015. |
| Linked Administrative Data Review | The objective of this data review was to examine borrowers' ability to repay their student loans, given their income and employment situation after their studies, as well as the use of the Repayment Assistance Plan. Using data from the CSFA Program, T1 Family File (T1FF), and Post Secondary Information System (PSIS), this linked administrative data analyses determine borrowers' likelihood of having loan repayment difficulties based on socio-demographic and economic factors. This analysis used a sample with 194,390 borrowers who consolidated in 2010 to 2011 and were in repayment until 2015. |
| CSFA Administrative data review | The purpose of this line of evidence was to analyze the repayment patterns of student loans borrowers to determine the repayment dynamics of federal student loan borrowers, the percentage of borrowers who fully repay their loans compared to the percentage who end up defaulting on their loans, and the length of time required to repay federal student loans. This review also allowed the evaluation to isolate the impact of the COVID-19 pandemic based on the number of years since the end of studies. The repayment data covered the period from August 2008 to December 2022. Data analysis was conducted on 14 cohorts of students who left their studies and consolidated their loans for repayment between the 2007 to 2008 and 2020 to 2021 academic years. |
| Survey of student loan borrowers | A survey of 3,200 borrowers who consolidated their loans between August 1, 2018, and July 31, 2019, and began repaying before 2021 (in repayment for 2 or more years). The survey examined borrowers' ability to repay their student loans, the reasons behind loan repayment difficulty and non-repayment, and the impact of the measures introduced by the Government of Canada during the pandemic to support graduates. The survey took place from January to April 2023. The survey design was based on the 2020 Post-Study Survey (previous evaluation) approach and results. |
| Focus groups with Program participants | The evaluation team held 8 online focus groups between December 2022 and February 2023 to examine the ability of CSFA clients to repay their student loans. Specifically, this line of evidence explored the timeframe students need to pay back their loans, the reasons for any difficulties in repaying their loans, and the use of repayment assistance. 64 borrowers participated in the focus groups sessions. Participants were borrowers who consolidated their loans between August 1st, 2018, and July 31, 2019, and have been in repayment. They were segmented by administrative repayment status (whether they used the RAP to cover loan payments or not), household income, and institution type. |
| Document and literature review | A review of internal documents and the literature on the repayment experience of student loan borrowers, the reasons for repayment difficulties (delinquency, default, and request for repayment assistance), and the factors associated with these difficulties. The literature review also examined how Canada's student loan program is positioned relative to those of other countries, specifically with respect to student debt repayment and measures implemented to support graduates during the COVID-19 pandemic. The review covered CSFA Program annual and statistical reports, Client Satisfaction Survey reports, and over fifty studies. |
Appendix E: Methodological limitations
Inability to use administrative data to analyze survey responses
The purpose of this survey was to explore post-education outcomes for student loan borrowers in terms of their ability to repay student loans. In addition, it examined the impact of the pandemic on borrowers' repayment and the measures introduced by the Government of Canada to support graduates.
For recruiting survey participants, the evaluation was provided with a sampling of student loan borrowers who have been in repayment for two or more years with the last loan period between August 2018 to July 2020. This list only contains borrowers' contact information, such as: name, mailing and email addresses, date of birth, and phone number.
However, it was not possible to share borrowers' administrative data with the external consultant in charge of this line of evidence to comply with the Privacy Act and the Department's Privacy Management Framework. Limited access to accurate data profiles like borrowers' employment income, student debt level, marital status, or type of institution attended, prevented the possibility of linking survey responses to administrative data for analysis. To address this issue and produce reliable survey results, all demographic and other student profile data were gathered via the questionnaire.
Lack of availability of the most recent tax data for accurately linked administrative data results
Another line of evidence for this evaluation is the linked administrative data review. Its purpose was to examine the ability of borrowers to repay their student loans given their income and employment situation after their studies and the use of RAP. This analysis addresses the evaluation questions using data from the CSFA Program, T1 Family File (T1FF), and Post Secondary Information System (PSIS).
The reference period for this analysis was the cohort of participants who started repayment during 2010 and/or 2011, who may or may not have completed their study in public postsecondary educational institutions in Canada, and who were in repayment until 2015. Limitations of this study included the unavailability of the most recent tax data (currently 2019 tax data).
While the evaluation had allowed sufficient time to update the results of this study before finalizing the current report, the new linked datasets have not yet been validated by Statistics Canada and made available to public researchers. However, the analysis of the repayment cohorts (2007 to 2021) and the 2023 survey have helped to provide accurate data on which to base relevant analyses and conclusions.
Appendix F: The calculation of a complementary measure of debt-to-income ratio (Ri), over the repayment period
For an individual (i) the ratio is equal to the average household income over the repayment years divided by the loan amount at the consolidation years (2010 to 2011).
For this study, the average ratio = 13.0

- i=borrower
- j=number of years the loan has been paid
- Pi=repayment years in which the loan has been paid by a borrwer (i)
- Ri=income to loan ratio
- Yij=household income during the repayment years
- Ci= loan amount
Appendix G: Supplemental Tables and Figures
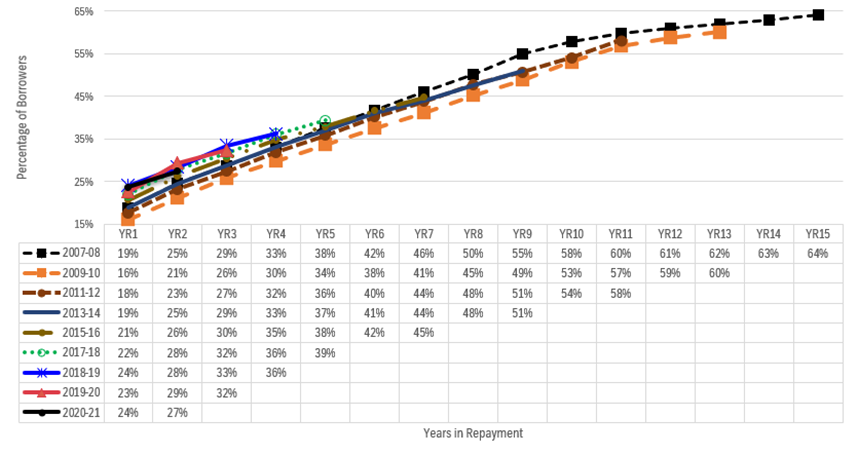
- Source: Canada Student Loan Repayment Patterns: Insights of Administrative Data from 2007 to 2022 (2023)

- Source: Canada Student Financial Assistance Program Administrative Data
The key takeaway is that grant disbursements are the main driver of the increase in total CSFA Program disbursements. The 2 factors that have driven the increase in Canada Student Grants are increased generosity and eligibility expansion.
Breaking down CSFA supports into Canada Student Grants and Canada Student Loans shows that while CSLs have somewhat increased starting in 2017 to 2018, and then peaked in 2020 to 2021 because the weekly loan limit was temporarily increased to $350/week, disbursements of CSLs have declined in 2021 to 2022 and 2022 to 2023 and this is directly related to the increase in Canada Student Grants.
As Canada Student Grants are delivered first, if you increase Canada Student Grants, it decreases Canada Student Loans disbursements all else being equal.

- Source: Canada Student Loan Repayment Patterns: Insights of Administrative Data from 2007 to 2022 (2023)
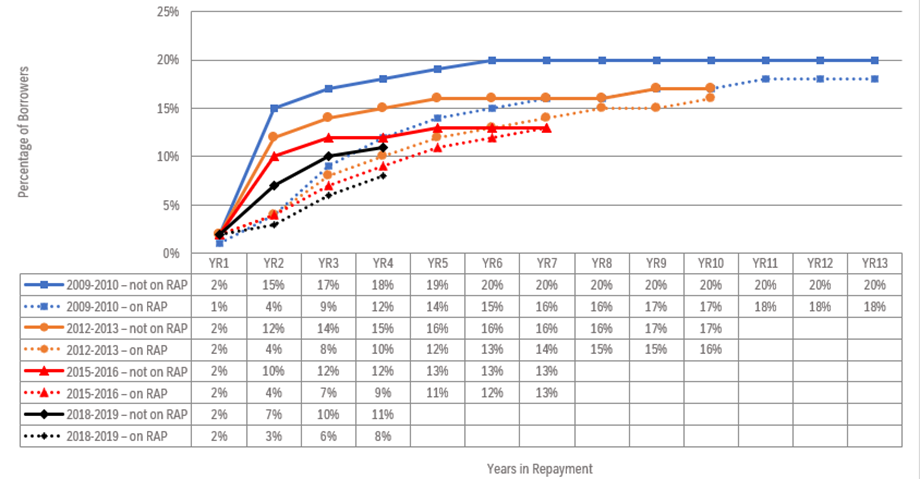
- Source: Canada Student Loan Repayment Patterns: Insights of Administrative Data from 2007 to 2022 (2023)

- Notes:
-
- n Paying without assistance = 237,530; n RAP - Making payments = 46,410
- The repayment-to-income ratio is the average annual repayment divided by the average annual family income during the repayment period.
- This is only for the federal loan repayment portion.
The figure above is based on the linked data analysis of student loan borrowers who consolidated their loan in 2014 to 2015 and were on repayment for one year. Data sources consist of linked CSFA program data with T1FF (2000 to 2018) and PSIS (2009 to 2019).

- Note: Significant levels: * 10%; ** 5%; and *** 1%.
- Source: Evaluation of the Canada Student Financial Assistance (CSFA) Program using National Graduate Survey 2018 (2023)
The Figure G6 above provides the estimated odds ratio derived from the logistic regression model using the 2018 NGS data to assess the likelihood of having difficulty with loan repayment. The dependent variable of the regression is the acquisition of RAP, showing whether the participant showing is having difficulties in repaying their student loan or not.
Regarding the explanatory variables, this study included 17 of the most relevant variables that can explain the likelihood of having difficulty with loan repayment. These variables are gender, marital status, age, region, visible minority status, immigrant status, disability status, having a dependent, parental education (post-secondary), government loan amount at the time of the interview, government loan as main source of funding, grants or bursaries, scholarships, type of study, field of study in 2015, level of education, earnings in 2017.
The odds ratio in a logistic regression compares the likelihood of using the RAP (the dependent variable) occurring in 2 (or more) different predictor categories. One of the categories is set as reference (base) and therefore the odds ratio of a specific category provides the likelihood of the event relative to the reference category.
For example, visible minority status variable has 2 categories which are visible minority and non-visible minority. In this study, non-visible minority is set as reference category and the estimated odds ratio is greater than 1 (1.4226). This result implies that the participants who belong to a visible minority have a higher likelihood of having difficulty with loan repayment compared to the participants who do not belong to a visible minority.
References
Baum, S., & Schwartz, S. (2006). How Much Debt is Too much? Defining Benchmarks for Manageable Student Debt. New York: The College Board.
Dynarski, S. M. (2021). An economist's perspective on student loans in the United States. Human Capital Policy.
Employment and Social Development Canada (ESDC). (2021). Post-Study Survey for the Evaluation of the Canada Student Loans Program - Technical Report.
Employment and Social Development Canada (ESDC). (2023). Canada Student Loan Repayment Patterns: Insights from Administrative Data - Technical report.
Employment and Social Development Canada (ESDC). (2023). Evaluation of the Canada Student Financial Assistance (CSFA) Program using Linked Administrative Data: Technical Report.
Employment and Social Development Canada (ESDC). (2023). Evaluation of the Canada Student Financial Assistance (CSFA) Program using National Graduate Survey 2018.
Employment and Social Development Canada (ESDC). (2023). Focus Groups on Repayment for the Evaluation of the Canada Student Financial Assistance Program: Technical report.
Employment and Social Development Canada (ESDC). (2023). Survey for the Evaluation of the Canada Student Financial Assistance (CSFA) Program: Technical report.
Employment and Social Development Canada (ESDC). (2023). The 2021-2022 Canada Student Financial Assistance Program Annual Report. Government of Canada.
Employment and Social Development Canada (ESDC). (2023). The 2021-2022 Canada Student Financial Assistance Program Statistical Review. Government of Canada.
Employment and Social Development Canada (ESDC). (n.d.). Government of Canada provides interest-free loans for students, effective April 1, 2023. Retrieved from https://www.canada.ca/en/employment-social-development/news/2023/03/government-of-canada-provides-interest-free-loans-for-students-effective-april1.html
Galarneau, D., & Gibson, L. (2020, August 25). Trends in student debt of postsecondary graduates in Canada: Results from the National Graduates Survey, 2018. Ottawa: Statistics Canada.
Gross, J. P., Cekic, O., Hossler, D., & Hillman, N. (2009). What Matters in Student Loan Default: What Matters in Student Loan Default: Journal of Student Financial Aid.
Kapsaline, C. (2006, March). Factors affecting the repayment of student loans. Ottawa: Statistics Canada; Human Resources and Social Development Canada.
Lochner, L. J., Stinebrickner, T., & Suleymanoglu, U. (2013). Analysis of the CSLP Student Loan Defaulter Survey and Client Satisfaction Surveys. London, ON: CIBC Centre for Human Capital and Productivity. CIBC Working Papers, Department of Economics, University of Western Ontario.
Lochner, L., Stinebrickner, T., & Suleymanoglu, U. (2012). Understanding Student Loan Repayment Problems: Evidence from the Canada Student Loans Program.
Lochner, L., Stinebrickner, T., & Suleymanoglu, U. (2021). Parental Support, Savings, and Student Loan Repayment. American Economic Journal: Economic Policy.
Milian, R. P., Zarifa, D., & Seward, B. (2021). Paying back student loans: Demographic, human capital and other correlates of default and repayment difficulty. Higher Education Quarterly.
Office of the Auditor General of Canada. (2020). 2020 Spring Reports of the Auditor General of Canada to the Parliament of Canada - Student Financial Assistance.
Office of the Chief Actuary (OCA). (2021). Actuarial Report on the Canada Student Financial Assistance Program as at 31 July 2021.
Scott-Clayton, J. (2017). What Accounts for Gaps in Student Loan Default, and What Happens After. Evidence Speaks Reports.
Statistics Canada. (2009, December). Canada's employment downturn. Retrieved from Perspectives on Labour and Income: https://www150.statcan.gc.ca/n1/pub/75-001-x/2009112/article/11048-eng.htm#:~:text=Net%20loss%20of%20400%2C000%20jobs%20since%20October%202008,-In%20October%202009&text=One%20key%20feature%20of%20the,in%20the%20same%20age%20group.
Statistics Canada. (2019, February 8). Labour market dynamics since the 2008/2009 recession. Retrieved from Labour Statistics: Research Papers: https://www150.statcan.gc.ca/n1/pub/75-004-m/75-004-m2019001-eng.htm
Statistics Canada. (n.d.). Canadian undergraduate tuition fees by field of study (current dollars). Retrieved from https://www150.statcan.gc.ca/t1/tbl1/en/tv.action?pid=3710000301&pickMembers%5B0%5D=1.1&cubeTimeFrame.startYear=2007+%2F+2008&cubeTimeFrame.endYear=2021+%2F+2022&referencePeriods=20070101%2C20210101
The PEW Charitable Trusts. (2020). Borrowers Discuss the Challenges of Student Loan Repayment.
Usher, A. (2018). The State of Post-Secondary Education in Canada. Toronto: Higher Education Strategy Associates.
Usher, A. (2022). Cross-National Student Loan Repayment Comparisons. Retrieved from Higher Education Strategy Associates: https://higheredstrategy.com/cross-national-student-loan-repayment-comparisons/
Page details
- Date modified: