
Evaluation of the Canada – Ontario Labour Market Development Agreement
On this page
- List of abbreviations
- List of charts
- List of tables
- Executive summary
- Management response
- Introduction
- Canada-Ontario Labour Market Development Agreements
- Methodology
- Evaluation findings
- Supplemental studies
- Conclusions and recommendations
- References
- Appendix A. List of 7 studies included in this synthesis report
Alternate formats

Evaluation of the Canada – Ontario Labour Market Development Agreement [PDF - 1.1 MB]
Large print, braille, MP3 (audio), e-text and DAISY formats are available on demand by ordering online or calling 1 800 O-Canada (1-800-622-6232). If you use a teletypewriter (TTY), call 1-800-926-9105.
List of abbreviations
- EAS
- Employment Assistance Services
- EBSM
- Employment Benefits and Support Measures
- EI
- Employment Insurance
- ESDC
- Employment and Social Development Canada
- JPI
- Job Placement with Incentive
- LMDA
- Labour Market Development Agreement
- LMP
- Labour Market Partnerships
- OJCP
- Ontario Job Creation Partnerships
- SA
- Social assistance
- SD
- Skills Development
List of charts
- Chart i. Change in probability of being employed for participants relative to non-participants (annual average)
- Chart ii. Employment earnings of participants relative to non-participants (annual average)
- Chart iii. Change in dependence on government income support (annual average)
- Chart 1. Change in probability of being employed in participants relative to non-participants (annual average)
- Chart 2. Employment earnings of participants relative to non-participants (annual average)
- Chart 3. Change in the use of EI benefits (annual average)
- Chart 4. Change in the use of SA benefits (annual average)
- Chart 5. Change in dependence on government income support (annual average)
- Chart 6. Average earnings for active claimant participants in SD-Apprentices
- Chart 7. Average earnings for former claimant participants in SD-Apprentices
List of tables
- Table i. Share of LMDA funding and average cost per Action Plan Equivalent per participant in Ontario for 2010 to 2012 period
- Table ii. Number of years for the benefits to exceed program costs
- Table 1. Share of LMDA funding and average cost per Action Plan Equivalent per participant in Ontario
- Table 2. Profile of active and former EI claimants who participated in Ontario's LMDA-funded EBSMs in 2010 to 2012
- Table 3. Employment and earning levels, and use of SA in the year before participation in EBSMs
- Table 4. Profile of female active and former EI participants in Ontario from 2010 to 2012
- Table 5. Incremental impacts for female participants (annual average)
- Table 6. Profile of male active and former EI claimant participants in Ontario from 2010 to 2012
- Table 7. Incremental impacts for male participants (annual average)
- Table 8. Profile of active and former EI claimant youth participants in Ontario from 2010 to 2012
- Table 9. Incremental impacts for youth participants (annual average)
- Table 10. Profile of active and former EI claimant participants who were older workers in Ontario from 2010 to 2012
- Table 11. Incremental impacts for older worker participants in SD, JPI, OJCP and EAS (annual average)
- Table 12. Profile of Indigenous active and former EI claimant participants in Ontario from 2010 to 2012
- Table 13. Incremental impacts for Indigenous participants (annual average)
- Table 14. Profile of active and former EI claimant participants who were persons with disabilities from Ontario in 2010 to 2012
- Table 15. Incremental impacts for persons with disabilities (annual average)
- Table 16. Profile of active and former EI claimant participants who were recent immigrants in Ontario from 2010 to 2012
- Table 17. Incremental impacts for recent immigrants (annual average)
- Table 18. Profile of active and former EI claimant participants who were visible minorities in Ontario from 2010 to 2012
- Table 19. Incremental impacts for visible minority participants (annual average)
- Table 20. Cost-benefit results for active and former EI claimant participants
- Table 21. Profile of active and former EI claimant participants in SD-Apprentices programs in Ontario from 2010 to 2012
Executive summary
The Canada-Ontario Labour Market Development Agreement (LMDA) is a bilateral agreement between Canada and Ontario for the design and delivery of Employment Benefits and Support Measures (EBSMs).
The objective of EBSMs is to assist individuals to obtain or keep employment through various active employment programs, including training or employment assistance services. Successful delivery of EBSMs is expected to result in participants receiving needed services, a quick return to work, and savings to the Employment Insurance (EI) account.
Programs and services delivered by provinces and territories have to correspond to the EBSM categories defined under the EI Act. The following is a short description of the EBSMs examined in the evaluation of the Canada-Ontario LMDA:
- Skills Development (SD) helps participants obtain employment skills by giving them financial assistance in order select, arrange, and pay for training
- Job Placement with Incentive (JPI) helps participants obtain on-the-job work experience by providing employers with a wage subsidy
- Ontario Job Creation Partnerships (OJCP) support projects that provide eligible participants with opportunities to gain meaningful work experience while providing community benefit
- Employment Assistance Services (EAS) such as job search services, career development and counselling, and résumé writing assistance support individuals as they prepare to enter or re-enter the workforce or assist them to find a better job
- Labour Market Partnerships assist employers, communities and/or industries to address their labour force adjustments and human resource needs by enabling employers, employee or employer associations, community groups, and communities to work together to develop or implement strategies
- Research and Innovation supports innovation in the employment and training system and the exploration of new ways to provide employment and training supports for job seekers, workers and employers including for those not currently supported through the LMDA
The LMDA investment
In fiscal year 2020 to 2021, Canada transferred $741 million (including about $57 million in administration funds) to Ontario.
Table i provides an overview of the share of funding allocated to EBSMs and the average cost per participant. The average cost per participant is calculated based on the 2010 to 2012 data from the EI Monitoring and Assessment Reports. The 2010 to 2012 period corresponds with the cohort of participants selected for incremental impacts and cost-benefit analysis.
| Employment Benefits and Support Measures | Average share of funding | Average cost – active claimants | Average cost – former claimants |
|---|---|---|---|
| Skills Development | 43% | $12,250 | $10,983 |
| Employment Assistance Services | 46% | $3,342 | $2,924 |
| Labour Market Partnerships | 3% | n/a | n/a |
| Job Placement with Incentive | <1% | $6,310 | $5,241 |
| Ontario Job Creation Partnerships | 1% | $14,660 | $11,886 |
| Research and Innovation | 0% | n/a | n/a |
| Total | 93% | n/a | n/a |
- Sources: EI Monitoring and Assessment Reports for fiscal years 2010 to 2011, 2011 to 2012, and 2020 to 2021.
- Note: Total spending do not add up to 100% due to rounding. Self-employment programming accounted for 7% of spending in the 2010 to 2012 period.
Compared to the 2010 to 2012 period, there was variation in the LMDA budget allocation of some programs and services in 2020 to 2021. For example, investments in SD deceased from 43% to 24%, while those in Research and Innovation increased from 0% to 14%.
Evaluation objectives
Building on the success of previous LMDA evaluation cycles, the aim of this evaluation is to fill in knowledge gaps about the effectiveness, efficiency, as well as and design and delivery of EBSMs in Ontario.
Evaluation methodology
The findings in this report are drawn from 7 separate evaluation studies carried out at the provincial level. These studies examine issues related to program effectiveness, efficiency, and design and delivery. A mix of qualitative and quantitative methods are used, including:
- incremental impact analysis for participants who began an intervention between 2010 and 2012
- outcome analysis
- cost-benefit analysis (including savings to health care)
- key informant interviews with 31 provincial representatives, service providers, agreement holders and key stakeholders
- questionnaires completed by provincial officials
- document and literature reviews
The incremental impacts are estimated for 2 types of EI claimants:
- active EI claimants are participants who started an EBSM intervention while collecting EI benefits
- former EI claimants are participants who started an EBSM intervention up to 3 years after the end of their EI benefitsFootnote 3
Key findings
Nearly 411,800 EI active and former claimants began participating in Canada-Ontario LMDA programs and services between 2010 and 2012.
Effectiveness and efficiency of EBSMs
Overall, incremental impacts demonstrate that participation in most EBSMs improves labour market attachment and reduces dependence on government income support compared to similar non-participants. This excludes former claimants who participated in SD.
With the exception of former claimants who participated in SD, these results are consistent with those found for earlier cohorts of participants as part of the previous evaluation cycle.
A subgroup analyses shows that, with some exceptions:
- SD and EAS improved the labour market attachment and reduced the dependence on income support for most subgroups of active EI claimant participants
- JPI improved the labour market attachment and reduced the dependence on income support for female, male, and youth former claimant participants
- OJCP improved the labour market attachment and reduced the dependence on income support for female active claimant participants, but had mixed results for former claimants
Over time, the social benefits of participating in JPI, OJCP and EAS exceeded the initial investment costs for program participants. However, it takes 19.1 years to recover the initial investment in SD for active claimants. The investments in SD for former claimants may not be recovered Footnote 4
Chart i presents the incremental impacts on the incidence of employment for active and former claimants by EBSM. The estimates can be interpreted as a change in the probability of being employed following participation. For example, participation in SD increases the probability of being employed by 4.3 percentage points for active EI claimants relative to similar non-participants.

- Note: Impacts are estimated over 4 post-program years (or 5 years in the case of EAS).
- * The impacts are not statistically significant over the entire post-program period.
Chart i text description
| Program name | Incidence of employment for active claimants (percentage points) | Incidence of employment for former claimants (percentage points) |
|---|---|---|
| Second Career | 4.3 | -0.9* |
| Employment Services | 3.7 | n/a |
| Job Placement with Incentive | 5.5 | 4.2 |
| Ontario Job Creation Partnerships | 9.4 | 0.8* |
- Note: Impacts are estimated over 4 post-program years (or 5 years in the case of EAS).
- * The impacts are not statistically significant over the entire post-program period.
Chart ii presents the annual average increase in employment earnings for active and former claimants over the post-participation period. For example, active EI claimants who participated in SD earned, on average, $943 more than similar non-participants.

- Note: Impacts are estimated over 4 post-program years (or 5 years in the case of EAS).
Chart ii text description
| Program name | Employment earnings of active claimants | Employment earnings of former claimants |
|---|---|---|
| Second Career | $943 | -$1,022 |
| Employment Services | $1,008 | n/a |
| Job Placement with Incentive | $2,843 | $2,348 |
| Ontario Job Creation Partnerships | $3,470 | $1,339 |
- Note: Impacts are estimated over 4 post-program years (or 5 years in the case of EAS).
Chart iii presents the change in dependence on government income support for active and former claimants over the post-participation period. For example, active EI claimants who participated in SD reduced their dependence on government income support by 1.7 percentage points.

- Note: Impacts are estimated over 4 post-program years (or 5 years in the case of EAS).
- * The impacts are not statistically significant over the entire post-program period.
Chart iii text description
| Program name | Dependence on government income support for active claimants (percentage points) | Dependence on government income support for former claimants (percentage points) |
|---|---|---|
| Second Career | -1.7 | -0.2* |
| Employment Services | -1.6 | 0 |
| Job Placement with Incentive | -1.8 | -2.6 |
| Ontario Job Creation Partnerships | -4.6 | -0.3* |
- Note: Impacts are estimated over 4 post-program years (or 5 years in the case of EAS).
- * The impacts are not statistically significant over the entire post-program period.
Table ii presents the number of years required for the social benefits to exceed program costs. Social benefits to participation exceed initial investment costs over a period ranging from less than a year to 19.1 years.
| Indicator | SD active claimants (10 years post-program) | JPI active claimants (5 years post-program) | OJCP active claimants (5 years post-program) | EAS active claimants (5 years post-program) | JPI former claimants (5 years post-program) | OJCP former (5 years post-program) |
|---|---|---|---|---|---|---|
| Payback period (years after end of participation) | 19.1 | 1.6 | 5.9 | 7.7 | <11 | 12.4 |
- 1 Paid back within the program start year.
Supplemental studies
A series of supplemental studies addresses information gaps previously identified in LMDA evaluations regarding the design and delivery, challenges and lessons learned for OJCP, Labour Market Partnerships and Research and Innovation.
Excluding OJCP, these interventions are not suitable for incremental impact analysis. For example, Labour Market Partnerships and Research and Innovation do not collect participant information. As a result, a mix of qualitative and quantitative methods are used to examine these EBSMs in detail. When relevant, key considerations are included to help guide future program and policy discussions.
Ontario Job Creation Partnerships study
The design and delivery of OJCP allows the Ontario to address a variety of barriers to employment experienced by its residents. OJCP can also be used to address labour market needs by targeting sub-groups of individuals, in-demand professions or economic sectors, and specific communities.
In addition to gaining work experience, key informants identified a variety of other benefits that can be expected from OJCP projects. For example, participants are expected to develop work-related skills, enhance their job search abilities and improve their personal well-being.
Project holders can benefit from OJCP by increasing their organizational capacity, implementing their projects and expanding the portfolio of services they provide. At the community level, projects can support the local economy and provide new assets, such as restored infrastructure and new recreational spaces.
Labour Market Partnerships study
The Labour Market Partnerships program(s) aim to assist employers, communities and/or industries to address their labour force adjustments and human resource needs. Funded projects target current and/or forecasted skills and/or labour shortages. These projects also target unemployment in specific subpopulations such as women, youth, Indigenous people, newcomers, persons with disabilities, the self-employed, and those who will soon be laid-off.
Ontario program officials confirmed that regional/local program officials carried out activities to support the formation and maintenance of partnerships (with sector and community stakeholders) as a part of the LMP programs design and delivery. Key informants noted that partners' expertise, network and financial contribution are all essential or beneficial to project implementation and success.
Research and Innovation study
In Ontario, Research and Innovation is used to enable innovation in the employment and training system and to explore new ways of providing employment and training supports to employers, workers, and job seekers, including those who are not currently supported by other LMDA funded programs and services.
The document review revealed that Research and Innovation projects encompassed a variety of activities including:
- developing new tools and approaches to meet the labour market needs of employers and job seekers
- supporting labour force development projects in remote Indigenous communities
- supporting employer-driven training
- pilot projects implementing and assessing new training and skills development approaches
- academic research on labour market outcomes
Provincial/territorial questionnaires reveal factors contributing to successful testing and identification of innovative approaches, including:
- tailoring approaches to particular sectors
- developing strategic partnerships between organizations in different sectors, including workforce development service providers, post-secondary institutions, and employers
Skills Development-Apprentices study
The objective of the program is to help apprentices become skilled tradespeople and to increase their labour market attachment. Program participants have generally chosen a career and are already attached to the labour market. The apprenticeship process involves on-the-job learning and technical training in a classroom setting.
The evaluation found that active EI claimants increased their average earnings from $18,448 in the fifth year pre-program to $56,257 in the fifth year after the program start year. Former EI claimants increased their average earnings from $20,125 in the fifth year pre-program to $55,581 in the fifth year after the program start year. After participating in the program, both active and former claimants also decreased their dependence on government income support.
Recommendations
Since 2012, 15 qualitative and quantitative studies addressed issues and questions related to EBSM design, delivery and effectiveness. The quantitative studies successfully assessed the effectiveness and efficiency of EBSMs by producing incremental impacts and cost-benefit analysis. The qualitative studies identified specific challenges, lessons learned and best practices associated with the design and delivery of EBSMs. Each study included key considerations for program and policy development or recommendations.
In addition, the recently completed evaluation of the Workforce Development Agreements complements the LMDA qualitative studies. This evaluation was also supported by literature reviews and provided unique insights into challenges and lessons learned to assist persons with disabilities, immigrants and those further removed from the labour market.
Most results from this evaluation stem from the conduct of advance causal analysis whereby impacts found could be attributed to a specific EBSM. These analyses are predicated on having access to high quality administrative records, thereby confirming the importance of the capacity to leverage and integrate relevant administrative data.
From these main findings, 2 key recommendations emerge.
Recommendation #1
Ontario is encouraged to share and discuss lessons learned, best practices and challenges associated with the design and delivery of programs and services. Discussions are encouraged with ESDC, at the bilateral or multilateral levels as well as with service delivery network if necessary.
Recommendation #2
Ontario is encouraged to pursue efforts to maintain and strengthen data collection provisions in support of reporting, performance measurement and data-driven evaluations at the national and provincial levels.
Management response
Introduction
Ontario thanks the Evaluation Directorate of ESDC and the Evaluation Steering Committee for their diligence, dedication and commitment towards the third cycle of the evaluation process. As before, Ontario worked in close collaboration with the Evaluation Directorate of ESDC during the planning and implementation of the third cycle for the Labour Market Development Agreement (LMDA) evaluation.
The findings from the 7 qualitative and quantitative studies on Employment Benefits and Support Measures (EBSM) provide valuable insights and guidance for program development and efforts are under way to incorporate necessary changes and further refinements in data collection and data sharing protocols.
Ontario reviewed and agrees with the findings of the third cycle evaluation of the Canada-Ontario LMDA, which concluded that:
- overall, incremental impacts demonstrate that participation in most EBSMs improves labour market attachment and reduces dependence on government income support compared to similar non-participants. This excludes former claimants who participated in Skills Development (SD)
- with the exception of former claimants who participated in SD, these results are consistent with those found for earlier cohorts of participants as part of the previous evaluation cycle
- a subgroup analysis shows that, with some exceptions:
- SD and EAS improved the labour market attachment and reduced the dependence on income support for most subgroups of active EI claimant participants
- Job Placement with Incentive (JPI) improved the labour market attachment and reduced the dependence on income support for female, male, and youth former claimant participants
- Ontario Job Creation Partnership (OJCP) improved the labour market attachment and reduced the dependence on income support for female active claimant participants but had mixed results for former claimants
- over time, the social benefits of participating in JPI, OJCP and EAS exceeded the initial investment costs for program participants. However, it takes 19.1 years to recover the initial investment in SD for active claimants. The investments in SD for former claimants may not be recoveredFootnote 5
Ontario submits the management responses below to the recommendations in the report:
Management response to key recommendations
Recommendation #1
Ontario is encouraged to share and discuss lessons learned, best practices and challenges associated with the design and delivery of programs and services. Discussions are encouraged with ESDC, at the bilateral or multilateral levels as well as with service delivery network if necessary.
Management response
- Ontario agrees with the recommendation on the importance of sharing best practices, lessons learned, and challenges associated with the design and delivery of labour market programs
- Ontario will continue to share many of its best practices through the Forum of Labour Market Ministers. Additionally, Ontario will continue engaging in regular bilateral meetings of the Workforce Development Committee to assist with sharing information on an ongoing basis with ESDC
- Ontario looks forward to working with ESDC and the provinces and territories (P/Ts) to help to ensure the P/Ts can work together on design, delivery and evaluation of their programs and services, and learn from each other's experiences
Recommendation #2
Ontario is encouraged to pursue efforts to maintain and strengthen data collection provisions in support of reporting, performance measurement and data-driven evaluations at the national and provincial levels.
Management response
- Ontario agrees with the focus on improved data collection, reporting and performance measurement. Ontario has developed and implemented new tools to improve data collection and monitoring:
- new digital intake tools, such as the Common Assessment Tool, that improve Ontario's ability to collect important client profile information, such as life stability, self-efficacy, education/employment, disability status, and inclusion group membership
- new outcome tracking, such as the Employment Status Questionnaire (ESQ), to improve Ontario's collection of standardized outcome measures for clients of employment and training programs
- Ontario will work together with ESDC to improve data collection efforts and enhance client-level data sharing, data linking and analyses so that both are strategically aligned and complement evaluation and continuous improvement of labour market systems and programs funded through the LMDA
- Ontario supports sharing data at the national and P/T levels to provide guidelines and help determine benchmarks and will collaborate with ESDC and other P/Ts to enable this work
- The recommendation is also satisfied in part via compliance with post-2017 performance measurement framework
Conclusion
LMDAs are the main annual investment in active labour market programs and services in Canada and the evaluation report provides critical insights on how the effectiveness, efficiency, design and delivery of EBSMs can be further improved.
Ontario is committed to making continuous improvements in the planning, design, and delivery of EBSMs so that it continues to enable individuals to be gainfully employed and benefit from training and employment assistance services as needed.
Introduction
Employment and Social Development Canada (ESDC) worked jointly with Ontario and 11 other provinces and territories to carry out the 2018 to 2023 third cycle for the evaluation of the Labour Market Development Agreements (LMDA).
The first LMDA evaluation cycle was carried out from 1998 to 2012 and focused on federally delivered programs and services in Ontario.
Building on lessons learned and best practices from the first cycle, the second cycle of LMDA evaluations was undertaken between 2012 and 2017. The second cycle was designed and implemented under the guidance of a federal-provincial/territorial LMDA Evaluation Steering Committee. The work was supported by bilateral discussions at the Joint Evaluation Committee.
The third LMDA evaluation cycle builds on the success of the second cycle. The aim is to fill in knowledge gaps about the effectiveness, efficiency, and design and delivery of EBSMs. The evaluation cycle was also designed and implemented under the guidance of a federal-provincial/territorial LMDA Evaluation Steering Committee composed of ESDC and 12 participating provinces and territories.
This report presents a summary of the third cycle evaluation findings from 7 studies undertaken as part of the third LMDA evaluation cycle.
Canada-Ontario Labour Market Development Agreement
The Canada-Ontario LMDA is a bilateral agreement between Canada and Ontario for the design and delivery of EBSM programs and services. It was established, along with similar agreements with 12 other provinces and territories, under Part II of the 1996 Employment Insurance (EI) Act.
In fiscal year 2020 to 2021, Canada transferred nearly $741.4 million to Ontario.Footnote 6 Under the agreement, Ontario is responsible for the design and delivery of LMDA-funded programs and services aimed at assisting individuals to prepare for, obtain, and maintain employment.
LMDA programs and services are classified under 2 categories:
- Employment benefitsFootnote 7, Footnote 8 fall into 4 subcategories:
- Skills Development
- Job Placement with Incentive
- Self-Employment
- Ontario Job Creation Partnerships
- Support measures fall into 3 subcategories:
- Employment Assistance ServicesFootnote 9
- Labour Market Partnerships
- Research and Innovation
Ontario has the flexibility to adapt EBSMs to its provincial context as long as they are consistent with Part II of the EI Act.Footnote 10
The objective of EBSMs is to assist individuals to obtain or keep employment through various active employment programs, including training or employment assistance services. Successful delivery of EBSMs is expected to result in participants receiving needed services, a quick return to work, and savings to the EI account.
Employment benefits
Employment benefits programs and services examined in this study include:
Skills Development (SD) provides direct financial assistance to individuals to select, arrange, and pay for training. Training is tailored to the needs of participants through counselling and career orientation. It can include adult-based education, literacy and essential skills, language training, short-term training and occupational training leading to certification from an accredited institution.
Job Placement with Incentive (JPI) helps participants obtain on-the-job work experience by providing employers with a wage subsidy. The subsidies can range in duration from 16 to 52 weeks, with the maximum level of the subsidy ranging from 50% to 100% of the employee's wage.
Ontario Job Creation Partnerships (OJCP) support projects that provide eligible participants with opportunities to gain meaningful work experience while providing community benefit. Participants can take part in a finite project for up to 52 weeks.
Support measures
Support measures programs and services examined in this study include:
Employment Assistance Services (EAS) include a variety of services that support individuals as they prepare to enter or re-enter the workforce or assist them to find a better job. Services can include job search services, career development and counselling, and résumé writing assistance. These services are referred to as light touch interventions due to their very short duration. They can be provided on a one-on-one basis; or in a group setting. A typical intervention lasts less than 1 day, but a participant may receive multiple short interventions over a few weeks. These services are generally provided in combination with more intensive Employment Benefit interventions. Services may also include case-management, which can have a longer duration.
Labour Market Partnerships assist employers, communities and/or industries to address their labour force adjustments and human resource needs. They include a wide range of funded activities, such as:
- labour market and human resource research
- raising awareness about labour market and human resources information and best practices
- employment services and workforce development planning activities
- employment and training service coordination for employers
- employer-led skills development training
- labour force adjustment services
- Activities to improve the quality and quantity of experiential learning opportunities available to undergraduate and graduate students
Research and Innovation is used to enable innovation in the employment and training system and to explore new ways to provide employment and training supports for job seekers, workers and employers including for those not currently supported through the LMDA.
Eligible participants covered in this study
The incremental impacts are estimated for active and former EI claimants:
- active claimants are participants who started an EBSM intervention while collecting EI benefits
- former claimants are participants who started an EBSM intervention up to 3 years after the end of their EI benefitsFootnote 11
Average EBSM share of funding and cost per Action Plan Equivalent
Table 1 provides an overview of the share of funding allocated to EBSMs and the average cost per participant. It is noted that the average cost per participant is calculated based on the 2010 to 2012 data from the EI Monitoring and Assessment Reports. The 2010 to 2012 period corresponds with the cohort of participants selected for incremental impacts and cost-benefit analysis in the Canada-Ontario LMDA evaluation.
From the 2010 to 2012 time period to the 2020 to 2021 fiscal year, investments in SD decreased by 19 percentage points. The largest increases in funding are noted for Research and Innovation (+14 percentage points) and Labour Market Partnerships (+8 percentage points).
| Employment Benefits and Support Measures | Share of funding (2010 to 2012) | Share of funding (2020 to 2021) | Average cost – active claimants (2010 to 2012) | Average cost – former claimants (2010 to 2012) |
|---|---|---|---|---|
| Skills Development | 43% | 24% | $12,250 | $10,983 |
| Employment Assistance Services | 46% | 50% | $3,342 | $2,924 |
| Labour Market Partnerships | 3% | 11% | n/a | n/a |
| Job Placement with Incentive | <1% | 0% | $6,310 | $5,241 |
| Ontario Job Creation Partnerships | 1% | <1% | $14,660 | $11,886 |
| Research and Innovation | 0% | 14% | n/a | n/a |
| Total | 93% | 100% | n/a | n/a |
- Sources: EI Monitoring and Assessment Reports for fiscal years 2010 to 2011, 2011 to 2012, and 2020 to 2021
- Note: Total spending do not add up to 100% due to rounding. Self-employment programming accounted for 7% of spending in the 2010 to 2012 period.
Methodology
This section presents key aspects of the quantitative analyses carried out as part of the LMDA studies.
All quantitative analyses are based on administrative data from the EI Part I (EI claim data) and Part II (EBSM participation data). The EI Part I and II data are then linked to the T1 and T4 taxation files from the Canada Revenue Agency. Incremental impact and cost-benefit analyses are based on up to 100% of participants in Ontario who began their EBSM participation in 2010 to 2012.
The 2010 to 2012 timeframe was selected in order to assess the impacts of EBSMs in the years following participation. Impacts were assessed over a period of at least 4 years after program completion up to the 2017 calendar year (most recent available information at the time of this evaluation).
Incremental impacts analysisFootnote 14
Program effectiveness is assessed by estimating incremental impacts from EBSM participation on participants' labour market experience. That is, earnings from employment and self-employment, incidence of employment, use of EI, use of social assistance (SA), and dependence on government income support after participation.
The role of the incremental impact analysis is to isolate the effects of participation from other factors. In order to achieve this, the incremental impact analysis compares the labour market experience of participants before and after their participation with that of similar non-participants. Figure 1 presents an example of incremental impact calculation.

Text description - Figure 1
Incremental impacts are the difference in the pre-post participation outcomes between participants and similar non-participants.
For example:
- if the average annual earnings of participants are $30,000 before participation and $38,000 after participation, the change in earning for participants is an increase of $8,000
- if the average annual earnings in the comparison group are $31,000 before participation and $36,000 after participation, the change in earnings for the comparison group is an increase of $5,000
- the incremental impact, that is the change attributed to program participation, is $8,000 minus $5,000, which equals an increase of $3,000
The main estimator used is propensity score kernel matching technique combined with difference-in-differences estimator. Moreover, 3 different state-of-the-art estimation techniques (Inverse Probability Weighting, Nearest Neighbour and Cross-sectional Matching) were carried out separately for each type of EBSMs and EI claimants in order to validate the impact estimates.
As for previous LMDA evaluation studies, the Action Plan Equivalent is the unit of analysis used. Action Plan Equivalents regroup all EBSMs received by an individual within less than 6 months between the end of one EBSM and the start of the next. Action Plan Equivalents are categorized based on the longest EBSM they contain, except for EAS-only Action Plan Equivalents which include only EAS interventions.
The analysis includes Action Plan Equivalents that consist only of LMDA interventions. Action Plan Equivalents that include a combination of LMDA and other labour market programs funded by ESDC, were excluded from the participant sample.
The matching of participants and comparison group members used up to 75 socio-demographic and labour market variables observed over 5 years before participation.Footnote 15 Two different comparison groups were used to measure impacts for active and former EI claimants.
For active claimants, incremental impacts were measured relative to a comparison group of active claimants who were eligible to, but did not, participate in EBSMs during the reference period.
For former claimants, the comparison group was created using individuals who participated in EAS only during the reference period.Footnote 16 In other words, the experience of former claimants in SD, JPI, or OJCP interventions is compared to the experience of former claimants who only received EAS. This is a conservative approach given the fact that participation in an EAS-only intervention can lead to limited effects on labour market outcomes.
Due to this difference in measurement, incremental impacts estimated for active claimant participants should not be directly compared to those of former claimant participants.
Impacts are generated over 4 years for SD, JPI, and OJCP, while a fifth year is estimated for participants in EAS.Footnote 17
Factors accounted for in the cost-benefit analysisFootnote 18,Footnote 19
Building on the results of the incremental impacts, program efficiency is assessed through a cost-benefit analysis. The analysis compares the participants' cost of participating and the government's cost of delivering the program to the benefits associated with the program. Overall, this analysis provides insights on the extent to which the program is efficient for the society (that is, for both participants and the government).
Sources of data and information
The analysis takes into account all the quantifiable costs and benefits directly related to EBSM delivery and participation that can be measured given the information available. The analysis is comprehensive in that it accounts for the vast majority of possible direct costs and benefits.
However, the analysis does not account for all costs and benefits. For example, there are factors that can lead to an understatement of the benefits (for example, positive spillovers to other family members) and other factors that can lead to an overstatement of the benefits (for example, effects on skill prices or displacement).Footnote 20
This study relied on integrated data from the EI Part I and II Databank and Income Tax records from the Canada Revenue Agency. Information about earnings, use of EI, and use of SA was taken from the study of incremental impacts.Footnote 21 The program costs were calculated using information available in the EI Monitoring and Assessment Reports.
Relative to the previous cycle of evaluation, the methodology has been extended to incorporate one of the indirect health benefits associated with increased labour market attachment. In particular, the methodology includes an estimate of the change in public health care cost due to the decline in health care utilization resulting from program participation.
Data on average public healthcare costs by income quintile are taken from the report Lifetime Distributional Effects of Publicly Financed Health Care in Canada (2013) by the Canadian Institute for Health Information.
Program costs are measured using information on LMDA expenditures and new interventions reported in the EI Monitoring and Assessment Report. Other costs and benefits are assessed using integrated administrative data from the EI Part I and II databank and the Canada Revenue Agency.
Incremental impacts measured over the second year of participation and up to 5 post-program years are discounted by 3% to bring them to a common base with the program cost and benefits incurred in the program start year. This 3% rate accounts for the interest the government could have collected if the funds used to pay for the program had been invested. Incremental impacts are estimated using 2010 constant dollars and this accounts for inflation.
Costs and benefits accounted for in the calculations
Program cost: cost incurred by the government for delivering the program (that is, administration and direct program costs calculated from data reported in the EI Monitoring and Assessment Reports).
Marginal social cost of public funds: loss incurred by society when raising additional revenues such as taxes to fund government spending. The value is estimated at 20% of the program cost, sales taxes, income taxes, impacts on EI and impacts on SA paid or collected by the government.
Foregone earnings: estimated net impacts on participants' earnings during the participation period. During labour market program participation, some individuals have lower earnings than what they would have received if they had not participated.
Employment earnings: incremental impacts on participants' earnings during and after participation. In-program earnings represent the foregone earnings for participants.
Fringe benefits: the employer-paid health and life insurance as well as pension contributions. They are estimated at 15% of the incremental impacts on earnings.
Federal and provincial income taxes: incremental impacts on federal, provincial and territorial taxes paid by participants.
Sales taxes: the sales taxes paid by participants estimated as incremental impacts on earnings multiplied by the propensity to consume (97%), the proportion of household spending on taxable goods and services (52%) and the total average federal and provincial sales tax rate (11%).
Social assistance and Employment Insurance benefits collected: incremental impacts on SA and EI benefits use by participants following participation.
Canada Pension Plan contribution and Employment Insurance premiums: these contributions and premiums were identified from the Canada Revenue Agency data and then, the incremental impacts on Canada Pension Plan contributions and EI premiums were estimated.
Public health care costs savings: estimated impact of participation in EBSMs on public health care costs shown as an average change per participant over the post-program period examined.
Strengths and limitations of the studies
One of the key strengths from the studies is that all quantitative analyses are based on administrative data rather than survey responses. Compared to survey data, administrative data are not subject to recall errors or response bias.
The propensity score models used to match participants and non-participants for the incremental impact analyses are judged to be robust. In part this is because they were based on 5 years of pre-participation data. Moreover, these models are based on a vast array of variables including sociodemographic characteristics, location, skill level related to last occupation, and indicators of labour market attachment.
However, the matching process can be further refined for specific subgroups if the following information is available in the future:
- persons with disabilities: the type and severity of the disability, and the capacity/willingness to work full-time
- recent immigrants: the country of origin, the proficiency in English or French, and the relevance of credentials and work experience
- visible minorities: place of birth; individuals who are born outside of Canada face different challenges compared to those born in Canada
Refining the matching process for population subgroups could broaden the scope for greater Gender-based Analysis Plus.
Sensitivity analysis and the use of alternative estimation methods have increased confidence in the incremental impact estimates. However, a limitation with the propensity score matching techniques is that no one can be fully sure the impacts are not influenced by factors not captured in the data.
The cost-benefit analysis accounted for all quantifiable costs and benefits directly attributable to the EBSMs and could be estimated with the available administrative data. It is further strengthened by incorporating one of the indirect benefits, which is the change in public health care expenditures associated with program participation. However, the analysis did not account for non-quantifiable factors that can lead to an understatement of the benefits (for example, positive spillovers to other family members) and factors that can lead to an overstatement of the benefits (for example, effects on skill prices or displacement).
In some studies that use qualitative data collection methods, the number of key informants interviewed is relatively small. Responses provided by key informants reflect their own experience and their own region and may not be fully representative of the entire province.
Overview of the studies summarized in this report
The findings in this report are drawn from 7 separate studies:
- Examination of the medium-term outcomes from 2010 to 2017
- Estimation of the medium-term incremental impacts from 2010 to 2017
- Cost-benefit analysis of Employment Benefits and Support Measures in Ontario
- Cost-Benefit Analysis: Incorporating Public Health Care Costs Savings in the Context of the Labour Market Programs Evaluation
- Design and delivery of the Ontario Job Creation Partnerships program
- Design and delivery of the Labour Market Partnerships program
- Design and delivery of the Research and Innovation support measure
Using a mix of qualitative and quantitative methods, these studies examine issues related to program effectiveness, efficiency, and design/delivery. Appendix A presents an overview of each study.
Evaluation findings
Profile of participants
Between 2010 and 2012, nearly 152,000 EI active and former claimants participated in LMDA-funded programs and services in Ontario.
The profile of participants is presented in Table 2 by gender, age, sociodemographic group, and marital status. Information about their educational attainment, occupation and industry is based on the last job they held prior to applying for EI Part 1 benefits. Information about sociodemographic groups is self-reported.
| Categories | Active claimants | Former claimants |
|---|---|---|
| Number of participants | 86,885 | 65,104 |
| Gender: Female | 50% | 51% |
| Gender: Male | 50% | 49% |
| Age: 30 and under | 23% | 26% |
| Age: 31 to 54 | 65% | 62% |
| Age: 55 and over | 12% | 12% |
| Sociodemographic group: Indigenous people | 2% | 3% |
| Sociodemographic group: Persons with disabilities | 4% | 6% |
| Sociodemographic group: Visible minorities | 4% | 6% |
| Sociodemographic group: Recent immigrants | 5% | 5% |
| Marital status: Single | 35% | 39% |
| Marital status: Married or common-law | 46% | 42% |
| Marital status: Widow / divorced / separated | 15% | 14% |
| Education or skills level: High school or occupational training | 40% | 41% |
| Education or skills level: On-the-job training | 20% | 24% |
| Education or skills level: College, vocational education or apprenticeship training | 26% | 24% |
| Education or skills level: University degree | 6% | 5% |
- * Values may not equal 100% due to rounding or missing information.
Top 3 occupational groups for EBSMs participantsFootnote 22
Active claimants:
- clerical personnel = 16%
- semi-skilled manual workers = 15%
- other manual workers = 13%
Former claimants:
- clerical personnel = 16%
- semi-skilled manual workers; and other manual workers = 14% each
- intermediate sales and service personnel = 11%
Top 3 industries for EBSMs participants
Active claimants:
- manufacturing = 17%
- administrative and support, waste management and remediation services = 14%
- retail trade = 10%
Former claimants:
- manufacturing = 18%
- administrative and support, waste management and remediation services = 15%
- retail trade = 10%
As presented in Table 3, in the year before program participation, former claimants had lower levels of employment and earnings than active claimants. Former claimants also had a higher use of SA.
| Pre-EBSM participation employment characteristics | Active claimants | Former claimants |
|---|---|---|
| Average employment earnings | $26,534 | $11,634 |
| Percentage employed | 99% | 79% |
| Percentage on SA | 7% | 17% |
Incremental impacts for active and former EI claimants
Main findings
Overall, incremental impacts demonstrate that participation in most EBSMs improves labour market attachment and reduces dependence on government income support compared to similar non-participants. This excludes former claimants who participated in SD.
With the exception of former claimants who participated in SD, the incremental impact results presented below are generally consistent with those found as part of the second LMDA evaluation cycle.
The incremental impacts presented in this report compare the change in incidence of employment, earnings, use of EI and SA benefits, and dependence on government income support from the pre-program participation period to the post-program participation period for participants relative to similar non-participants. The results reflect the difference between the pre to post-participation change for participants and the change for similar non-participants.
The pre-participation period consists of the 5 years before participation and the post-participation period consists of the 4 years after participation (5 years in the case of EAS).
Incidence of employment
Chart 1 presents the incremental impacts on the incidence of employment for active and former claimants by type of program.Footnote 23 The estimates can be interpreted as a change in the probability of being employed following participation.
Active claimants in SD, EAS, JPI and OJCP increased their incidence of employment relative to similar non-participants. Former claimants in JPI increased their incidence of employment relative to similar participants who only received EAS.Footnote 24
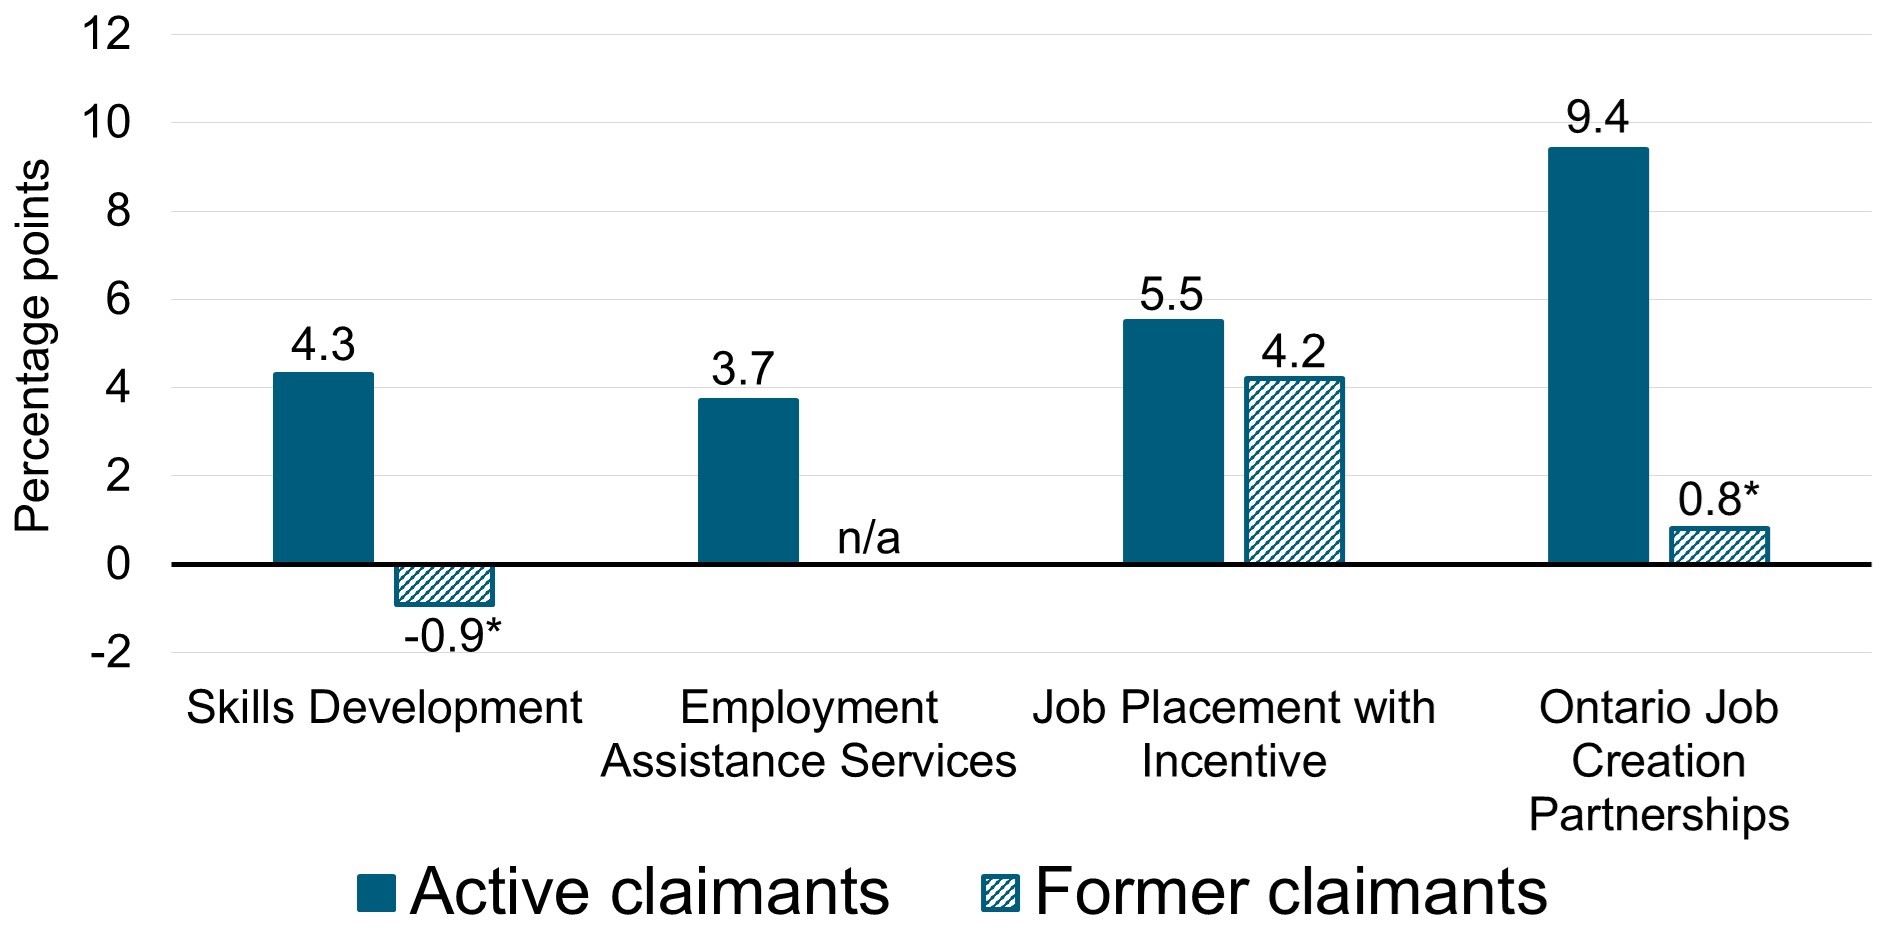
- Note: Impacts are estimated over 4 post-program years (or 5 years in the case of EAS).
- * The impact is not statistically significant over the entire post-program period.
Chart 1 text description
| Program name | Incidence of employment for active claimants (percentage points) | Incidence of employment for former claimants (percentage points) |
|---|---|---|
| Second Career | 4.3 | -0.9* |
| Employment Services | 3.7 | n/a |
| Job Placement with Incentive | 5.5 | 4.2 |
| Ontario Job Creation Partnerships | 9.4 | 0.8* |
- Note: Impacts are estimated over 4 post-program years (or 5 years in the case of EAS).
- * The impact is not statistically significant over the entire post-program period.
Employment earnings
Chart 2 presents the average annual change in employment earnings for active and former EI claimants over the 4 years post-participation (5 years in the case of EAS). Active EI claimants in SD, EAS, JPI, and OJCP increased their annual employment earnings compared to similar non-participants.
Former EI claimants in JPI and OJCP increased their annual employment earnings relative to similar participants who only received EAS. Former claimants in SD had lower employment earnings compared to similar participants who only received EAS.
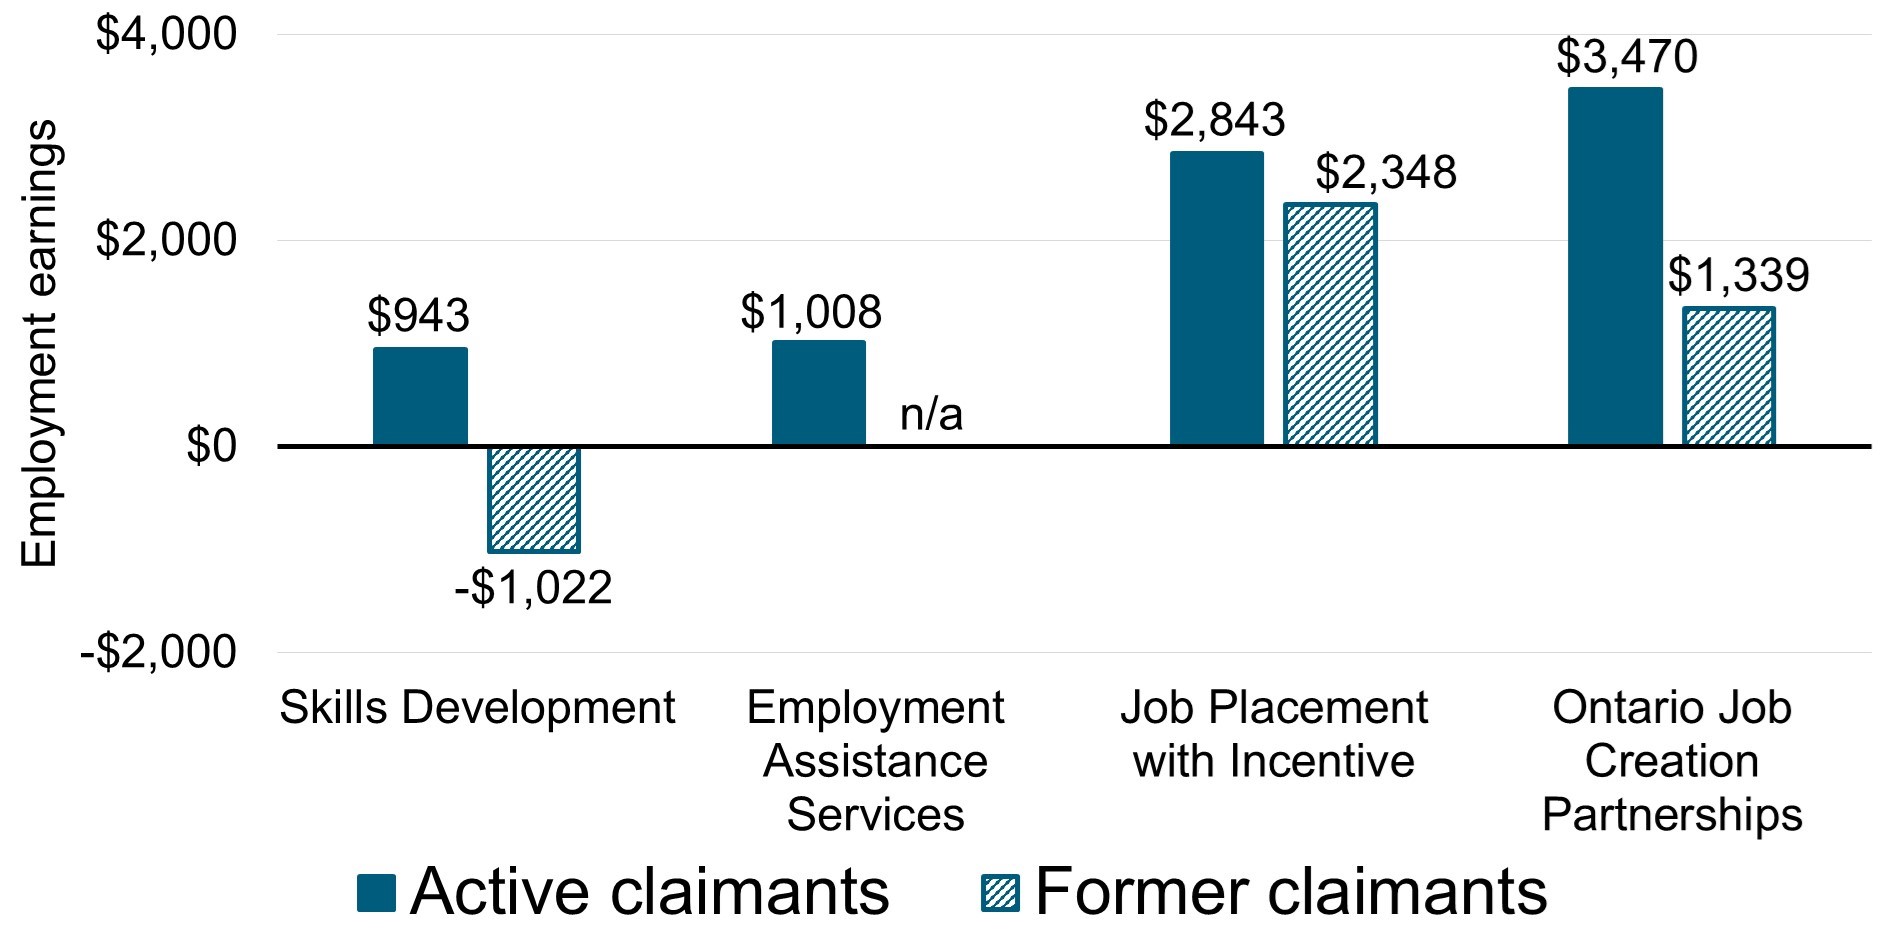
- Note: Impacts are estimated over 4 post-program years (or 5 years in the case of EAS).
Chart 2 text description
| Program name | Employment earnings of active claimants | Employment earnings of former claimants |
|---|---|---|
| Second Career | $943 | -$1,022 |
| Employment Services | $1,008 | n/a |
| Job Placement with Incentive | $2,843 | $2,348 |
| Ontario Job Creation Partnerships | $3,470 | $1,339 |
- Note: Impacts are estimated over 4 post-program years (or 5 years in the case of EAS).
Use of EI benefits
As shown in Chart 3, active claimants in SD and EAS reduced their use of EI benefits in the post-program period. Relative to similar participants who only received EAS, former claimants in SD reduced their EI benefits use, while former claimants OJCP increased their use of EI benefits.
From a cost-benefit perspective, the increase in the use of EI by former claimant participants in OJCP is not necessarily a negative impact given their increased employment earnings. Following participation, former claimants are likely to requalify for EI benefits due to their stronger labour market attachment demonstrated by increases in employment and earnings.

- Note: Impacts are estimated over 4 post-program years (or 5 years in the case of EAS).
- * The impacts are not statistically significant over the entire post-program period.
Chart 3 text description
| Program name | Use of EI benefits for active claimants | Use of EI benefits for former claimants |
|---|---|---|
| Second Career | -$287 | -$89 |
| Employment Services | -$307 | n/a |
| Job Placement with Incentive | $28* | -$71* |
| Ontario Job Creation Partnerships | $82* | $250 |
- Note: Impacts are estimated over 4 post-program years (or 5 years in the case of EAS).
- * The impacts are not statistically significant over the entire post-program period.
Use of SA benefits
As shown in Chart 4, compared to similar non-participants, active EI claimant participants in OJCP decreased their use of SA benefits in the post-program period.
Former EI claimant participants in JPI and OJCP decreased their use of SA benefits compared to similar participants who only received EAS.
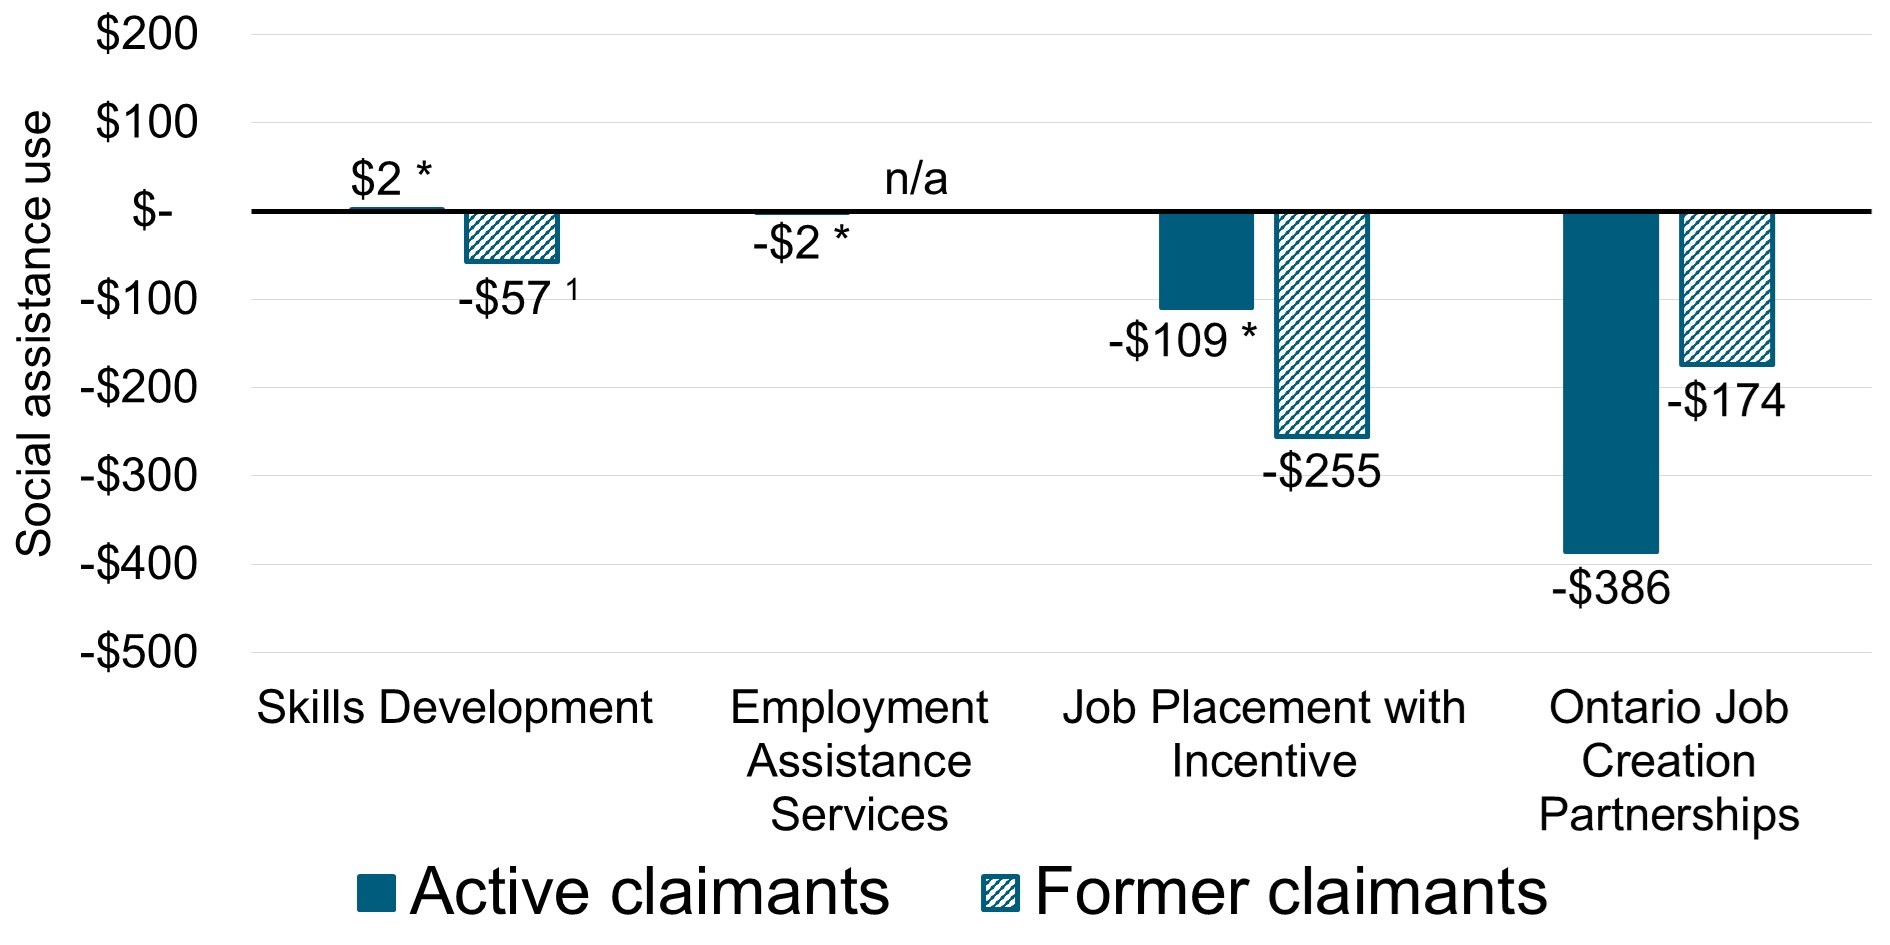
- Note: Impacts are estimated over 4 post-program years (or 5 years in the case of EAS).
- * The impacts are not statistically significant for the entire post-program period.
- 1 The impact is not statistically significant for the entire post-program period. However, former EI claimant participants in SD had a statistically significant decrease in their use of SA benefits of - $111 and - $110 in the years 3 and 4 post-program participation respectively, compared to similar participants in EAS only.
Chart 4 text description
| Program name | Use of SA benefits for active claimants | Use of SA benefits for former claimants |
|---|---|---|
| Second Career | $2* | -$571 |
| Employment Services | -$2* | n/a |
| Job Placement with Incentive | -$109* | -$255 |
| Ontario Job Creation Partnerships | -$386 | -$174 |
- Note: Impacts are estimated over 4 post-program years (or 5 years in the case of EAS).
- * The impacts are not statistically significant for the entire post-program period.
- 1 The impact is not statistically significant for the entire post-program period. However, former EI claimant participants in SD had a statistically significant decrease in their use of SA benefits of - $111 and - $110 in the years 3 and 4 post-program participation respectively, compared to similar participants in EAS only.
Dependence on government income support
Chart 5 presents the change in the annual average percentage of participants who used government income support from the pre-participation period to the post-participation period, relative to similar non-participants. As shown in Chart 5, compared to similar non-participants, a smaller proportion of active claimant participants in SD, EAS, JPI, and OJCP used government income support in the post-participation period. A smaller proportion of former claimant participants in JPI used government income support in the post-participation period compared to similar participants who only received EAS.

- Note: Impacts are estimated over 4 post-program years (or 5 years in the case of EAS).
- * The impacts are not statistically significant for the entire post-program period.
Chart 5 text description
| Program name | Dependence on government income support for active claimants (percentage points) | Dependence on government income support for former claimants (percentage points) |
|---|---|---|
| Second Career | -1.7 | -0.2* |
| Employment Services | -1.6 | 0 |
| Job Placement with Incentive | -1.8 | -2.6 |
| Ontario Job Creation Partnerships | -4.6 | -0.3* |
- Note: Impacts are estimated over 4 post-program years (or 5 years in the case of EAS).
- * The impacts are not statistically significant for the entire post-program period.
Incremental impacts by subgroups of participants
Female participants
Between 2010 and 2012, nearly 76,530 of the participants in Canada-Ontario LMDA-funded programs and services were female, representing about 50% of participants.
The profile of female participants is presented in Table 4. It includes their age, sociodemographic group, and marital status, educational attainment, occupation and industry. Information about their educational attainment, occupation and industry is based on the last job they held prior to applying for EI benefits. Information about sociodemographic groups is self-reported.
| Categories | Active claimants | Former claimants |
|---|---|---|
| Number of participants | 43,505 | 33,021 |
| Age: 30 and under | 20% | 24% |
| Age: 31 to 54 | 68% | 65% |
| Age: 55 and over | 12% | 11% |
| Sociodemographic group: Indigenous people | 2% | 3% |
| Sociodemographic group: Persons with disabilities | 4% | 5% |
| Sociodemographic group: Visible minorities | 4% | 6% |
| Sociodemographic group: Recent immigrants | 4% | 5% |
| Marital status: Single | 32% | 33% |
| Marital status: Married or common-law | 46% | 46% |
| Marital status: Widow / divorced / separated | 19% | 18% |
| Education or skills level: High school or occupational training | 46% | 46% |
| Education or skills level: On-the-job training | 15% | 20% |
| Education or skills level: College, vocational education or apprenticeship training | 24% | 21% |
| Education or skills level: University degree | 7% | 6% |
- * Values may not equal 100% due to rounding or missing information.
Top 3 occupational groups for EBSMs participants
Active claimants:
- clerical personnel = 24%
- intermediate sales and service personnel = 14%
- middle and other managers = 9%
Former claimants:
- clerical personnel = 22%
- intermediate sales and service personnel = 16%
- other sales and service professionals = 11%
Top 3 industries for EBSMs participantsFootnote 25
Active claimants:
- administrative and support, waste management and remediation services; and manufacturing = 13% each
- retail trade = 12%
- health care and social assistance = 10%
Former claimants:
- administrative and support, waste management and remediation services = 15%
- manufacturing = 13%
- retail trade = 12%
Main findings for female participants
SD
- Active EI claimants improved their incidence of employment, and reduced their use of government income support
- Employment earnings increased in years 3 and 4 post-participation
- Former EI claimants experienced a decrease in both their incidence of employment and employment earnings
JPI
- Active EI claimants increased their incidence of employment
- Former EI claimants increased their incidence of employment and employment earnings, and reduced their use of SA benefits
OJCP
- Active EI claimants increased their incidence of employment and employment earnings, and reduced their use of government income support
- Former EI claimants increased their incidence of employment and employment earnings, however, they increased their use of EI benefits
EAS
- Active EI claimants increased their incidence of employment and employment earnings, and decreased their use of government income support
Table 5 presents detailed incremental impacts for female participants over the 4 years post-participation (5 years in the case of EAS). For example, the results reveal that:
- relative to similar female non-participants, active claimants who participated in SD:
- improved their incidence of employment (+4.1 percentage points)
- had lower employment earnings (-$3,142) in year 1 post-program participation followed by increases of $1,337 and $1,398 in years 3 and 4 respectively during the post-program participation period
- reduced their dependence on government income support (-0.7 percentage points), by decreasing their use of EI (-$228 per year)
- compared to female former claimants who only received EAS, former claimants who participated in JPI:
- increased their annual incidence of employment (+4.8 percentage points) and earnings (+$1,762 per year)
- decreased their use of SA benefits by an average of $171 per year
- impacts were not statistically significant for use of EI and dependence on government income support
| Indicator | SD active claimants | SD former claimants | JPI active claimants | JPI former claimants | OJCP active claimants | OJCP former claimants | EAS active claimants |
|---|---|---|---|---|---|---|---|
| Incidence of employment (percentage points) | 4.1*** | -1.4** | 8.4*** | 4.8*** | 14.7*** | 8.1*** | 1.3** |
| Employment earnings ($) | -9511 | -1,237*** | 1,645 | 1,762*** | 5,692*** | 3,123** | 485* |
| EI benefits ($) | -228*** | -22 | -114 | 169 | 101 | 496** | -436*** |
| SA benefits ($) | 44* | -39 | -194 | -171* | -651*** | -74 | 67*** |
| Dependence on income support (percentage points) | -0.7** | -0.6 | -1.7 | -1.2 | -8.1*** | 0.5 | -1.4*** |
| n= | 10,135 | 5,770 | 629 | 971 | 388 | 352 | 32,314 |
- Statistical significance level ***1%; **5%; *10%, other values are not statistically significant.
- Note: Impacts are estimated over 4 post-program years (or 5 years in the case of EAS).
- 1 The impact is not statistically significant. However, female active EI claimants who participated in SD had statistically significant decreases in employment earnings of -$3,142 in year 1 post-program participation followed by increases of +$1,337 and +$1,398 in years 3 and 4 respectively during the post-program participation period compared with similar female non-participants.
Male participants
Between 2010 and 2012, nearly 75,500 of participants in Ontario were male, representing about 50% of participants.
The profile of male participants is presented in Table 6. It includes their age, sociodemographic group, marital status, educational attainment, occupation and industry. Information about their educational attainment, occupation and industry is based on the last job they held prior to applying for EI benefits. Information about sociodemographic groups is self-reported.
| Categories | Active claimants | Former claimants |
|---|---|---|
| Number of participants | 43,380 | 32,083 |
| Age: 30 and under | 27% | 29% |
| Age: 31 to 54 | 62% | 59% |
| Age: 55 and over | 12% | 13% |
| Sociodemographic group: Indigenous people | 3% | 4% |
| Sociodemographic group: Persons with disabilities | 4% | 6% |
| Sociodemographic group: Visible minorities | 4% | 5% |
| Sociodemographic group: Recent immigrants | 5% | 4% |
| Marital status: Single | 39% | 45% |
| Marital status: Married or common-law | 46% | 37% |
| Marital status: Widow / divorced / separated | 10% | 11% |
| Education or skills level: High school or occupational training | 34% | 35% |
| Education or skills level: On-the-job training | 26% | 28% |
| Education or skills level: College, vocational education or apprenticeship training | 29% | 27% |
| Education or skills level: University degree | 5% | 5% |
- * Values may not equal 100% due to rounding or missing information.
Top 3 occupational groups for EBSMs participants
Active claimants:
- semi-skilled manual workers = 21%
- other manual workers = 19%
- skilled crafts and trades = 12%
Former claimants:
- semi-skilled manual workers = 21%
- other manual workers = 20%
- skilled crafts and trades = 12%
Top 3 industries for EBSMs participants
Active claimants:
- manufacturing = 22%
- administrative and support, waste management and remediation services = 15%
- construction = 14%
Former claimants:
- manufacturing = 23%
- administrative and support, waste management and remediation services = 16%
- construction = 12%
Main findings for male participants
SD
- Active EI claimants increased their incidence of employment and employment earnings, and depended less on government income support
- Former EI claimants experienced a decrease in their employment earnings, and reduced their use of SA benefits
JPI
- Former EI claimants increased both their incidence of employment and employment earnings, and reduced their use of government income support
EAS
- Active EI claimants reduced their use of government income support
Table 7 presents detailed incremental impacts for male participants over the 4 years post-participation (5 years in the case of EAS). For example, the results reveal that:
- relative to similar male non-participants, active claimants who participated in SD:
- improved their incidence of employment (+2.6 percentage points) and increased their annual earnings (+$889 per year)
- depended less on government income support (-2.1 percentage points), by decreasing their use of EI (-$309 per year) and SA benefits (-$49 per year)
- compared to male former claimants who only received EAS former claimants who participated in JPI:
- improved their incidence of employment (+7.5 percentage points) and increased their annual earnings (+$3,307 per year)
- depended less on government income support following participation (-2.6 percentage points), by decreasing their use of SA benefits (-$270 per year)
| Indicator | SD active claimants | SD former claimants | JPI active claimants | JPI former claimants | EAS active claimants |
|---|---|---|---|---|---|
| Incidence of employment (percentage points) | 2.6*** | -0.5 | 2.5 | 7.5*** | 0.2 |
| Employment earnings ($) | 889** | -798** | 1,333 | 3,307*** | 314 |
| EI benefits ($) | -309*** | 1 | -86 | 39 | -570*** |
| SA benefits ($) | -49** | -84* | 68 | -270*** | 86*** |
| Dependence on income support (percentage points) | -2.1*** | -0.5 | -0.4 | -2.6*** | -1.7*** |
| n= | 10,460 | 4,955 | 836 | 1,205 | 31,872 |
- Statistical significance level ***1%; **5%; *10%, other values are not statistically significant.
- Note: Impacts are estimated over 4 post-program years (or 5 years in the case of EAS).
Youth participants
Between 2010 and 2012, nearly 37,200 of participants in Ontario were 30 years of age or younger when they began their program, representing about 24% of participants.
The profile of youth participants is presented in Table 8. It includes their gender, sociodemographic group, marital status, educational attainment, occupation and industry. Information about their educational attainment, occupation and industry is based on the last job they held prior to applying for EI benefits. Information about sociodemographic groups is self-reported.
| Categories | Active claimants | Former claimants |
|---|---|---|
| Number of participants | 20,147 | 17,009 |
| Gender: Female | 43% | 46% |
| Gender: Male | 57% | 54% |
| Sociodemographic group: Indigenous people | 3% | 4% |
| Sociodemographic group: Persons with disabilities | 3% | 4% |
| Sociodemographic group: Visible minorities | 2% | 3% |
| Sociodemographic group: Recent immigrants | 3% | 4% |
| Marital status: Single | 68% | 66% |
| Marital status: Married or common-law | 25% | 25% |
| Marital status: Widow / divorced / separated | 4% | 5% |
| Education or skills level: High school or occupational training | 36% | 38% |
| Education or skills level: On-the-job training | 29% | 31% |
| Education or skills level: College, vocational education or apprenticeship training | 25% | 23% |
| Education or skills level: University degree | 4% | 3% |
- * Values may not equal 100% due to rounding or missing information.
Top 3 occupational groups for EBSMs participantsFootnote 27
Active claimants:
- other manual workers = 21%
- clerical personnel = 15%
- semi-skilled manual workers = 13%
Former claimants:
- other manual workers = 19%
- clerical personnel = 15%
- intermediate sales and service personnel; and other sales and service personnel = 12% each
Top 3 industries for EBSMs participantsFootnote 28
Active claimants:
- administrative and support, waste management and remediation services = 15%
- construction; and Manufacturing = 13% each
- retail trade = 11%
Former claimants:
- administrative and support, waste management and remediation services = 17%
- retail trade = 13%
- manufacturing = 12%
Main findings for youth participants
SD
- Active EI claimants increased their incidence of employment and employment earnings, and reduced their use of government income support
JPI
- Former EI claimants increased their incidence of employment and employment earnings, and reduced their use of government income support
EAS
- Active EI claimants increased their employment earnings and reduced their use of government income support
Table 9 presents the detailed incremental impacts for youth over the 4 years post-participation (5 years in the case of EAS). For example, the results reveal that:
- relative to similar youth non-participants, active claimants who participated in SD:
- improved their incidence of employment (+3.5 percentage points), and increased their annual earnings (+$1,579 per year)
- depended less on government income support (-2 percentage points) by decreasing their use of EI (-$185 per year) and SA (-$64) benefits
- relative to youth former EI claimants who only received EAS, former claimants who participated in JPI:
- improved their incidence of employment (+4.4 percentage points) and increased their annual earnings (+ $1,585)
- depended less on government income support (- 2.5 percentage points), by decreasing their use of SA benefits (-$237 per year)
| Indicator | SD active claimants | SD former claimants | JPI active claimants | JPI former claimants | EAS active claimants |
|---|---|---|---|---|---|
| Incidence of employment (percentage points) | 3.5*** | 1.2 | 4.0 | 4.4*** | -0.1 |
| Employment earnings ($) | 1,579*** | -416 | 876 | 1,585* | 672** |
| EI benefits ($) | -185*** | 76 | 46 | -138 | -584*** |
| SA benefits ($) | -64* | -61 | -184 | -237*** | 58*** |
| Dependence on income support (percentage points) | -2*** | -1 | -2 | -2.5*** | -1.7*** |
| n= | 4,662 | 2,264 | 420 | 819 | 14,823 |
- Statistical significance level ***1%; **5%; *10%, other values are not statistically significant.
- Note: Impacts are estimated over 4 post-program years (or 5 years in the case of EAS).
Older worker participants
Between 2010 and 2012, nearly 18,300 of participants in Ontario were 55 years of age or older when they began their program, representing about 12% of participants.
The profile of older worker participants is presented in Table 10. It includes their gender, sociodemographic group, marital status, educational attainment, occupation and industry. Information about their educational attainment, occupation and industry is based on the last job they held prior to applying for EI benefits. Information about sociodemographic groups is self-reported.
| Categories | Active claimants | Former claimants |
|---|---|---|
| Number of participants | 10,473 | 7,824 |
| Gender: Female | 51% | 48% |
| Gender: Male | 49% | 52% |
| Sociodemographic group: Indigenous people | 2% | 2% |
| Sociodemographic group: Persons with disabilities | 5% | 7% |
| Sociodemographic group: Visible minorities | 5% | 6% |
| Sociodemographic group: Recent immigrants | 2% | 2% |
| Marital status: Single | 17% | 21% |
| Marital status: Married or common-law | 56% | 51% |
| Marital status: Widow / divorced / separated | 24% | 24% |
| Education or skills level: High school or occupational training | 44% | 43% |
| Education or skills level: On-the-job training | 17% | 19% |
| Education or skills level: College, vocational education or apprenticeship training | 26% | 25% |
| Education or skills level: University degree | 5% | 6% |
- * Values may not equal 100% due to rounding or missing information.
Top 3 occupational groups for EBSMs participantsFootnote 30
Active claimants:
- clerical personnel = 17%
- semi-skilled manual workers = 16%
- intermediate sales and service personnel = 10%
Former claimants:
- semi-skilled manual workers = 17%
- clerical personnel = 16%
- intermediate sales and service personnel; Other manual workers = 10% each
Top 3 industries for EBSMs participants
Active claimants:
- manufacturing = 19%
- administrative and support, waste management and remediation = 13%
- retail trade = 12%
Former claimants:
- manufacturing = 22%
- administrative and support, waste management and remediation = 14%
- retail trade = 10%
Main findings for older worker participants
SD
- Active EI claimants increased their incidence of employment and their employment earnings
- They reduced their use of EI benefits in the short-term but increased their use of SA benefits
- Former EI claimants experienced a decrease in their incidence of employment
EAS
- Active EI claimants increased their incidence of employment, and reduced their use of government income support
Table 11 presents the detailed incremental impacts for older workers over the 4 years post-participation (5 years in the case of EAS). For example, the results reveal that:
- relative to similar older worker non-participants, active claimants who participated in SD:
- increased their incidence of employment (+12.5 percentage points) and annual earnings (+ $3,841 per year)
- reduced their use of EI benefits by $189 and $286 in the first and second year after participation, but increased their use of SA benefits (+$225 per year)
- relative to similar older worker participants who only received EAS, former claimants who participated in SD:
- experienced a reduction in their incidence of employment (-3.3 percentage points)
- experienced mixed and statistically non-significant results in terms of use of earnings, EI use, SA use and dependence on government income support
| Indicator | SD active claimants | SD former claimants | EAS active claimants |
|---|---|---|---|
| Incidence of employment (percentage points) | 12.5*** | -3.3* | 1.1* |
| Employment earnings ($) | 3,841*** | 160 | 3882 |
| EI benefits ($) | -1201 | -63 | -488*** |
| SA benefits ($) | 225*** | 122 | 161*** |
| Dependence on income support (percentage points) | -0.6 | 1.5 | -1.2*** |
| n= | 1,683 | 897 | 8,526 |
- Statistical significance level *** 1%; ** 5%; * 10%, other values are not statistically significant.
- Note: Impacts are estimated over 4 post-program years (or 5 years in the case of EAS).
- 1 The impact is not statistically significant. However, active EI claimant participants in SD had statistically significant decreases in the use of EI benefits of -$189 and -$286 in years 1 and 2, respectively, post-program participation, relative to similar non-participants.
- 2 The impact is not statistically significant. However, active EI claimants who participated in EAS had a statistically significant decrease in employment earnings of -$1,216 in year 1 and increases of +$798, +$1,007 and +$1,172 in the years 3, 4 and 5 respectively post-program participation.
Indigenous participants
Between 2010 and 2012, nearly 4,200 of participants in Ontario self-identified as Indigenous, representing about 3% of participants.
The profile of Indigenous participants is presented in Table 12. It includes their gender, age, marital status, educational attainment, occupation and industry. Information about their educational attainment, occupation and industry is based on the last job they held prior to applying for EI benefits.
| Categories | Active claimants | Former claimants |
|---|---|---|
| Number of participants | 2,039 | 2,155 |
| Gender: Female | 44% | 43% |
| Gender: Male | 56% | 57% |
| Age: 30 and under | 27% | 33% |
| Age: 31 to 54 | 65% | 60% |
| Age: 55 and over | 8% | 6% |
| Marital status: Single | 44% | 51% |
| Marital status: Married or common-law | 35% | 29% |
| Marital status: Widow / divorced / separated | 16% | 12% |
| Education or skills level: High school or occupational training | 36% | 35% |
| Education or skills level: On-the-job training | 26% | 30% |
| Education or skills level: College, vocational education or apprenticeship training | 28% | 28% |
| Education or skills level: University degree | 5% | 4% |
- * Values may not equal 100% due to rounding or missing information.
Top 3 occupational groups for EBSMs participantsFootnote 32
Active claimants:
- other manual workers = 18%
- semi-skilled manual workers = 16%
- clerical personnel = 12%
Former claimants:
- other manual workers = 19%
- semi-skilled manual workers = 12%
- intermediate sales and service personnel; Clerical personnel = 11% each
Top 3 industries for EBSMs participantsFootnote 33
Active claimants:
- construction = 14%
- manufacturing = 12%
- public administration = 11%
Former claimants:
- public administration; and Construction = 13% each
- administrative and support, waste management and remediation; and Accommodation and food services = 10% each
- manufacturing = 9%
Main findings for Indigenous participants
SD
- Active claimants increased their incidence of employment and employment earnings, and reduced their use of government income support
- Former claimants increased their incidence of employment and employment earnings
EAS
- Active claimants increased their employment earnings
- They also decreased their use of EI benefits but increased their use of SA benefits
Table 13 presents the detailed incremental impacts for Indigenous participants over the 4 years post-participation (5 years in the case of EAS). For example, the results reveal that:
- relative to similar Indigenous non-participants, active claimants who participated in SD:
- improved their incidence of employment (+ 6.9 percentage points), and increased their earnings (+ $6,158 per year)
- depended less on government income support (- 4.7 percentage points), by decreasing their use of SA benefits (- $275 per year)
- compared to similar participants who only received EAS, Indigenous former EI claimants who participated in SD:
- improved their incidence of employment (+7.2 percentage points) and increased their earnings (+$4,538 per year)
- the estimates for dependence on government income support were not statistically significant
| Indicator | SD active claimants | SD former claimants | EAS active claimants |
|---|---|---|---|
| Incidence of employment (percentage points) | 6.9*** | 7.2*** | 0.61 |
| Employment earnings ($) | 6,158*** | 4,538*** | 1,893*** |
| EI benefits ($) | -41 | 229 | -160*** |
| SA benefits ($) | -275** | 84 | 151*** |
| Dependence on income support (percentage points) | -4.7*** | 0.4 | 0 |
| n= | 476 | 381 | 1,468 |
- Statistical significance level *** 1%; ** 5%; * 10%, other values are not statistically significant.
- Note: Impacts are estimated over 4 post-program years (or 5 years in the case of EAS).
- 1 The impact is not statistically significant. However, compared to similar Indigenous non-participants, active claimants who participated in EAS had a higher incidence of employment (+ 1.7 percentage points and +1.3 percentage points) in the years 1 and 3 respectively post-program participation.
Persons with disabilities
Between 2010 and 2012, nearly 7,050 of participants in Ontario self-identified as persons with disabilities, representing about 5% of participants.
The profile of participants with disabilities is presented in Table 14. It includes their gender, age, marital status, educational attainment, occupation and industry. Information about their educational attainment, occupation and industry is based on the last job they held prior to applying for EI benefits.
| Categories | Active claimants | Former claimants |
|---|---|---|
| Number of participants | 3,448 | 3,598 |
| Gender: Female | 47% | 47% |
| Gender: Male | 53% | 53% |
| Age: 30 and under | 18% | 19% |
| Age: 31 to 54 | 67% | 65% |
| Age: 55 and over | 15% | 16% |
| Marital status: Single | 41% | 45% |
| Marital status: Married or common-law | 35% | 33% |
| Marital status: Widow / divorced / separated | 20% | 17% |
| Education or skills level: High school or occupational training | 41% | 41% |
| Education or skills level: On-the-job training | 24% | 27% |
| Education or skills level: College, vocational education or apprenticeship training | 24% | 22% |
| Education or skills level: University degree | 5% | 5% |
- * Values may not equal 100% due to rounding or missing information.
Top 3 occupational groups for EBSMs participantsFootnote 35
Active claimants:
- clerical personnel = 16%
- semi-skilled manual workers = 14%
- other manual workers = 12%
Former claimants:
- clerical personnel = 16%
- other manual workers; and Semi-Skilled manual workers = 14% each
- other sales and service personnel = 13%
Top 3 industries for EBSMs participantsFootnote 36
Active claimants:
- administrative and support, waste management and remediation; and Manufacturing = 14% each
- retail trade = 12%
- health care and social assistance = 9%
Former claimants:
- administrative and support, waste management and remediation = 16%
- manufacturing = 15%
- retail trade = 11%
Main findings for participants who are persons with disabilities
SD
- Active EI claimants saw their earnings decrease
- Former EI claimants increased their incidence of employment and earnings, and depended less on government income support, by decreasing their use of SA benefits
Recent interviews with 40 service providers working with persons with disabilities reveal that a significant proportion of participants are looking or only capable of working on part-time basis. In fact, the outcome trends reveal that over 40% of persons with disabilities earn less than $10,000 per year in the 4 post-program years.
In this context, table 15 presents the detailed incremental impacts for persons with disabilities over the 4 years post-participation. The results reveal that relative to similar non-participants with disabilities, active claimants who participated in SD earn less annually (-$3,387). Other impacts were not statistically significant.
Compared to similar participants who only received EAS, former claimants who participated in SD:
- improved their incidence of employment (+5.3 percentage points), and increased their earnings (+$2,540 per year)
- depended less on government income support (-4.9 percentage points), by decreasing their use of SA benefits (-$909 per year)
| Indicator | SD active claimants | SD former claimants |
|---|---|---|
| Incidence of employment (percentage points) | 3.9 | 5.3* |
| Employment earnings ($) | -3,387*** | 2,540** |
| EI benefits ($) | 184 | 214 |
| SA benefits ($) | 145 | -909*** |
| Dependence on income support (percentage points) | 1.9 | -4.9** |
| n= | 419 | 310 |
- Statistical significance level *** 1%; ** 5%; * 10%, other values are not statistically significant.
- Note: Impacts are estimated over 4 post-program years.
Recent immigrantsFootnote 38
Between 2010 and 2012, nearly 7,330 of participants in Ontario were recent immigrants, representing about 5% of participants.
The profile of recent immigrant participants is presented in Table 16. It includes their gender, age, marital status, educational attainment, occupation and industry. Information about their educational attainment, occupation and industry is based on the last job they held prior to applying for EI benefits.
| Categories | Active claimants | Former claimants |
|---|---|---|
| Number of participants | 4,194 | 3,131 |
| Gender: Female | 46% | 56% |
| Gender: Male | 54% | 44% |
| Age: 30 and under | 16% | 20% |
| Age: 31 to 54 | 80% | 76% |
| Age: 55 and over | 5% | 4% |
| Marital status: Single | 14% | 12% |
| Marital status: Married or common-law | 76% | 76% |
| Marital status: Widow / divorced / separated | 9% | 10% |
| Education or skills level: High school or occupational training | 37% | 39% |
| Education or skills level: On-the-job training | 25% | 32% |
| Education or skills level: College, vocational education or apprenticeship training | 23% | 19% |
| Education or skills level: University degree | 9% | 6% |
- * Values may not equal 100% due to rounding or missing information.
Top 3 occupational groups for EBSMs participantsFootnote 39
Active claimants:
- other manual workers = 16%
- semi-skilled manual workers = 15%
- clerical personnel = 14%
Former claimants:
- other manual workers = 18%
- semi-skilled manual workers; and Clerical personnel = 15% each
- other sales and service Personnel = 14%
Top 3 industries for EBSMs participants
Active claimants:
- administrative and support, waste management and remediation services = 26%
- manufacturing = 16%
- retail trade = 8%
Former claimants:
- administrative and support, waste management and remediation services = 26%
- manufacturing = 16%
- retail trade = 9%
Main findings for recent immigrant participants
SD
- Active EI claimants improved their incidence of employment, and reduced their use of government income support by decreasing the use of EI
- Former EI claimants saw their average annual earnings decrease
EAS
- Active EI claimants increased their incidence of employment and employment earnings, and depended less on government income support, by decreasing their use of EI
Table 17 presents the detailed incremental impacts for recent immigrants over the 4 years post-participation (5 years in the case of EAS). For example, the results reveal that relative to similar non-participants who were recent immigrants, active claimants who participated in SD:
- improved their incidence of employment (+3.7 percentage points)
- depended less on government income support (-1.7 percentage point), in part by decreasing their use of EI benefits (-$239 per year)
Relative to similar participants who only received EAS, former EI claimant participants in SD experienced decrease in their employment earnings.
| Indicator | SD active claimants | SD former claimants | EAS active claimants |
|---|---|---|---|
| Incidence of employment (percentage points) | 3.7*** | -3.4 | 4.7*** |
| Employment earnings ($) | -206 | -3,620*** | 1,928*** |
| EI benefits ($) | -239*** | -55 | -212*** |
| SA benefits ($) | -59 | -51 | 29 |
| Dependence on income support (percentage points) | -1.7*** | -1.21 | -0.5** |
| n= | 1,138 | 839 | 2,976 |
- Statistical significance level *** 1%; ** 5%; * 10%, other values are not statistically significant.
- Note: Impacts are estimated over 4 post-program years (or 5 years in the case of EAS).
- 1 The impact is not statistically significant. However, statistically significant decreases in level of dependence on income support were found in years 1 and 3 post-program participation (-2.1 percentage points in both years).
Visible minorities
Between 2010 and 2012, nearly 7,100 of participants in Ontario self-identified as visible minorities, representing about 5% of participants.
The profile of visible minority participants is presented in Table 18. It includes their gender, age, marital status, educational attainment, occupation and industry. Information about their educational attainment, occupation and industry is based on the last job they held prior to applying for EI benefits.
| Categories | Active claimants | Former claimants |
|---|---|---|
| Number of participants | 3,499 | 3,562 |
| Gender: Female | 50% | 53% |
| Gender: Male | 50% | 47% |
| Age: 30 and under | 11% | 14% |
| Age: 31 to 54 | 74% | 72% |
| Age: 55 and over | 15% | 14% |
| Marital status: Single | 31% | 34% |
| Marital status: Married or common-law | 51% | 48% |
| Marital status: Widow / divorced / separated | 16% | 14% |
| Education or skills level: High school or occupational training | 42% | 43% |
| Education or skills level: On-the-job training | 16% | 21% |
| Education or skills level: College, vocational education or apprenticeship training | 28% | 23% |
| Education or skills level: University degree | 9% | 8% |
- * Values may not equal 100% due to rounding or missing information.
Top 3 occupational groups for EBSMs participants
Active claimants:
- clerical personnel = 20%
- semi-skilled manual workers = 15%
- professionals = 10%
Former claimant
- clerical personnel = 19%
- semi-skilled manual workers = 15%
- other manual workers = 11%
Top 3 industries for EBSMs participants
Active claimants:
- manufacturing = 19%
- administrative and support, waste management and remediation services = 18%
- health care and social assistance = 8%
Former claimant
- administrative and support, waste management and remediation services = 21%
- manufacturing = 19%
- retail trade = 8%
Main findings for visible minority participants
SD
- Active EI claimants improved their incidence of employment, and reduced their use of EI benefits
- They experienced short-term decrease in employment earnings
- Former EI claimants experienced a decrease in their average annual earnings
Table 19 presents the detailed incremental impacts for visible minority participants over the 4 years post-participation. The results reveal that relative to similar visible minority non-participants, active claimants, who participated in SD, improved their incidence of employment (+3.3 percentage points. They also reduced their use of EI benefits (-$300 per year). They experienced a decrease in earnings in year 1 following participation.
Compared to similar visible minority participants who only received EAS, former claimants in SD had a decrease in their average earnings (-$2,551 per year). Other impacts were not statistically significant.
| Indicator | SD active claimants | SD former claimants |
|---|---|---|
| Incidence of employment (percentage points) | 3.3* | 0.3 |
| Employment earnings ($) | -4631 | -2,551** |
| EI benefits ($) | -300** | -56 |
| SA benefits ($) | 181 | 89 |
| Dependence on income support (percentage points) | -1 | -0.5 |
| n= | 916 | 850 |
- Statistical significance level *** 1%; ** 5%; * 10%, other values are not statistically significant.
- Note: Impacts are estimated over 4 post-program years.
- 1 The impact is not statistically significant. However, visible minority active EI claimants who participated in SD had a statistically significant decrease in earnings of $4,372 in the year 1 post- program participation period compared to similar recent immigrant non-participants.
Cost-benefit analysis
Main findings
Over time, the social benefits of participating in JPI, OJCP and EAS exceeded the initial investment costs for program participants. However, it takes 19.1 years to recover the initial investment in SD for active claimants. As well, the investments in SD for former claimants may not be recovered.
This analysis is based on the EBSM medium-term incremental impacts previously described in this report. Costs and benefits are examined over the participation period of 1 or 2 years and 5, or 10 years after the end of participation.Footnote 42
The cost-benefit analysis addresses the following questions:
- Are the benefits from EBSMs exceeding the costs within 5 years (for JPI, OJCP and EAS), or 10 years (for SD) after the end of participation?
- How much is the benefit for the government and society if the government spends $1 in EI part II funding?
- How many years does it take the benefits to recover the costs?
Table 20 presents the cost-benefit results for active and former EI claimant participants. The results are presented from the social perspective, that is, the government and individual perspectives combined. This allows for a sound assessment of program effectiveness in achieving its objectives of helping unemployed individuals to obtain and maintain employment and to generate EI savings.
| Indicator | SD active claimants (10 years post-program) | JPI active claimants (5 years post-program) | OJCP active claimants (5 years post-program) | EAS active claimants (5 years post-program) | JPI former claimants (5 years post-program) | OJCP former claimants (5 years post-program |
|---|---|---|---|---|---|---|
| Net present value | -$15,932 | $10,348 | -$3,546 | -$2,562 | $14,568 | -$12,804 |
| Benefit cost ratio | -$0.30 | $2.64 | $0.76 | $0.23 | $3.78 | -$0.08 |
| Payback period (years after end of participation) | 19.1 | 1.6 | 5.9 | 6.6 | <11 | 12.4 |
| Social return | -130% | 164% | -24% | -77% | 278% | -108% |
| Savings to public health care | $21 | $152 | $137 | -$33 | $185 | $22 |
- * If the benefit-cost ratio is greater than 1, the benefits outweigh the costs. If the ratio is less than 1, the costs outweigh the benefits.
- 1 Paid back within the program start year.
The information below provides examples of the net present value, the benefit-cost ratio, the payback period, the social rate of return and savings to health care costs.
4.1.1. Skills DevelopmentFootnote 44
During the 2010 to 2012 period, SD represented approximately 43% of EBSM expenditures under the LMDA in Ontario. The average duration of a SD Action Plan Equivalent is 53 weeks for active claimants and 51 weeks for former claimants.
Table 20 includes the cost-benefit analysis results for active and former EI claimant participants in SD. For example, over the 10 year post-program period, for active EI claimant participants, the investment costs exceeded the benefits by $15,932, yielding a social return on investment of -130%. This means that if the government spends $1 on SD for active EI claimants, it generates a loss of -$0.30 for society.Footnote 45 From a social perspective, it takes 19.1 years for the benefits to recover the costs of programming. Overall, there is a savings to health care costs of $21 per participant.
4.1.2. Job Placement with Incentive
During the 2010 to 2012 period, JPI represent 1% of total LMDA-funded EBSM expenditures In Ontario. The average duration of a JPI Action Plan Equivalent is 32 weeks for active claimants and 24 weeks for former claimants.
Table 20 includes the cost-benefit analysis results for active and former EI claimant participants in JPI. For example, over the 5 year post-program period, for former EI claimant participants, the benefit is $14,568 greater than the cost, yielding a social return on investment of 278%. This means that if the government spends $1 on JPI for former claimants, it generates $3.78 of benefit for society. From a societal perspective, the costs were recovered during the first year of program participation. Overall, there is a savings to health care costs of $185 per participant.
4.1.3. Ontario Job Creation Partnerships
During the 2010 to 2012 period, OJCP represented 1% of the total EBSM expenditures In Ontario. The average duration of an OJCP Action Plan Equivalent is 37 weeks for active claimants and 31 weeks for former claimants.
In addition to helping participants obtain work experience in the funded projects, OJCP also benefits the communities where the projects are implemented. However, community impacts are not accounted for in this cost-benefit analysis since they are not captured in the administrative data and are difficult to quantify. Accordingly, the benefits from the social perspective are likely underestimated.
Table 20 includes the cost-benefit analysis results for active and former EI claimant participants in OJCP. For example, over the 5 year post-program period, for former EI claimant participants, the benefits of delivering OJCP were $12,804 lower than the costs 5 years after the end of participation, yielding a return on investment of -108%. This means that if the government spends $1 on OJCP programming, it generates an additional loss of $0.08 for society. From a social perspective, it takes 12.4 years to recover the costs of OJCP for former EI claimant participants. Overall, there is a savings to health care costs of $22 per participant.
4.1.4. Employment Assistance ServicesFootnote 46
EAS includes a variety of services such as computer access for job search services, group sessions to prepare for an interview, career counselling, and action plan development. The administrative data, however, do not allow to identify what proportion of EAS interventions belong to each category or the intensity of services offered to participants.
While EAS are often provided with other EBSMs, this analysis examined only participants who received 1 or more EAS without participating in other EBSMs. EAS represented about 46% of total EBSM expenditures between 2010 and 2012.
As shown in Table 20, over the 5 year post-program period, the benefits of delivering EAS were $2,562 lower than the costs 5 years after the end of participation, yielding a return on investment of -77%. This means that if the government spends $1 on EAS programming, society recovers only $0.23 by the fifth year after participation. From a social perspective, it takes 6.6 years to recover the costs of EAS for former EI claimant participants. No savings to health care costs (-33) were found.
Overall, the goal of EAS is not to help participants acquire more skills, therefore, increasing participants' earnings after participation is not necessarily expected. Conducting a cost-benefit analysis for EAS is a challenge as it is not possible to attribute a dollar figure to the return to employment. However, including earnings in the cost-benefit calculation is still very relevant since it captures partially the positive impact of the quicker return to work.
Supplemental studies
Ontario Job Creation PartnershipsFootnote 47
Program objective
The OJCP program is designed to support projects that create jobs that will provide insured participants with opportunities to gain meaningful and recent work experience. Project activities should benefit both the participant and the community; however, the primary focus must be on the participant, not the sponsor or the community.
Participants receive benefits from EI Part I or II.Footnote 48 Benefits to participants follow the prevailing wage rate, up to the maximum EI weekly benefit rate. Sponsors/employers are encouraged to provide a top-up to bridge any gap between the maximum benefit rate and the prevailing wage for the work being performed.
Program delivery
OJCP is delivered through the provision of funds to organizations that implement a community-benefiting project while providing work experience to participants.
The design and delivery of OJCP allows the Ontario to address a variety of barriers to employment experienced by its residents. OJCP can also be used to address labour market needs by targeting sub-groups of individuals, in-demand professions or economic sectors, and specific communities.
Program managers reported that the low level of funding allocated to OJCP is influenced by a lack of promotion of OJCP to organizations, previous unspent budget, the perceived lower value of OJCP, and by the funding of other LMDA programs being prioritized over OJCP.
In addition to gaining work experience, key informants identified a variety of other benefits that can be expected from OJCP projects. For example, participants are expected to develop work-related skills, enhance their job search abilities and improve their personal well-being.
Project holders can benefit from OJCP by increasing their organizational capacity, implementing their projects and expanding their portfolio of services provided. At the community level, projects can support the local economy and provide new assets (such as, restored buildings and development of hiking trails).
Challenges and lessons learned
Key informants identify challenges related to:
- recruitment of participants and organizations
- ensuring that OJCP projects are assisting participants in addressing their barriers to employment
- program administration and monitoring
Key informants identify the following elements as contributing factors to participants' success:
- implementation is effective when Employment and Training Consultants provide support to project holders during the writing of their OJCP proposal and throughout project implementation
- on-site visits, open communication, and establishing clear project expectations support effective monitoring
- participants who benefit the most from OJCP are those in need of work experience, networking opportunities, or skills training
- organizations with capacity and experience implementing OJCP projects are found to implement effective projects
- projects found to be best suited under OJCP are those that provide tangible skills to participants or are community-based
- examples of well-suited projects include administration and research, marketing and design, construction or trail making, event coordination, and museum or archiving
Key consideration for OJCP program and policy development
The following consideration emerge as part of the OJCP study.
The program could benefit from increased promotion or changes to the benefit structure in order to attract more job seekers.
Participant recruitment was reported to be a challenge by key informants, despite positive outcomes of the program. Key informants reported that recruitment was hindered by the lack of promotion to job seekers, the difficulty of finding EI eligible clients and the low level of financial support available to participants.
Labour Market PartnershipsFootnote 49
Ontario designed 6 LMP programs that collectively aim to assist employers, communities and industries to address their labour force adjustments and human resource needs. They include a range of funded activities, such as:
- labour market and human resource research
- raising awareness about labour market and human resources information and best practices
- employment services and workforce development planning activities (through engagement sessions, interpretation of labour market data and workforce strategies/plans development)
- employment and training service coordination for employers (through consultations with stakeholders and strategies/plans development)
- employer-led skills development training
- labour force adjustment services (for example, pre-layoff supports, and needs assessment of laid-off workers)
- activities to improve the quality and quantity of experiential learning opportunities available to undergraduate and graduate students
Labour Market Partnerships is 1 type of support measures delivered under the LMDAs. In 2020 to 2021, Ontario spent nearly $85 million (including administrative costs) on Labour Market Partnerships, which represented 11% of the Canada-Ontario LMDA funding envelope.
Funded organizations
Funded organizations include:
- not-for-profit organizations
- workforce development board
- workforce adjustment centres
- post-secondary education institutions
- education councils
- First Nation community owned business
Targeted labour market issues
Funded projects target current and/or forecasted skills and/or labour shortages. These projects also target unemployment in specific subpopulations such as women, youth, Indigenous peoples, newcomers, persons with disabilities, the self-employed, and those who will soon be laid-off.
Generally, funded projects target labour market issues associated with:
- lack of capacity for human resource planning resulting in employee attraction and retention challenges
- businesses downsizing/closure/layoffs
- labour market information
- skills development challenges and training gaps to fill in-demand jobs
- demographical changes
- technology changes
- limited employment opportunities in Indigenous communities, and in small and remote communities
All projects reviewed were aligned with program objectives and eligible activities.
Partnerships
Ontario ministries and program officials confirmed that regional/local program officials carried out activities to support the formation and maintenance of partnerships (with sector and community stakeholders) as a part of the LMP programs design and delivery.
Key informants explained that partners' expertise, network and financial contribution are all essential or beneficial to project implementation and success.
The document review of 17 projects confirmed that:
- partnerships were established to support the delivery of the majority of LMP projects
- partners made a financial or in-kind contribution
- the most common forms of in-kind contribution were expertise, as well as staff time to support project delivery, office/event space and usage of equipment
Challenges and lessons learned
Ontario ministries and key informants identified challenges related to:
- project holder recruitment and setting up LMP projects (lack of flexibility in the program's eligibility criteria, difficulties with recruiting knowledgeable project staff or consultants)
- project delivery (engagement of partners and stakeholders, limited local employment and training service delivery capacity)
- program administration and monitoring (shortage of funding available, short project duration)
Actions of program officials and project characteristics that are conducive to the success of the program included:
- program officials working with prospective project holders to improve and finalise project proposals
- ongoing communication and relationship building between Ontario program officials and project holders
- clearly defined labour market issues/needs that the projects aim to address
- these generally occur through clear project objectives, activities, expected outputs and outcomes
- ensuring that project holders have the capacity to deliver the project
- ensuring the selection of appropriate partners and the diversity of their perspectives and expertise
Key considerations for program and policy development
- Considering that the current performance indicators do not reflect the diversity of activities funded under LMP, it is important for ESDC and Ontario to discuss current funded activities in order to make recommendations on how best to report on results
- It is essential to share lessons learned about successful LMP projects:
- particularly, for projects targeted to employers (such as workplace or employer-sponsored training), and those assisting communities and economic sectors dealing with labour market adjustment issues (contraction or expansion)
Research and InnovationFootnote 50
In Ontario, Research and Innovation is used to enable innovation in the employment and training system and to explore new ways of providing employment and training supports to employers, workers, and job seekers, including those who are not currently supported by other LMDA funded programs and services.
Between 2014 and 2020, the annual budget allocated to Research and Innovation in Ontario has varied from 3% to 17%. Program officials report that the amount allocated to Research and Innovation is not fixed and is influenced by the province's workforce development priorities and the need to complement existing services.
Funded organizations
Funded organizations include:
- not-for-profit organizations (such as research organizations, school boards, and Indigenous organizations)
- businesses/employers
- educational institutions and training providers
Funded Research and Innovation activities
Research and Innovation projects encompassed a variety of activities including:
- developing new tools and approaches to meet the labour market needs of employers and job seekers
- supporting labour force development projects in remote Indigenous communities
- supporting employer-driven training
- pilot projects implementing and assessing new training and skills development approaches
- academic research on labour market outcomes
Innovation definition and criteria
Approaches or practices are considered innovative if they are:
- proposing new ways of operating
- targeting new client groups
- supporting new priorities or plans
- promoting change
Innovation can come in response to external forces, including labour market shocks, or as a result of internal review and/ or changing priorities. Most often, programs that are assessed to be innovative are pilot projects or are time-limited.
Dissemination and adoption of innovative approaches
Ontario requires some funded projects to disseminate their findings, lessons learned and results. These can be disseminated across provincial ministries, to service provider networks, and to the broader public. Dissemination activities can include, for example:
- publishing reports
- developing websites or adding content to existing websites
- providing workshops and webinars
Performance measurement
Research and Innovation project are subject to different performance measurement requirements. Most are required to submit interim and final reports on project outcomes. Some are also evaluated by the provincial government.
Challenges and lessons learned
Project documents and program officials identified challenges related to the testing and identification of innovative approaches including:
- recruiting employers to participate in the project
- promoting the program and building relationships with employers
- high rate of withdrawal by jobseekers participating in the program
- poor job security for staff
- insufficient coordination between post-secondary programs and workforce development programs
In relation to factors contributing to successful testing and identification of innovative approaches, program officials highlighted the need to:
- tailor approaches to particular sectors
- develop strategic partnerships between organizations in different sectors, including workforce development service providers, post-secondary institutions, and employers
Skills Development-ApprenticesFootnote 51
The objective of the program is to help apprentices become skilled tradespeople and to increase their labour market attachment. Program participants have generally chosen a career and are already attached to the labour market. The apprenticeship process involves on-the-job learning and technical training in a classroom setting.
Apprentices who have worked enough hours to qualify for EI can apply to receive EI Part I benefits while on training. The program provides financial assistance to EI eligible apprentices to help them offset the costs they incur while they attend technical training. The level of funding is based on the needs of apprentices, the location of the training, and any fees paid by the apprentices.Footnote 52
The profile of program participants is presented in Table 21 by gender, age, sociodemographic group, and marital status. Information about their educational attainment, occupation and industry is based on the last job they held prior to applying for EI Part 1 benefits. Information about sociodemographic groups is self-reported.
| Categories | Active claimants | Former claimants |
|---|---|---|
| Number of participants | 12,016 | 6,247 |
| Gender: Female | 5% | 11% |
| Gender: Male | 95% | 89% |
| Age: 30 and under | 79% | 74% |
| Age: 31 to 54 | 21% | 25% |
| Age: 55 and over | 0% | 0% |
| Sociodemographic group: Indigenous people | 1% | 2% |
| Sociodemographic group: Persons with disabilities | 0% | 1% |
| Sociodemographic group: Visible minorities | 5% | 8% |
| Sociodemographic group: Recent immigrants | 1% | 1% |
| Marital status: Single | 70% | 64% |
| Marital status: Married or common-law | 26% | 30% |
| Marital status: Widow / divorced / separated | 2% | 3% |
| Education or skills level: High school or occupational training | 4% | 10% |
| Education or skills level: On-the-job training | 8% | 12% |
| Education or skills level: College, vocational education or apprenticeship training | 87% | 77% |
| Education or skills level: University degree | 0% | 0% |
- * Values may not equal 100% due to rounding or missing information.
Top 3 occupational groups for EBSMs participantsFootnote 53
Active claimants:
- skilled crafts and trades workers = 80%
- other manual workers = 8%
- skilled sales and service personnel and semi-skilled manual workers = 3% each
Former claimants:
- skilled crafts and trades workers = 66%
- other manual workers = 10%
- skilled sales and service personnel = 6%
Top 3 industries for EBSMs participants
Active claimants:
- construction = 61%
- retail trade = 8%
- other services (excluding public administration) = 7%
Former claimants:
- construction = 47%
- manufacturing = 13%
- retail trade = 9%
Labour market outcomes
The labour market outcomes are based on individuals who began their participation during the 2010 to 2012 period. Statistics focus on 5 years before program participation and 5 years after the program start year.
Active claimants
As shown in Chart 6, program participants increase their average earnings from $18,448 in the fifth year pre-program to $56,257 in the fifth year after the program start year.
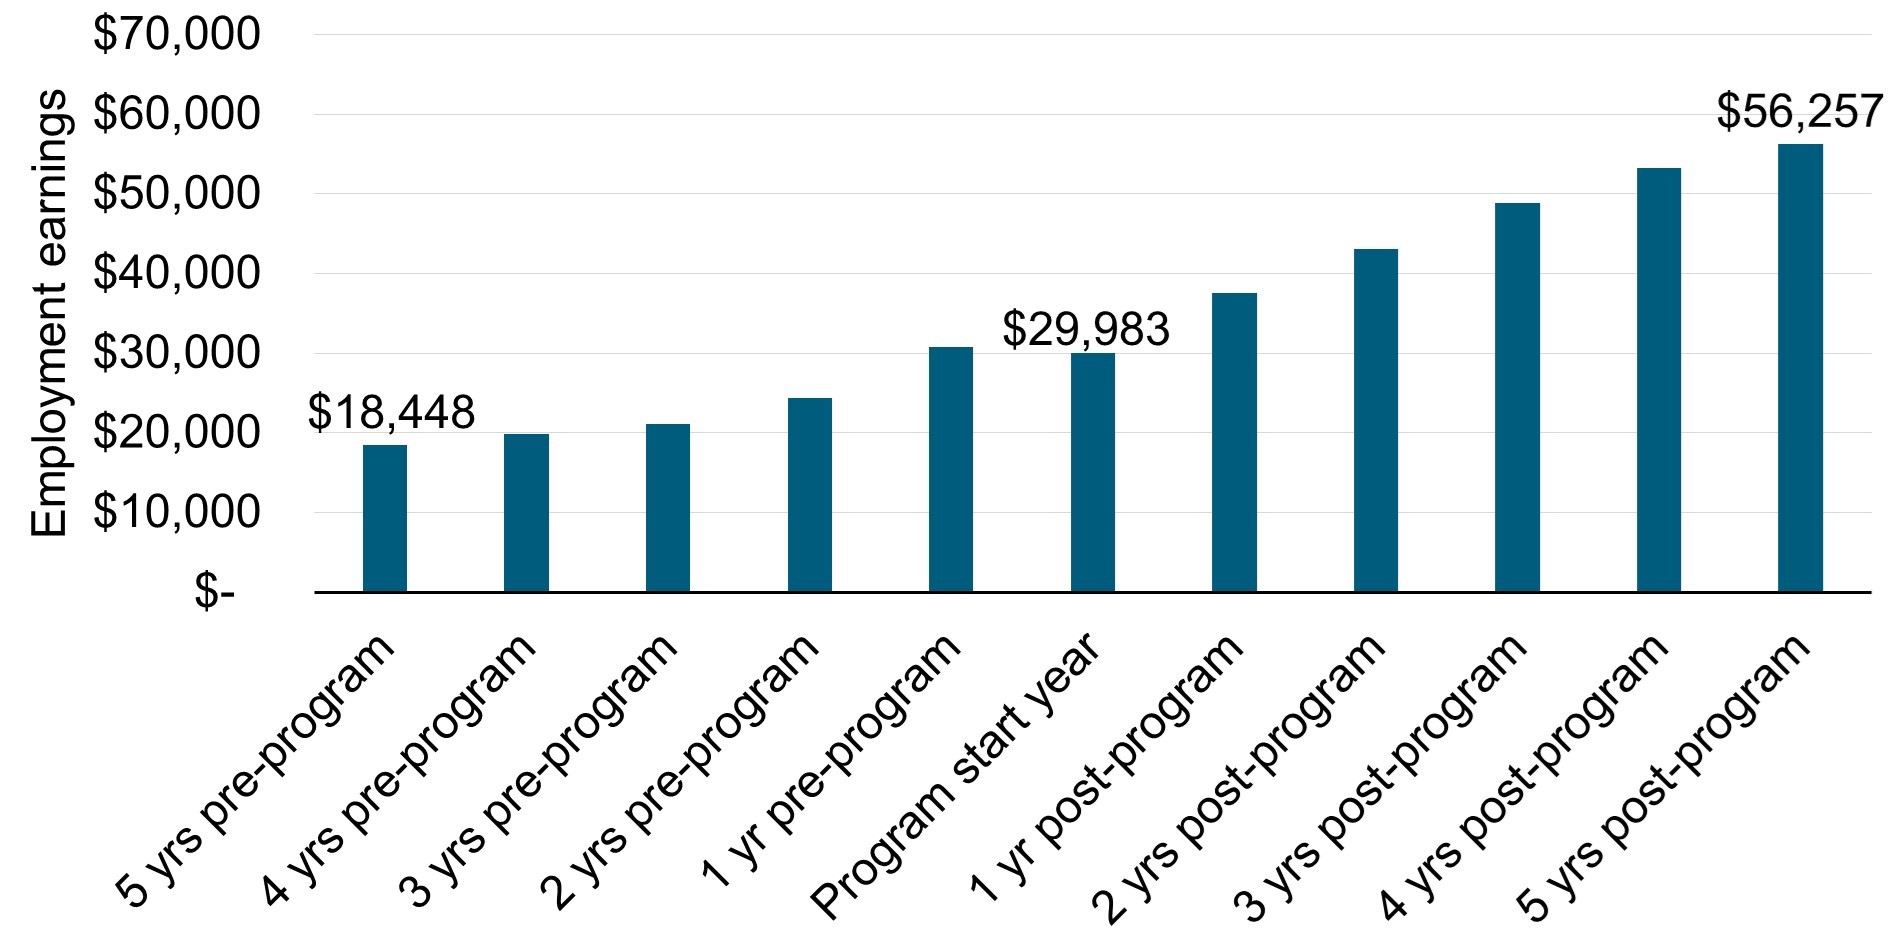
Chart 6 text description
| Year pre-post participation | Employment earnings for active claimants |
|---|---|
| 5 years pre-program | $18,448 |
| 4 years pre-program | $19,797 |
| 3 years pre-program | $21,061 |
| 2 years pre-program | $24,418 |
| 1 year pre-program | $30,706 |
| Program start year | $29,983 |
| 1 year post-program | $37,573 |
| 2 years post-program | $43,100 |
| 3 years post-program | $48,885 |
| 4 years post-program | $53,201 |
| 5 years post-program | $56,257 |
The proportion of employed participants declines gradually after the program start year but remains around 97%. The proportion of participants on EI Part I decreases from 100% in the program start year to 23% in the fifth year after the program start year. Participants decrease their dependence on income support from 23% in the program start year to 4% in the fifth year after participation.
Former claimants
As shown in Chart 7, program participants increased their average earnings from $20,125 in the fifth year pre-program to $55,581 in the fifth year after the program start year.

Chart 7 text description
| Year pre-post participation | Employment earnings for active claimants |
|---|---|
| 5 years pre-program | $20,125 |
| 4 years pre-program | $22,796 |
| 3 years pre-program | $24,218 |
| 2 years pre-program | $26,678 |
| 1 year pre-program | $30,404 |
| Program start year | $35,467 |
| 1 year post-program | $41,425 |
| 2 years post-program | $45,498 |
| 3 years post-program | $49,917 |
| 4 years post-program | $52,685 |
| 5 years post-program | $55,581 |
The proportion of employed participants declined by 1 percentage points annually after the program start year but remained at 93% 5 years after program start. The proportion of participants on EI Part I decreased from 62% in the program start year to 18% in the fifth year after the program start year. Participants decreased their dependence on income support from 13% in the program start year to 3% in the fifth year after participation.
Conclusions and recommendations
The LMDAs are the largest annual investment in active labour market programs and services in Canada. Based on the findings presented in this report, the EBSMs are meeting the objective of assisting individuals to obtain or keep employment through various active employment programs, including training or employment assistance services.
Summary of findings
Overall, incremental impacts demonstrate that participation in most EBSMs improves labour market attachment and reduces dependence on government income support compared to similar non-participants. A subgroup analyses shows that, with some exceptions:
- SD and EAS improved the labour market attachment and reduced the dependence on income support for most subgroups of active EI claimant participants
- JPI improved the labour market attachment and reduced the dependence on income support for female, male, and youth former claimant participants
- OJCP improved the labour market attachment and reduced the dependence on income support for female active claimant participants but had mixed results for former claimants
Over time, the social benefits of participating in JPI exceeded the initial investment costs for both active and former EI claimant participants. However, by the end of the post-program period,Footnote 54 the costs were found to exceed the benefits for active EI claimant participants in SD, OJCP, and EAS, and for former claimants in OJCP.
A series of supplemental studies address information gaps previously identified in LMDA evaluations for Ontario Job Creation Partnerships, Labour Market Partnerships, Research and Innovation, and SD-Apprentices. Each study identified lessons learned, best practices and challenges. When relevant, studies included considerations for policy design and development. Overall, it was found that:
- Ontario uses Ontario Job Creation Partnerships to:
- address a variety of barriers to employment experienced by their residents (such as, a lack of work experience)
- address the various labour market needs communities, subgroups of individuals, professions and economic sectors
- it is difficult to quantify all the positive impacts of OJCP for individuals, employers and communities
- Ontario uses Labour Market Partnerships programs to assist employers, communities and/or industries to address their labour force adjustment and human resource needs
- the province uses the Research and Innovation support measure to enable innovation in the employment and training system and to explore new ways of providing employment and training supports to employers, workers, and job seekers, including those who are not currently supported by other LMDA funded programs and services
- after participating in SD, apprentices increase their employment earnings and decrease their dependence on government income support
Recommendations
Since 2012, 15 qualitative and quantitative studies addressed issues and questions related to EBSM design, delivery and effectiveness:
- the quantitative studies successfully assessed the effectiveness and efficiency of EBSMs by producing incremental impacts and cost-benefit analysis
- the qualitative studies identified specific challenges, lessons learned and best practices associated with the design and delivery of EBSMs
- each study included key considerations for program and policy development or recommendations
The recently completed evaluation of the Workforce Development Agreements complements the LMDA qualitative studies. This evaluation was also supported by literature reviews and provided unique insights into challenges and lessons learned to assist persons with disabilities, immigrants and those further removed from the labour market.
Most results from this evaluation stem from the conduct of advance causal analysis whereby impacts found could be attributed to a specific EBSM. These analyses are predicated on having access to high quality administrative records, thereby confirming the importance of the capacity to leverage and integrate relevant administrative data.
From these main findings, 2 key recommendations emerge:
Recommendation #1
Ontario is encouraged to share and discuss lessons learned, best practices and challenges associated with the design and delivery of programs and services. Discussions are encouraged with ESDC, at the bilateral or multilateral levels as well as with service delivery network if necessary.
Recommendation #2
Ontario is encouraged to pursue efforts to maintain and strengthen data collection provisions in support of reporting, performance measurement and data-driven evaluations at the national and provincial levels.
References
Allin, S., Corscadden, L., Gapanenko, K., and Grignon, M. Lifetime Distributional Effects of Publicly Financed Health Care in Canada. CIHI, 2013.
Athey, S., and Imbens, G. Machine Learning Methods Economists Should Know About. Annual Review of Economics, 2019.
Douwere G. and Huju Liu. The Entry into and Exit out of Self-employment and Business Ownership in Canada. Statistics Canada, 2018.
Employment and Social Development Canada. Third Cycle for the Horizontal Evaluation of the Labour Market Development Agreements: Cost-Benefit Analysis of Employment Benefits and Support Measures in Ontario. Internal document, 2022.
Employment and Social Development Canada. Cycle II of the Evaluation of the Labour Market Development Agreements: Cost-Benefit Analysis of Employment Benefits and Support Measures in Ontario. Internal document, 2015.
Employment and Social Development Canada. Design and delivery of the Ontario Job Creation Partnerships program. Internal document, 2019.
Employment and Social Development Canada. Employment Insurance Monitoring and Assessment Reports. 2011 to 2022.
Employment and Social Development Canada. Horizontal evaluation of the Labour Market Development Agreements, Design and delivery of the Labour Market Partnerships program in Ontario. Internal document, 2021.
Employment and Social Development Canada. Labour Market Development Agreements Process for Determination of Similarity. Internal document, 2012.
Employment and Social Development Canada. Evaluation of the Canada-Ontario Labour Market Development Agreements – Cycle III: Examination of the medium-term outcomes from 2010 to 2017. Internal document, 2021.
Employment and Social Development Canada. Third Cycle for the Horizontal Evaluation of the Labour Market Development Agreements: Quantitative Methodology Report. Internal document, 2019.
Appendix A. List of 7 studies included in this synthesis report
Overview of studies included in this synthesis report
Study 1: Examination of medium-term outcomes from 2010 to 2017
Evidence generated: profile of active and former EI claimants in Ontario; outcomes by claimant type and by subgroup
Methods: before and after results of program participation
Reference period: 2010 to 2012 participants
Observation period: up to 12 years (5 years before participation, 1 to 2 years of participation, and 5 years after participation)
Study 2: Estimation of medium-term incremental impacts from 2010 to 2017
Evidence generated: incremental impacts for active and former EI claimants in Ontario; incremental impacts by subgroup; profile and socio-demographic characteristics of participants
Methods: non-experimental method using propensity score matching in combination with Difference-in-Differences; statistical profiling
Reference period: 2010 to 2012 participants
Observation period: up to 7 years (1 to 2 years in program, and up to 5 years after participation)
Study 3: Cost-Benefit Analysis of Employment Benefits and Support Measures in Ontario
Evidence generated: cost-benefit analysis
Methods: non-experimental method using propensity score matching in combination with Difference-in-Differences; cost analysis
Reference period: 2010 to 2012 participants
Observation period: 5 years post-program for JPI, OJCP and EAS; 10 years post-program for SD
Study 4: Cost-Benefit Analysis: Incorporating Public Health Care Costs Savings in the Context of the Ontario Labour Market Programs Evaluation
Evidence generated: cost-benefit analysis
Methods: estimation of adjusted annualized healthcare costs
Reference period: 2010 to 2012 participants
Observation period: 5 years post-program for JPI, OJCP and EAS; 10 years post-program for SD
Study 5: Design and delivery of the Ontario Job Creation Partnerships program
Evidence generated: program design and delivery; challenges and lessons learned
Methods: non-experimental approach (from cycle II); statistical analysis; document review; 10 semi-structured telephone interviews with 21 key informants
Reference period: 2015 to 2017 participants
Observation period: 2015 to 2019
Study 6: Design and delivery of the Labour Market Partnerships program in Ontario
Evidence generated: program design and delivery; challenges and lessons learned
Methods: document review; questionnaire completed by 2 Ontario Ministries; 8 interviews with 10 key informants in Ontario
Reference period: 2018 to 2020
Observation period: design and delivery at the time of the data collection
Study 7: Design and delivery of the Research and Innovation Support measure in Ontario
Evidence generated: program design and delivery; challenges and lessons learned
Methods: document review; questionnaire completed by provincial program officials
Reference period: 2017 to 2020
Observation period: design and delivery at the time of the data collection
Page details
- Date modified: