
Evaluation of the Canada-Northwest Territories Labour Market Development Agreement
On this page
- List of abbreviations
- List of charts
- List of tables
- Executive summary
- Management response
- Introduction
- Canada-Northwest Territories Labour Market Development Agreement
- Methodology
- Evaluation findings
- Main findings
- Profile of participants
- Incremental impacts for active and former EI claimant participants in Building Essential Skills and active claimant participants in EAS
- Outcomes for former EI claimant participants in Training-on-the-Job and active and former EI claimant participants in EAS
- Population subgroup profiles and labour market outcomes
- Cost-benefit analysis
- Supplemental studies
- Conclusions and recommendations
- References
- Appendix A. List of 8 studies included in this national synthesis report
Alternate formats

Large print, braille, MP3 (audio), e-text and DAISY formats are available on demand by ordering online or calling 1 800 O-Canada (1-800-622-6232). If you use a teletypewriter (TTY), call 1-800-926-9105.
List of abbreviations
- EAS
- Employment Assistance Services
- EBSM
- Employment Benefits and Support Measures
- EI
- Employment Insurance
- ESDC
- Employment and Social Development Canada
- JCP
- Job Creation Partnerships
- LMDA
- Labour Market Development Agreements
- SA
- Social assistance
List of charts
- Chart i. Change in probability of being employed in participants relative to non-participants (annual average)
- Chart ii. Employment earnings of participants relative to non-participants (annual average)
- Chart iii. Change in use of government income support (annual average)
- Chart 1. Change in probability of being employed in participants relative to non-participants (annual average)
- Chart 2. Employment earnings of participants relative to non-participants (annual average)
- Chart 3. Change in the use of EI benefits (annual average)
- Chart 4. Change in the use of SA benefits (annual average)
- Chart 5. Change in use of government income support (annual average)
- Chart 6. Pre and post-participation change in participants’ average annual earnings
- Chart 7. Pre and post-participation change in the proportion of participants who received EI and SA benefits
- Chart 8. Pre and post-participation change in participants’ incidence of employment
List of tables
- Table i. Share of LMDA funding and average cost per Action Plan Equivalent per participant in the Northwest Territories for 2010 to 2012
- Table ii. Number of years for the benefits to exceed program costs
- Table 1. Share of LMDA funding and average cost per Action Plan Equivalent per participant in the Northwest Territories
- Table 2. Profile of active and former EI claimant participants in EBSMs from 2009 to 2012 in the Northwest Territories
- Table 3. Employment and earning levels, and use of SA in the year before participation in EBSMs
- Table 4. Profile of female active and former EI claimant participants in EBSMs in the Northwest Territories in 2009 to 2012
- Table 5. Labour market outcomes for female participants (annual average)
- Table 6. Profile of male active and former EI claimant participants in EBSMs in the Northwest Territories in 2009 to 2012
- Table 7. Labour market outcomes for male participants (annual average)
- Table 8. Profile of youth active and former EI claimant participants in EBSMs in the Northwest Territories in 2009 to 2012
- Table 9. Labour market outcomes for youth participants (annual average)
- Table 10. Profile of Indigenous active and former EI claimant participants in EBSMs in the Northwest Territories in 2009 to 2012
- Table 11. Labour market outcomes for Indigenous participants (annual average)
- Table 12. Cost-benefit results for active and former EI claimant participants
Executive summary
The Canada-Northwest Territories Labour Market Development Agreement (LMDA) is a bilateral agreement between Canada and the Northwest Territories for the design and delivery of Employment Benefits and Support Measures (EBSMs).
The objective of EBSMs is to assist individuals to obtain or keep employment through various active employment programs, including training or employment assistance services. Successful delivery of EBSMs is expected to result in participants receiving needed services, a quick return to work, and savings to the Employment Insurance (EI) account.
Programs and services delivered by the Northwest Territories have to correspond to the EBSM categories defined under the EI Act. The following is a short description of the EBSMs examined in the evaluation.
Building Essential Skills provides direct financial assistance to individuals to select, arrange, and pay for training. Training is tailored to the needs of participants through counselling and career orientation. It can include adult-based education, literacy and essential skills, language training, short-term training and occupational training leading to certification from an accredited institution.
Training-on-the-Job helps participants obtain on-the-job work experience by providing employers with a wage subsidy.
Job Creation Partnerships (JCP) provide participants with opportunities to gain work experience that will lead to ongoing employment. Employment opportunities are provided by projects that contribute to developing the community and the local economy.Footnote 1
Self-Employment Option aims to assist participants in creating employment for themselves by providing them with a range of services.
Employment Assistance Services (EAS) support individuals as they prepare to enter or re-enter the workforce or assist them to find a better job. Services can include job search services, career development and counselling, and résumé writing assistance. These services are referred to as ‘light touch interventions’ due to their very short duration. They can be provided on a one-on-one basis or in a group setting.
Strategic Workforce Initiatives aim to support community partners in undertaking labour market activities that promote labour force development, workforce adjustments and effective human resources planning.
Research and Innovation aims to fund previously untried solutions to specific labour market issues or problems and create strategic investment mechanisms to fund experiments that could inform the development of policies, programs or industry practices.
The LMDA investment
In fiscal year 2020 to 2021, Canada transferred approximately $4.8 million (including nearly $1.5 million in administration funds) to the Northwest Territories.
Table i provides an overview of the share of funding allocated to EBSMs and the average cost per participant. The average cost per participant is calculated based on the 2009 to 2012 data from the EI Monitoring and Assessment Reports. The 2009 to 2012 period corresponds with the cohort of participants selected for incremental impacts and cost-benefit analysis in the LMDA evaluation.
| Employment Benefits and Support Measures | Share of funding | Average cost – active claimants | Average cost – former claimants |
|---|---|---|---|
| Building Essential Skills | 51% | $8,629 | $9,232 |
| Employment Assistance Services | 29% | $1,579 | $1,579 |
| Strategic Workforce Initiatives | 8% | n/a | n/a |
| Self-Employment Option | 7% | $18,778 | $18,419 |
| Training-on-the-Job | 5% | $6,988 | $6,152 |
| Job Creation Partnerships | n/a | $2,033 | $571 |
| Research and Innovation | n/a | n/a | n/a |
| Total | 100% | n/a | n/a |
- Sources: EI Monitoring and Assessment Reports for fiscal yearsFootnote 4 2010 to 2011 and 2011 to 2012.
Compared to the 2010 to 2012 period, the LMDA budget allocation varied for some programs and services in 2020 to 2021. For example, investments in Building Essential Skills decreased from 51% to 26%, and investments in Training-on-the-Job increased from 5% to 20% of EBSM expenditures in the Northwest Territories.
Evaluation objectives
Building on the success of previous LMDA evaluation cycles, the aim of this evaluation is to fill in knowledge gaps about the effectiveness, efficiency, as well as the design and delivery of EBSMs in the Northwest Territories.
Evaluation methodology
The findings in this report are drawn from 8 separate evaluations. These studies examine issues related to program effectiveness, efficiency, and design and delivery. A mix of qualitative and quantitative methods are used, including:
- incremental impact analysis for participants who began an intervention between 2009 and 2012
- outcome analysis
- cost-benefit analysis (including savings to health care)
- key informant interviews with 19 territorial program officials, caseworkers, service providers, and project holders
- questionnaires
- document and literature reviews
The incremental impacts are estimated for 2 types of EI claimants:
- active claimants are participants who started an EBSM intervention while collecting EI benefits
- former claimants are participants who started an EBSM intervention up to 3 years after the end of their EI benefitsFootnote 5
Key findings
Across the Northwest Territories, nearly 1,670 EI active and former claimants began participating in LMDA programs and services between 2009 and 2012.
Effectiveness and efficiency of EBSMs
- overall, incremental impacts and labour market outcomes demonstrate that participation in some EBSMs improves labour market attachment and reduces use of government income supports
- labour market outcomes analysis for Training-on-the-Job found that annual earnings were higher in the post-participation period and that use of EI benefits was lower
- a subgroup analysis of labour market outcomes shows that all sub-groups of participants in Building Essential Skills and EAS had higher annual earnings and used EI benefits less in the post-participation period
- the social benefits of participating in EBSMs exceeded initial investment costs for most interventions over time
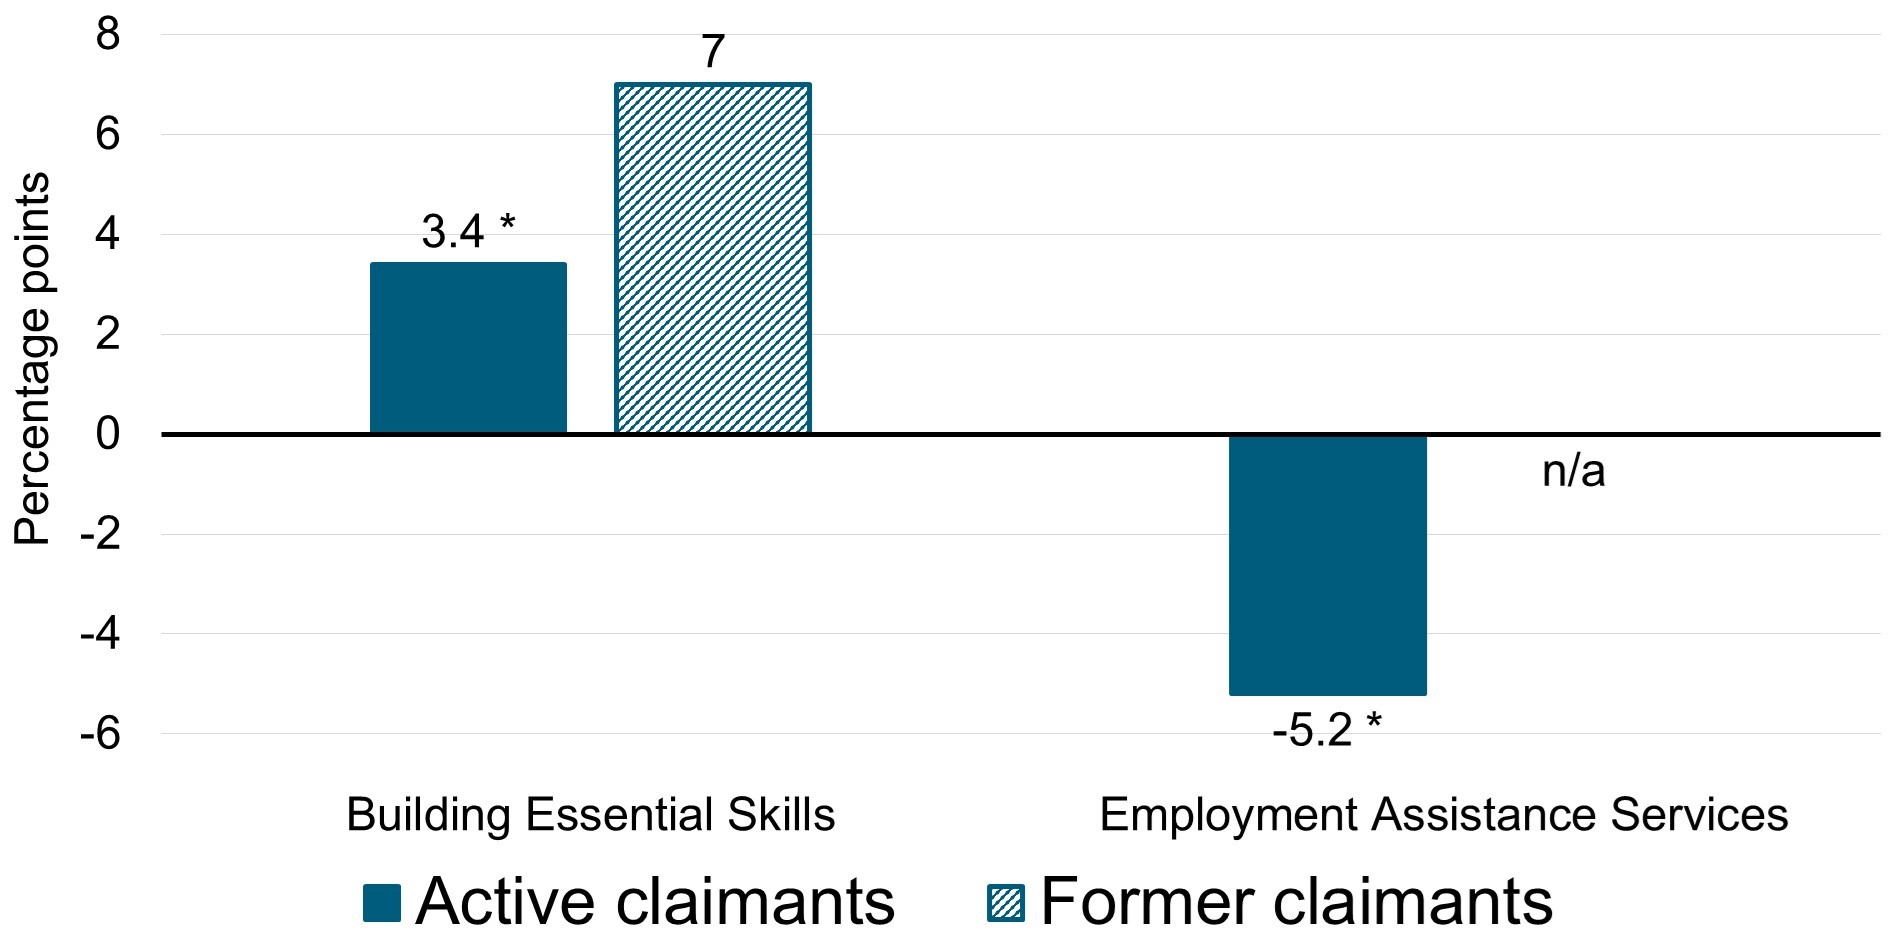
Chart i presents the incremental impacts on the incidence of employment for active and former claimants by EBSM. The estimates can be interpreted as a chance in the probability of being employed following participation. For example, participation in Building Essential Skills increases the probability of being employed by 7 percentage points for former EI claimants relative to non-participants.

- *The impact is not statistically significant over the entire post-participation period.
- Note: Impacts are estimated over 4 post-program years (or 5 years in the case of EAS).
Text description – Chart i
| Program name | Incidence of employment for active claimants (percentage points) |
Incidence of employment for former claimants (percentage points) |
|---|---|---|
| Building Essential Skills | 3.4* | 7 |
| Employment Assistance Services | -5.2* | n/a |
- *The impact is not statistically significant over the entire post-participation period.
- Note: Impacts are estimated over 4 post-program years (or 5 years in the case of EAS).
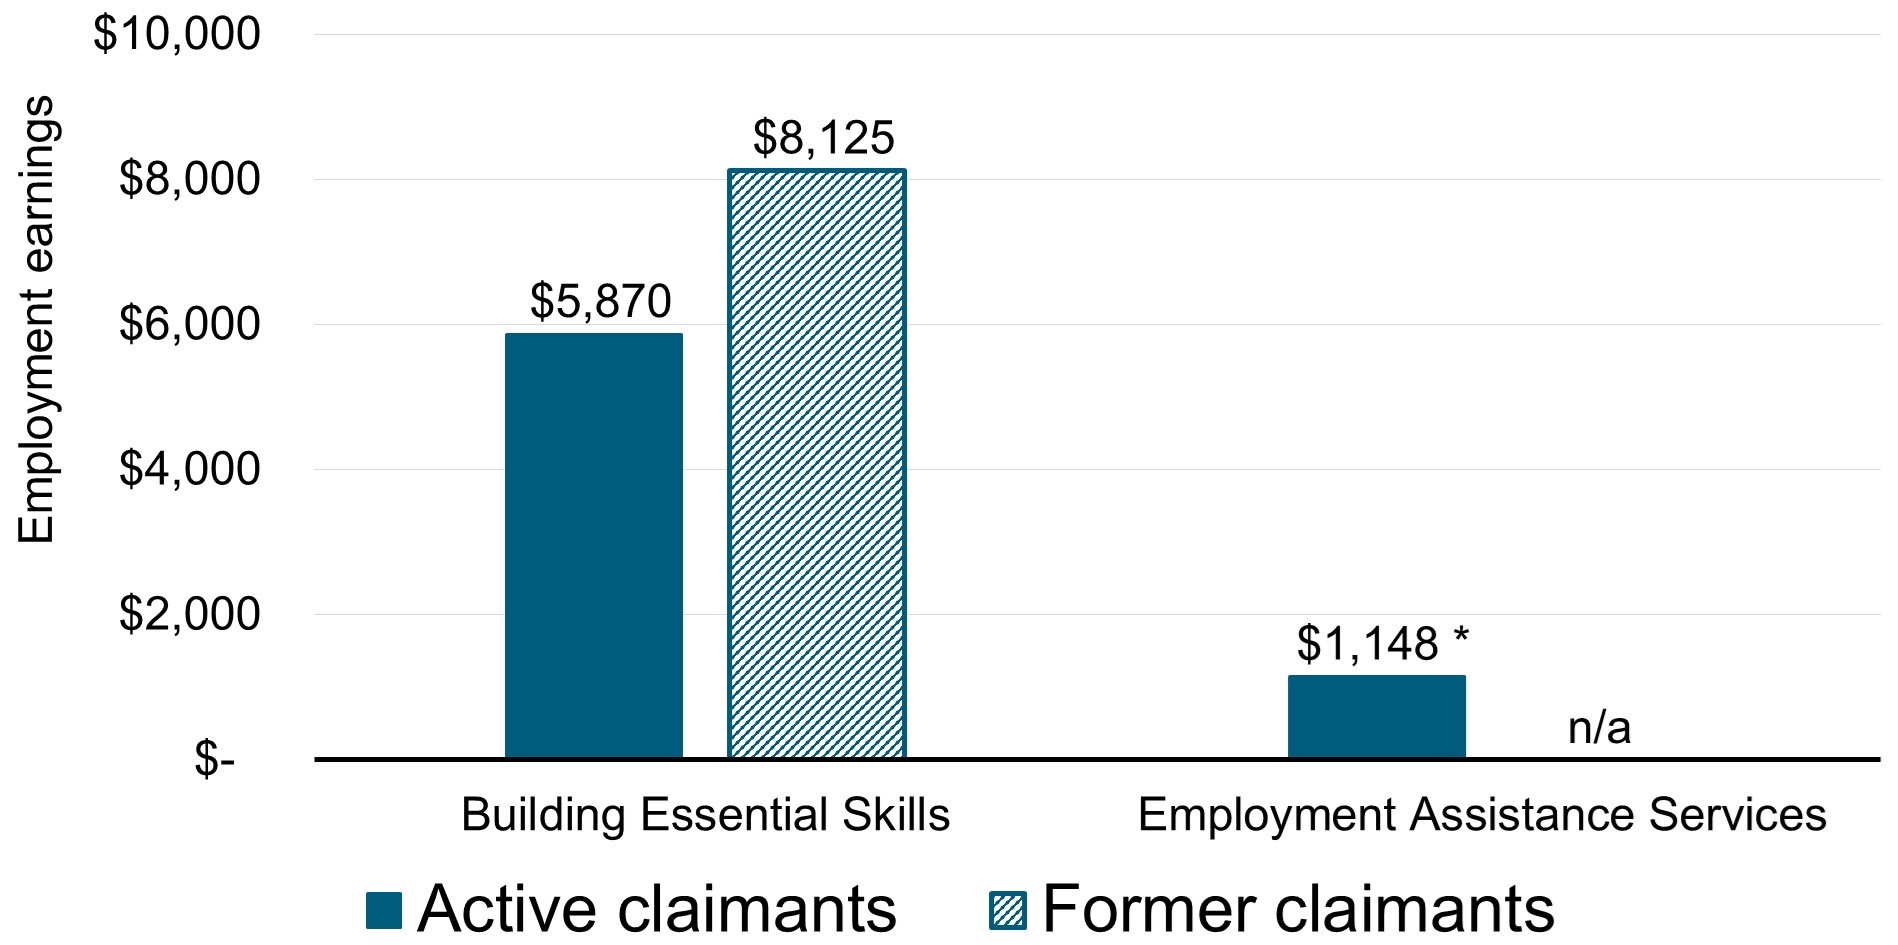
Chart ii presents the annual average in employment earnings for active and former claimants over the post-participation period. For example, active EI claimants who participated in Building Essential Skills, on average, earned $5,870 more than similar non-participants.
- *The impact is not statistically significant over the entire post-participation period.
- Note: Impacts are estimated over 4 post-program years (or 5 years in the case of EAS).
Text description – Chart ii
| Program name | Employment earnings of active claimants | Employment earnings of former claimants |
|---|---|---|
| Building Essential Skills | $5,870 | $8,125 |
| Employment Assistance Services | $1,148* | n/a |
- *The impact is not statistically significant over the entire post-participation period.
- Note: Impacts are estimated over 4 post-program years (or 5 years in the case of EAS).
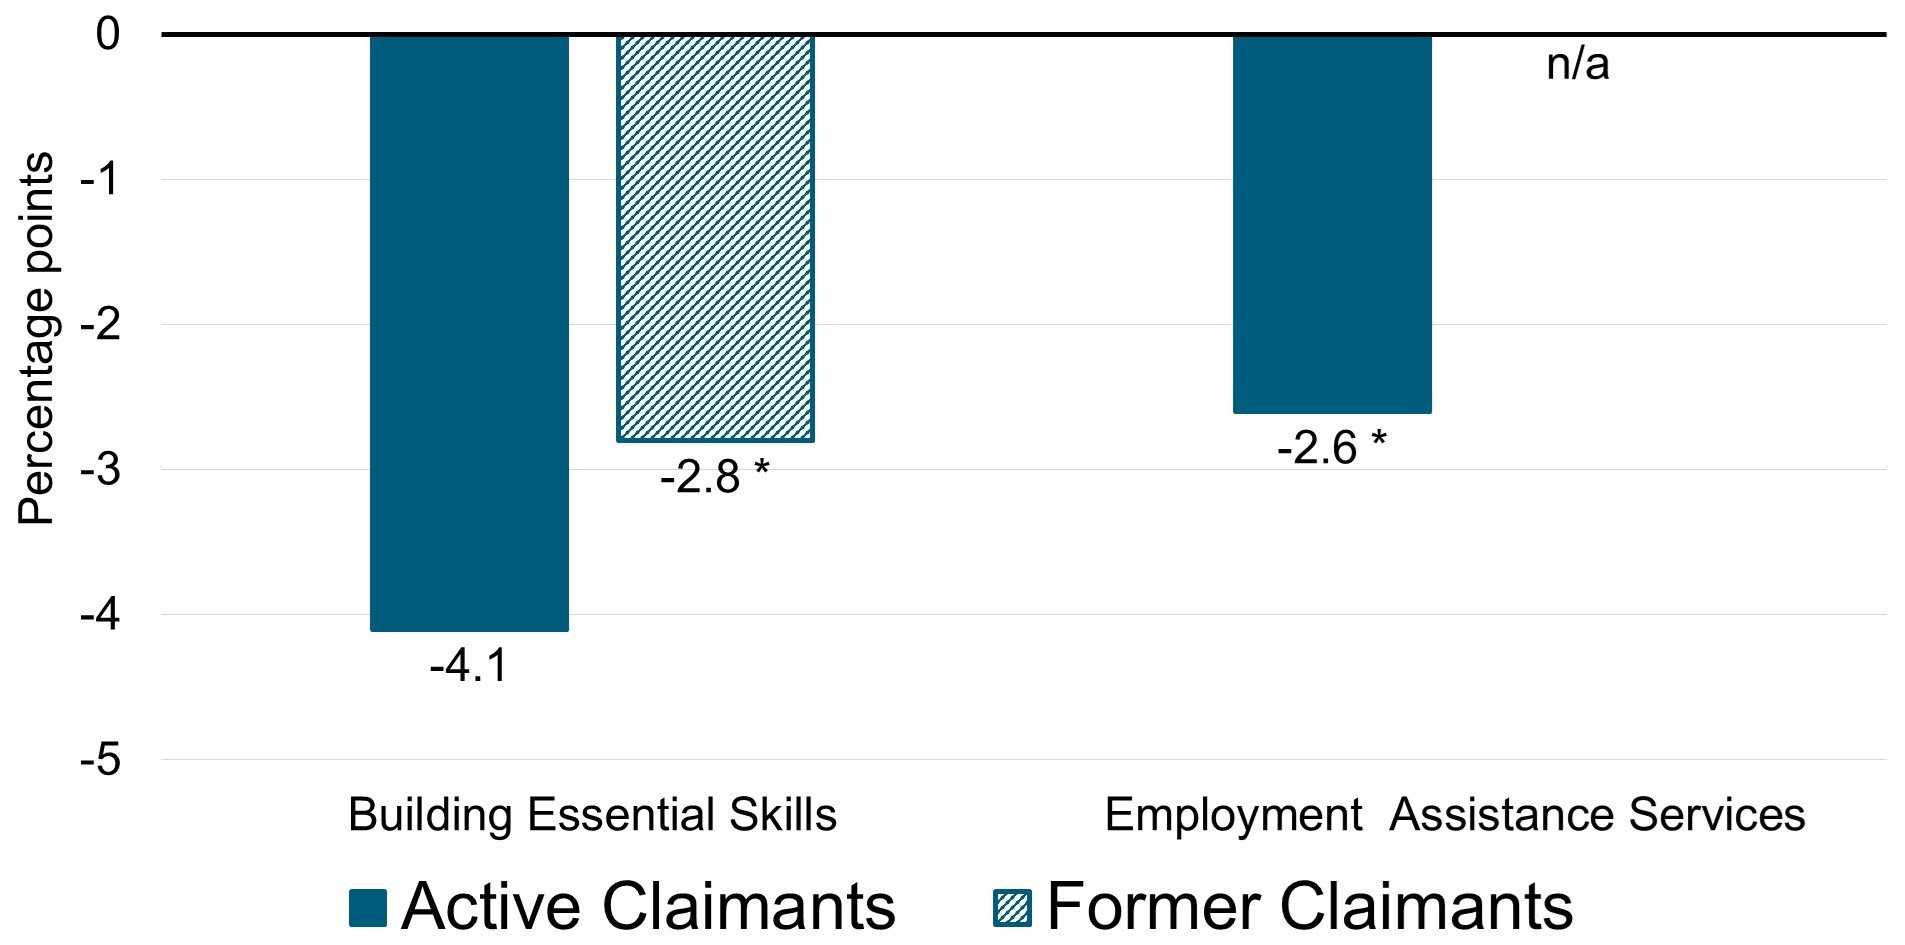
As shown in Chart iii, active claimants who participated in Building Essential Skills reduced their use of government income supports by 4.1 percentage points post-participation.
- *The impact is not statistically significant over the entire post-participation period.
- Note: Impacts are estimated over 4 post-program years (or 5 years in the case of EAS).
Text description – Chart iii
| Program name | Use of government income support for active claimants (percentage points) |
Use of income support for former claimants (percentage points) |
|---|---|---|
| Building Essential Skills | -4.1 | -2.8* |
| Employment Assistance Services | -2.6* | n/a |
- *The impact is not statistically significant over the entire post-participation period.
- Note: Impacts are estimated over 4 post-program years (or 5 years in the case of EAS).
Table ii presents the number of years required for the social benefits to exceed program costs. Social benefits to participation exceed initial investment costs over a period ranging from within the program start year to 1.6 years.
| Indicator | Building Essential Skills active claimants (10 years post-program) | Employment Assistance Services active claimants (5 years post-program) | Building Essential Skills former claimants (10 years post-program) |
|---|---|---|---|
| Payback period (years after end of participation) | 1.3 | <11 | 1.6 |
- 1Paid back within the program start year.
Supplemental studies
A series of supplemental studies addresses information gaps previously identified in LMDA evaluations regarding the design and delivery, challenges and lessons learned for Self-Employment Option, JCP, Strategic Workforce Initiatives, and Research and Innovation.
Most of these interventions are not suitable for incremental impact analysis. For example, Strategic Workforce Initiatives and Research and Innovation do not collect participant information. As a results, a mix of qualitative and quantitative methods are used to examine these EBSMs in detail. Key considerations are included to help guide future program and policy discussions
Self-Employment Option study
The Self-Employment Option program aims to assist participants in creating employment for themselves by providing them with a range of services.
The following information about the labour market outcomes of program participants is based solely on the opinions of key informants and EI/CRA data. Due to the low number of survey respondents in the Northwest Territories, this report is unable to provide post-program outcome information from participants.
According to administrative data, Active EI claimants decreased their receipt of EI benefits after participating in the Self-Employment Option program. The number of weeks in receipt of EI benefits post-program follows a similar pattern.
Key informants identified the following primary reasons that participants succeeded at starting and maintaining their businesses:
- having skills/experience related to the business
- personal commitment and motivation
- personally suited to self-employment
- good business idea and product for the market at the time
- having supports in place (such as relational, family, industry connections/network)
In the Northwest Territories, key informants identified the following primary reasons that participants fail at starting and maintaining their businesses:
- not being prepared for being self-employed (such as unrealistic projections, inadequate financial planning)
- not understanding what is involved with launching and maintain a business (such as ignoring market research, poor project management skills, focused on quick income)
- lack of dedication and commitment
- not marketing the product or service
- change in life circumstances or a downturn in the economy
Job Creation Partnerships study
JCP is an employment program developed to provide financial support to non-profit community organizations for short term projects that provide job seekers with a valuable work experience and the potential for long-term employment. As participants work on various aspects of the project activities, they develop skills required in the workforce.
In addition to gaining work experience, key informants expected participants to develop transferable skills and to enhance their career development and job search abilities. Sponsors can benefit from JCP through increased capacity by having access to labour, implementing their projects, and developing partnerships with other organisations. At the community level, JCP projects are expected to support the local economy.
Key informants highlighted the importance of aligning the motivations of sponsors and participants with the objective of JCP to prepare individuals for employment. The removal of material related costs from eligible project costs has ensured that sponsors focus their attention on participants’ needs.
Strategic Workforce Initiatives study
The Strategic Workforce Initiatives program aims to support community partners in undertaking labour market activities that promote labour force development, workforce adjustments and effective human resources planning. It includes a wide range of funded activities, such as:
- labour market research
- development of strategic plans to address community economic and employment issues
- promotion of employment supports to employers and unemployed individuals
- Communications to share best practices or to initiate discussions regarding community challenges and opportunities
- coordination to facilitate community problem solving related to labour market/employment challenges; and/or to support the development of local planning groups
- coordination of work force adjustment to help businesses set up support mechanisms to assist employees who are at risk of losing their jobs
The Department of Education, Culture and Employment and program officials confirmed that the Department carried out activities to support the formation and maintenance of partnerships as a part of the Strategic Workforce Initiatives program design and delivery. The Department and key informants explained that partners’ expertise, time and financial contributions are all essential to project implementation and success.
Research and Innovation study
Research and Innovation projects in the Northwest Territories support the design and development of new initiatives and programs. Funded activities included the creation of community labour market development plans, including stakeholder engagement, community labour force analysis, and identification of labour force development opportunities, community training needs and implementation road maps.
Recommendations
Since 2012, 15 qualitative and quantitative studies addressed issues and questions related to EBSM design, delivery and effectiveness. The quantitative studies successfully assessed the effectiveness and efficiency of EBSMs by producing incremental impacts and cost-benefit analysis. The qualitative studies help to contextualize the findings from the quantitative studies and to identify specific challenges, lessons learned and best practices associated with the design and delivery of EBSMs. Each study included key considerations for program and policy development or recommendations
In addition, the recently completed evaluation of the Workforce Development Agreements complements the LMDA qualitative studies. This comprehensive evaluation provided unique insights into challenges and lessons learned to assist persons with disabilities, immigrants and those further removed from the labour market.
Most results from this evaluation stem from the conduct of advance causal analysis whereby impacts found could be attributed to a specific EBSM. These analyses are predicated on having access to high quality administrative records, thereby confirming the importance of the capacity to leverage and integrate relevant administrative data.
From these main findings, 2 key recommendations for the Northwest Territories emerge.
Recommendation #1
The Northwest Territories are encouraged to share and discuss lessons learned, best practices and challenges associated with the design and delivery of program and services. Discussions are encouraged with ESDC, at the bilateral or multilateral levels as well as with the territorial service delivery network if necessary.
Recommendation #2
The Northwest Territories are encouraged to pursue efforts to maintain and strengthen data collection provisions in support of reporting, performance measurement and data-driven evaluations at the national and territorial levels.
Management response
The Canada-Northwest Territories Labour Market Development Agreement (LMDA) is a bilateral agreement between Canada and the Northwest Territories for the design and delivery of Employment Benefits and Support Measures (EBSMs).
The objective of EBSMs is to assist individuals to obtain or keep employment through various active employment programs, including training or employment assistance services (EAS). Successful delivery of EBSMs is expected to result in participants receiving needed services, a quick return to work, and savings to the Employment Insurance (EI) account.
Across the Northwest Territories, nearly 1,670 EI active and former claimants began participating in LMDA programs and services between 2009 and 2012.
Evaluation methodology
The findings in this report are drawn from 8 separate evaluation studies carried out at the territorial level. These studies examine issues related to program effectiveness, efficiency, and design and delivery.
The 2009 to 2012 timeframe was selected in order to assess the impacts of EBSMs in the years following participation. Impacts were assessed over a period of at least 4 years after program completion up to the 2017 calendar year (most recent available information at the time of this evaluation).
Programs and services examined in this study include:
- Employment benefits:
- Building Essential Skills
- Training-on-the-Job
- Job Creation Partnerships
- Self-Employment Option
- Support measures
- Employment Assistance ServicesFootnote 7
- Strategic Workforce Initiatives
- Research and Innovation
From these main findings, 2 key recommendations for the Northwest Territories emerge.
Recommendation #1
The Northwest Territories are encouraged to share and discuss lessons learned, best practices and challenges associated with the design and delivery of program and services. Discussions are encouraged with ESDC, at the bilateral or multilateral levels as well as with the territorial service delivery network if necessary.
Response
As the evaluation shows, LMDAs improve individuals’ labour market attachment and reduce dependence on governmental income supports. The Government of the Northwest Territories accepts the recommendation and continues to share best practices and lessons learned in the delivery of labour market programs within and among its department of Education, Culture and Employment Regional Service Centres, as well as with other jurisdictions and external partners through the Forum of Labour Market Ministers. The department of Education, Culture and Employment will also take opportunity to discuss best practices with ESDC through its regular bilateral Workforce Development Committee meetings established under its bilateral Labour Market Transfer Agreements.
Recommendation #2
The Northwest Territories are encouraged to pursue efforts to maintain and strengthen data collection provisions in support of reporting, performance measurement and data-driven evaluations at the national and territorial levels.
Response
Since the evaluation period in question, and in accordance with the implementation of the new Performance Measurement Plan associated with new LMTAs signed in 2018, the department of Education, Culture and Employment’s Client Management Administration System has been updated to improve reporting on labour market program indicators and client counselling interactions with program staff. The department of Education, Culture and Employment accepts the recommendation and continues to enhance and strengthen its reporting, including through regular updates to its CMAS system and through robust staff training and development which supports enhanced data quality and accurate reporting. Labour market program data entry from department of Education, Culture and Employment Service Centres is supported by program staff at the department of Education, Culture and Employment headquarters through on-going training and engagement with Career Development Officers and regional Managers.
Introduction
Employment and Social Development Canada (ESDC) worked jointly with the Northwest Territories to undertake the third cycle evaluation (2018 to 2023) of the Labour Market Development Agreements (LMDA).
The first cycle of LMDA evaluations was carried out from 1998 to 2012. It involved the conduct of separate formative and summative evaluations under the guidance of a bilateral Joint Evaluation Committee.
Building on lessons learned and best practices from the first cycle, the second cycle of LMDA evaluations was undertaken between 2012 and 2017. The second cycle was designed and implemented under the guidance of a federal-provincial/territorial LMDA Evaluation Steering Committee. The work was supported by bilateral discussions at the Joint Evaluation Committee.
The third LMDA evaluation cycle builds on the success of the second cycle. The aim is to fill in knowledge gaps about the effectiveness, efficiency, and design and delivery of Employment Benefits and Support Measures (EBSMs). The evaluation cycle was designed and implemented under the guidance of a federal-provincial/territorial LMDA Evaluation Steering Committee composed of ESDC and 12 participating provinces and territories.
For the Northwest Territories, this report presents a summary of the third cycle evaluation findings from 8 studies.
Canada-Northwest Territories Labour Market Development Agreement
The LMDAs are bilateral agreements between Canada and each province and territory for the design and delivery of EBSM programs and services. They were established under Part II of the 1996 Employment Insurance (EI) Act.
In fiscal year 2020 to 2021, Canada transferred nearly $29.7 million to the Northwest Territories.Footnote 8 Under the agreement, the Northwest Territories is responsible for the design and delivery of programs and services aimed at assisting individuals to prepare for, obtain, and maintain employment.
LMDA programs and services are classified under 2 categories:
- Employment benefitsFootnote 9, Footnote 10 fall into 5 sub-categories:
- Building Essential Skills
- Training-on-the-Job
- Self-Employment Option
- Job Creation Partnerships
- Targeted Earnings SupplementsFootnote 11
- Support measures fall into 3 sub-categories:
- Employment Assistance ServicesFootnote 12
- Strategic Workforce Initiatives
- Research and Innovation
The Northwest Territories has the flexibility to adapt EBSMs to its territorial context as long as they are consistent with Part II of the EI Act.Footnote 13
The objective of EBSMs is to assist individuals to obtain or keep employment through various active employment programs, including training or employment assistance services. Successful delivery of EBSMs is expected to result in participants receiving needed services, a quick return to work, and savings to the EI account.
Programs and services examined in this study include employment benefits and support measures.
Employment benefits
Building Essential Skills provides direct financial assistance to individuals to select, arrange, and pay for training. Training is tailored to the needs of participants through counselling and career orientation. It can include adult-based education, literacy and essential skills, language training, short-term training and occupational training leading to certification from an accredited institution.
Training-on-the-Job participants obtain on-the-job work experience by providing employers with a wage subsidy.
Job Creation Partnerships (JCP) provide participants with opportunities to gain work experience that will lead to ongoing employment. Employment opportunities are provided by projects that contribute to developing the community and the local economy.
Self-Employment Option aims to assist participants in creating employment for themselves by providing them with a range of services.
Support measures
Employment Assistance Services (EAS) supports individuals as they prepare to enter or re-enter the workforce or assists them to find a better job. Services can include job search services, career development and counselling, and résumé writing assistance. These services are referred to as ‘light touch interventions’ due to their very short duration. They can be provided on a one-on-one basis or in a group setting.
Strategic Workforce Initiatives aim to support community partners in undertaking labour market activities that promote labour force development, workforce adjustments and effective human resources planning.
Research and Innovation aims to fund previously untried solutions to specific labour market issues or problems and create strategic investment mechanisms to fund experiments that could inform the development of policies, programs or industry practices.
Eligible participants covered in this study
The incremental impacts are estimated for active and former EI claimants:
- active claimants are participants who started an EBSM intervention while collecting EI benefits
- former claimants are participants who started an EBSM intervention up to 3 years after the end of their EI benefitsFootnote 14
Average EBSM share of funding and cost per Action Plan Equivalent
Table 1 provides an overview of the share of funding allocated to EBSMs and the average cost per Action Plan Equivalent for active and former claimants in the Northwest Territories. It is noted that the average cost per participant is calculated based on the 2009 to 2012 data from the EI Monitoring and Assessment Reports. The 2009 to 2012 period corresponds with the cohort of participants selected for incremental impacts and cost-benefit analysis in the LMDA evaluation.
From the 2010 to 2012 time period to the 2020 to 2021 fiscal year, investments in Building Essential Skills decreased by 25 percentage points. The largest increases in funding are noted for Training-on-the-Job (+15 percentage points) and the Strategic Workforce Initiatives program (+8 percentage points).
| Employment Benefits and Support Measures | Share of funding (2010 to 2012) |
Share of funding (2020 to 2021) |
Average cost – active claimants (2010 to 2012) |
Average cost – former claimants (2010 to 2012) |
|---|---|---|---|---|
| Building Essential Skills | 51% | 26% | $8,629 | $9,232 |
| Employment Assistance Services | 29% | 35% | $1,579 | $1,579 |
| Strategic Workforce Initiatives | 8% | 0% | n/a | n/a |
| Self-Employment Option | 7% | 10% | $18,778 | $18,419 |
| Training-on-the-Job | 5% | 20% | $6,988 | $6,152 |
| Job Creation Partnerships | n/a | 1% | $2,033 | $571 |
| Research and Innovation | n/a | 8% | n/a | n/a |
| Total | 100% | 100% | n/a | n/a |
- Sources: EI Monitoring and Assessment Reports for fiscal years 2010 to 2011, 2011 to 2012, and 2020 to 2021.
Methodology
This section presents key aspects of the quantitative analyses carried out as part of the LMDA studies.
All quantitative analyses are based on administrative data from the EI Part I (EI claim data) and Part II (EBSM participation data). The EI Part I and II data are then linked to the T1 and T4 taxation files from the Canada Revenue Agency. Incremental impact and cost-benefit analyses are based on 100% of participants in the Northwest Territories who began their EBSM participation in 2009 to 2012.
The 2009 to 2012 timeframe was selected in order to assess the impacts of EBSMs in the years following participation. Impacts were assessed over a period of at least 4 years after program completion up to the 2017 calendar year (most recent available information at the time of this evaluation).
Incremental impacts analysisFootnote 17
Program effectiveness is assessed by estimating incremental impacts from EBSM participation on participants’ labour market experience. That is, earnings from employment and self-employment, incidence of employment, use of EI, use of social assistance SA and dependence on government income supports after participation.
In the Northwest Territories, incremental impacts were estimated for active and former EI claimant participants in Building Essential Skills, Training-on-the-Job and active EI claimant participants in EAS. Incremental impacts for JCP were not produced due to the small samples or due to the fact that the models used to estimate the incremental impacts did not balance. Having balanced models is an essential condition to ensure that participants and non-participants are similar.
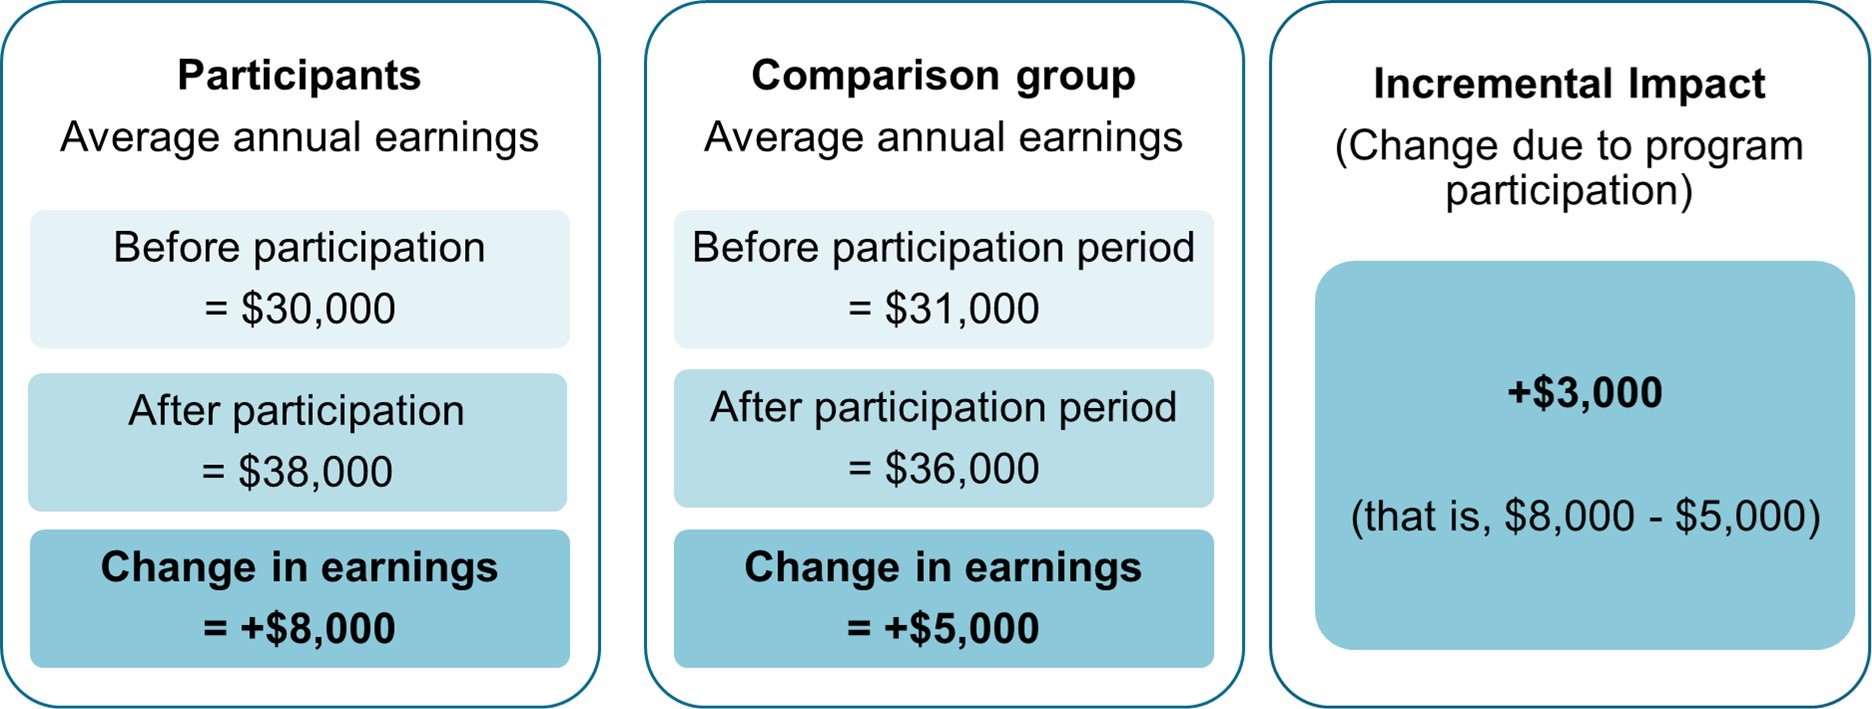
The role of the incremental impact analysis is to isolate the effects of participation from other factors. In order to achieve this, the incremental impact analysis compares the labour market experience of participants before and after their participation with that of similar non-participants. Figure 1 presents an example of incremental impact calculation.
Text description – Figure 1
Incremental impacts are the difference in the pre-post participation outcomes between participants and similar non-participants.
For example:
- if the average annual earnings of participants are $30,000 before participation and $38,000 after participation, the change in earning for participants is an increase of $8,000
- if the average annual earnings in the comparison group are $31,000 before participation and $36,000 after participation, the change in earnings for the comparison group is an increase of $5,000
- the incremental impact, that is the change attributed to program participation, is $8,000 minus $5,000, which equals an increase of $3,000
The main estimator used is propensity score kernel matching technique combined with difference-in-differences estimator. Moreover, 3 different state-of-the-art estimation techniques (Inverse Probability Weighting, Nearest Neighbour and Cross-sectional Matching) were carried out separately for each type of EBSMs and EI claimants in order to validate the impact estimates.
As for previous LMDA evaluation studies, the Action Plan Equivalent is the unit of analysis used. Action Plan Equivalents regroup all EBSMs received by an individual within less than 6 months between the end of 1 EBSM and the start of the next. Action Plan Equivalents are categorized based on the longest EBSM they contain, except for EAS-only Action Plan Equivalents which include only EAS interventions.
The analysis includes Action Plan Equivalents that consist only of LMDA interventions. Action Plan Equivalents that include a combination of LMDA and other labour market programs funded by ESDC, were excluded from the participant sample.
The matching of participants and comparison group members used up to 75 socio-demographic and labour market variables observed over 5 years before participation. Two different comparison groups were used to measure impacts for active and former EI claimants.
For active claimants, incremental impacts were measured relative to a comparison group of active claimants who were eligible to, but did not, participate in EBSMs during the reference period.
For former claimants, the comparison group was created using individuals who participated in EAS only during the reference period.Footnote 18 In other words, the experience of former claimants in Building Essential Skills interventions is compared to the experience of former claimants who received EAS only. This is a conservative approach given the fact that participation in EAS can lead to limited effects on labour market outcomes.
Due to this difference in measurement, incremental impacts estimated for active claimant participants should not be directly compared to those of former claimant participants.
Impacts are generated over 4 years for Building Essential Skills, while a fifth year is estimated for participants in EAS.Footnote 19
Medium-term outcomes analysis
The study reports on the labour market outcomes for active and former EI claimants EAS, and former EI claimant participants in Training-on-the-Job. When the number of participants was sufficient, outcomes were examined for active and former EI claimants who were female, male, youth (30 years old and under), and Indigenous.
The study includes up to 100% of participants who began their EBSM participation between April 1, 2009, and December 31, 2012. The timeframe was selected in order to assess the outcomes of EBSMs in the years following participation.
The analysis of outcomes provides descriptive statistics on the labour market experience of participants before, during and after participation. For example, it shows the average annual earnings of active claimants before, during and after participation, and presents what changes were observed from before to after participation. Overall, the analyses were conducted over a 10 to 11 year period:
- a pre-participation period of 5 years for Building Essential skills, Training-on-the-Job and EAS
- a participation period of 2 years for Building Essential Skills, and of 1 year for Training-on-the-Job and EAS
- a post-participation period of 4 years for Building Essential Skills, Training-on-the-Job and EAS
It is important to note that the labour market outcomes regarding employment earnings, EI and SA benefits are presented in constant 2010 dollars.
Factors accounted for in the cost-benefit analysisFootnote 20,Footnote 21
Building on the results of the incremental impacts, program efficiency is assessed through a cost-benefit analysis. The analysis compares the participants’ cost of participating and the government’s cost of delivering the program to the benefits associated with the program. Overall, this analysis provides insights on the extent to which the program is efficient for society (that is, for both participants and the government).
Sources of data and information
The analysis takes into account all the quantifiable costs and benefits directly related to EBSM delivery and participation that can be measured given the information available. The analysis is comprehensive in that it accounts for the vast majority of possible direct costs and benefits.
However, the analysis does not account for all costs and benefits. For example, there are factors that can lead to an understatement of the benefits (for example, positive spillovers to other family members) and other factors that can lead to an overstatement of the benefits (for example, effects on skill prices or displacement).
This study relied on integrated data from the EI Part I and II Databank and Income Tax records from the Canada Revenue Agency. Information about earnings, use of EI, and use of SA was taken from the study of incremental impacts.Footnote 22 The program costs were calculated using information available in the EI Monitoring and Assessment Reports.
Relative to the previous cycle of evaluation, the methodology has been extended to incorporate one of the indirect health benefits associated with increased labour market attachment. In particular, the methodology includes an estimate of the change in public health care cost due to the decline in health care utilization resulting from program participation.
Data on average public healthcare costs by income quintiles are taken from the report Lifetime Distributional Effects of Publicly Financed Health Care in Canada (2013) by the Canadian Institute for Health Information.
Program costs are measured using information on LMDA expenditures and new interventions reported in the EI Monitoring and Assessment Report. Other costs and benefits are assessed using integrated administrative data from the EI Part I and II databank and the Canada Revenue Agency.
Incremental impacts measured over the second year of participation and up to 5 post-program years are discounted by 3% to bring them to a common base with the program cost and benefits incurred in the program start year. This 3% rate accounts for the interest the government could have collected if the funds used to pay for the program had been invested. Incremental impacts are estimated using 2010 constant dollars and this accounts for inflation.
Costs and benefits accounted for in the calculations
Program cost: cost incurred by the government for delivering the program (that is, administration and direct program costs calculated from data reported in the EI Monitoring and Assessment Reports).
Marginal social cost of public funds: loss incurred by society when raising additional revenues such as taxes to fund government spending. The value is estimated as 20% the program cost, sales taxes, income taxes, impacts on EI and impacts on SA paid or collected by the government.
Foregone earnings: estimated net impacts on participants’ earnings during the participation period. During labour market program participation, some individuals have lower earnings than what they would have received if they had not participated
Employment earnings: incremental impacts on participants’ earnings during and after participation. In-program earnings represent the foregone earnings for participants.
Fringe benefits: the employer-paid health and life insurance as well as pension contributions. They are estimated at 15% of the incremental impacts on earnings.
Federal and provincial income taxes: incremental impacts on federal, provincial and territorial taxes paid by participants.
Sales taxes: the sales taxes paid by participants estimated as incremental impacts on earnings multiplied by the propensity to consume (97%), the proportion of household spending on taxable goods and services (52%) and the total average federal and provincial sales tax rate (11%).
Social assistance and Employment Insurance benefits collected: incremental impacts on SA and EI benefits use by participants following participation.
Canada Pension Plan contribution and Employment Insurance premiums: these contributions and premiums were identified from the Canada Revenue Agency data and then, the incremental impacts on Canada Pension Plan contributions and EI premiums were estimated.
Public health care costs: estimated impact of participation in EBSMs on public health care costs shown as an average change per participant over the post-program period examined.
Strengths and limitations of the studies
One of the key strengths from the studies is that all quantitative analyses are based on administrative data rather than survey responses. Compared to survey data, administrative data are not subject to recall errors or response bias.
The propensity score models used to match participants and non-participants for the incremental impact analyses are judged to be robust. In part this is because they were based on 5 years of pre-participation data. Moreover, these models are based on a vast array of variables including sociodemographic characteristics, location, skill level related to last occupation, and indicators of labour market attachment.
However, the matching process can be further refined for specific subgroups if the following information is available in the future:
- persons with disabilities: the type and severity of the disability, and the capacity/willingness to work full-time
- recent immigrants: the country of origin, the proficiency in English or French, and the relevance of credentials and work experience
- visible minorities: place of birth; individuals who are born outside of Canada face different challenges compared to those born in Canada
Refining the matching process for population subgroups could broaden the scope for greater Gender-based Analysis Plus.
Sensitivity analysis and the use of alternative estimation methods have increased confidence in the incremental impact estimates. However, one limitation with the propensity score matching techniques is that no one can be fully sure the impacts are not influenced by factors not captured in the data.
The cost-benefit analysis accounted for all quantifiable costs and benefits directly attributable to the EBSMs and could be estimated with the available administrative data. It is furthered strengthened by incorporating one of the indirect benefits, which is the change in public health care expenditures associated with program participation. However, the analysis did not account for non-quantifiable factors that can lead to an understatement of the benefits (for example, positive spillovers to other family members) and factors that can lead to an overstatement of the benefits (for example, effects on skill prices or displacement).
In some studies that use qualitative data collection methods, the number of key informants interviewed is relatively small in some the Northwest Territories. Responses provided by key informants reflect their own experience and may not be fully representative of the Northwest Territories.
Overview of the studies summarized in this report
The findings in this report are drawn from 8 separate studies carried out at the territorial level. These studies examine issues related to program effectiveness, efficiency, design/delivery and used a mix of qualitative and quantitative methods. Appendix A presents an overview of these studies. The studies are:
- Examination of the medium-term outcomes from 2009 to 2017
- Estimation of the medium-terms incremental impacts from 2009 to 2017
- Cost-benefit analysis of Employment Benefits and Support Measures in the Northwest Territories
- Cost-benefit analysis: incorporating public health care costs savings in the context of the labour market programs evaluation in the Northwest Territories
- Design and delivery of the Job Creation Partnerships program in the Northwest Territories
- Design and delivery of the Self-Employment Option program in the Northwest Territories
- Design and delivery of the Strategic Workforce Initiatives program in the Northwest Territories
- Design and delivery of the Research and Innovation support measure in the Northwest Territories
Evaluation findings
Main findings
- Overall, where results are statistically significant, incremental impacts demonstrate that Building essential Skills improves labour market attachment and reduces use of governmental income supports
- Medium-term outcomes show that following program participation, former EI claimants in Training-on-the-Job and active and former claimants in EAS:
- had higher earnings
- used EI benefits less, but used SA benefits more
- had a lower incidence of employment, which could partially be explained by participants’ retirement decisions Footnote 23
- With few exceptions, a subgroup analysis of medium-term outcomes shows that female, male, youth, and Indigenous participants in Building Essential Skills and EAS generally:
- had higher earnings
- used EI benefits less, but used SA benefits more
- had a lower incidence of employment, which could partially be explained by participants’ retirement decisions
- The social benefits of participating in Building Essential Skills and EAS exceeded the costs of investment over time
Profile of participants
In the Northwest Territories, nearly 1,670 EI active and former claimants participated in LMDA programs and services between 2009 and 2012.
The profile of participants is presented in Table 2 by gender, age, sociodemographic group, and marital status. Information about their educational attainment, occupation and industry is based on the last job they held prior to applying for EI benefits. Information about sociodemographic groups is self-reported.
| Categories | Active claimants | Former claimants |
|---|---|---|
| Number of participants | 711 | 954 |
| Gender: Female | 38% | 37% |
| Gender: Male | 62% | 63% |
| Age: 30 and under | 37% | 42% |
| Age: 31 to 54 | 56% | 54% |
| Age: 55 and over | 7% | 5% |
| Sociodemographic groups: Indigenous people | 59% | 75% |
| Sociodemographic groups: Persons with disabilities | 2% | 3% |
| Sociodemographic groups: Visible minorities | 12% | 12% |
| Sociodemographic groups: Recent immigrants | 2% | 0% |
| Marital status: Single | 47% | 59% |
| Marital status: Married or common-law | 43% | 31% |
| Marital status: Widow / divorced / separated | 7% | 7% |
| Education or skills level: High school or occupational training | 34% | 29% |
| Education or skills level: On-the-job training | 26% | 31% |
| Education or skills level: College, vocational education or apprenticeship training | 32% | 32% |
| Education or skills level: University degree | 4% | 4% |
- Note: Values may not equal 100% due to rounding or missing information.
Top 3 occupational groups for EBSM participants
Active claimants:
- other manual workers = 17%
- semi-skilled manual workers = 17%
- skilled crafts and trades = 15%
Former claimants:
- other manual workers =20%
- skilled crafts and trades = 17%
- semi-skilled manual workers = 14%
Top 3 industries for EBSM participantsFootnote 24
Active claimants:
- construction = 21%
- public administration = 17%
- mining, quarrying, and oil and gas extraction; and retail trade = 7% each
Former claimants:
- construction = 24%
- public administration = 19%
- accommodation and food services = 9%
As presented in Table 3, in the year before program participation, former claimants have lower levels of employment and earnings than active claimants. A greater percentage of former claimant participants used SA benefits.
| Pre-EBSM participation employment characteristics | Active claimants | Former claimants |
|---|---|---|
| Average employment earnings | $31,466 | $20,953 |
| Percentage employed | 99% | 89% |
| Percentage on social assistance | 11% | 20% |
Incremental impacts for active and former EI claimant participants in Building Essential Skills and active claimant participants in EAS
The incremental impact results presented below are generally consistent with those found as part of the second LMDA evaluation cycle.
Incidence of employment
Chart 1 presents the incremental impacts on the incidence of employment for active and former claimants by type of program.Footnote 25 The estimates can be interpreted as a change in the probability of being employed following participation.
Former EI claimant participants in Building Essential Skills increase their incidence of employment relative to similar non-participants.
- *The impact is not statistically significant over the entire post-participation period.
- Note: Impacts are estimated over 4 post-program years (or 5 years in the case of EAS).
Text description – Chart 1
| Program name | Incidence of employment for active claimants (percentage points) |
Incidence of employment for former claimants (percentage points) |
|---|---|---|
| Building Essential Skills | 3.4* | 7 |
| Employment Assistance Services | -5.2* | n/a |
- *The impact is not statistically significant over the entire post-participation period.
- Note: Impacts are estimated over 4 post-program years (or 5 years in the case of EAS).
Employment earnings
Chart 2 presents the average annual change in employment earnings for active and former EI claimants over the 4 years post-participation.
Active and former EI claimants in Building Essential Skills increase their employment earnings compared to similar non-participants.

- *The impact is not statistically significant over the entire post-participation period.
- Note: Impacts are estimated over 4 post-program years (or 5 years in the case of EAS).
Text description – Chart 2
| Program name | Employment earnings for active claimants | Employment earnings for former claimants |
|---|---|---|
| Building Essential Skills | $5,870 | $8,125 |
| Employment Assistance Services | $1,148* | n/a |
- *The impact is not statistically significant over the entire post-participation period.
- Note: Impacts are estimated over 4 post-program years (or 5 years in the case of EAS).
Use of EI benefits
The results presented in Chart 3 are not statistically significant over the entire post-program period. However, active claimants who received EAS had statistically significant decreases in their use of EI benefits of $1,269 and $863 in years 1 and 2 post-program.

- *The impact is not statistically significant over the entire post-participation period.
- 1The impact is not statistically significant. However, participants decreased the use of EI by $1,269 and $863 in years 1 and 2 post-program participation respectively.
- Note: Impacts are estimated over 4 post-program years (or 5 years in the case of EAS).
Text description – Chart 3
| Program name | Use of EI benefits for active claimants | Use of EI benefits for former claimants |
|---|---|---|
| Building Essential Skills | -$665* | -$32* |
| Employment Assistance Services | -$3451 | n/a |
- *The impact is not statistically significant over the entire post-participation period.
- 1The impact is not statistically significant. However, participants decreased the use of EI by $1,269 and $863 in years 1 and 2 post-program participation respectively.
- Note: Impacts are estimated over 4 post-program years (or 5 years in the case of EAS).
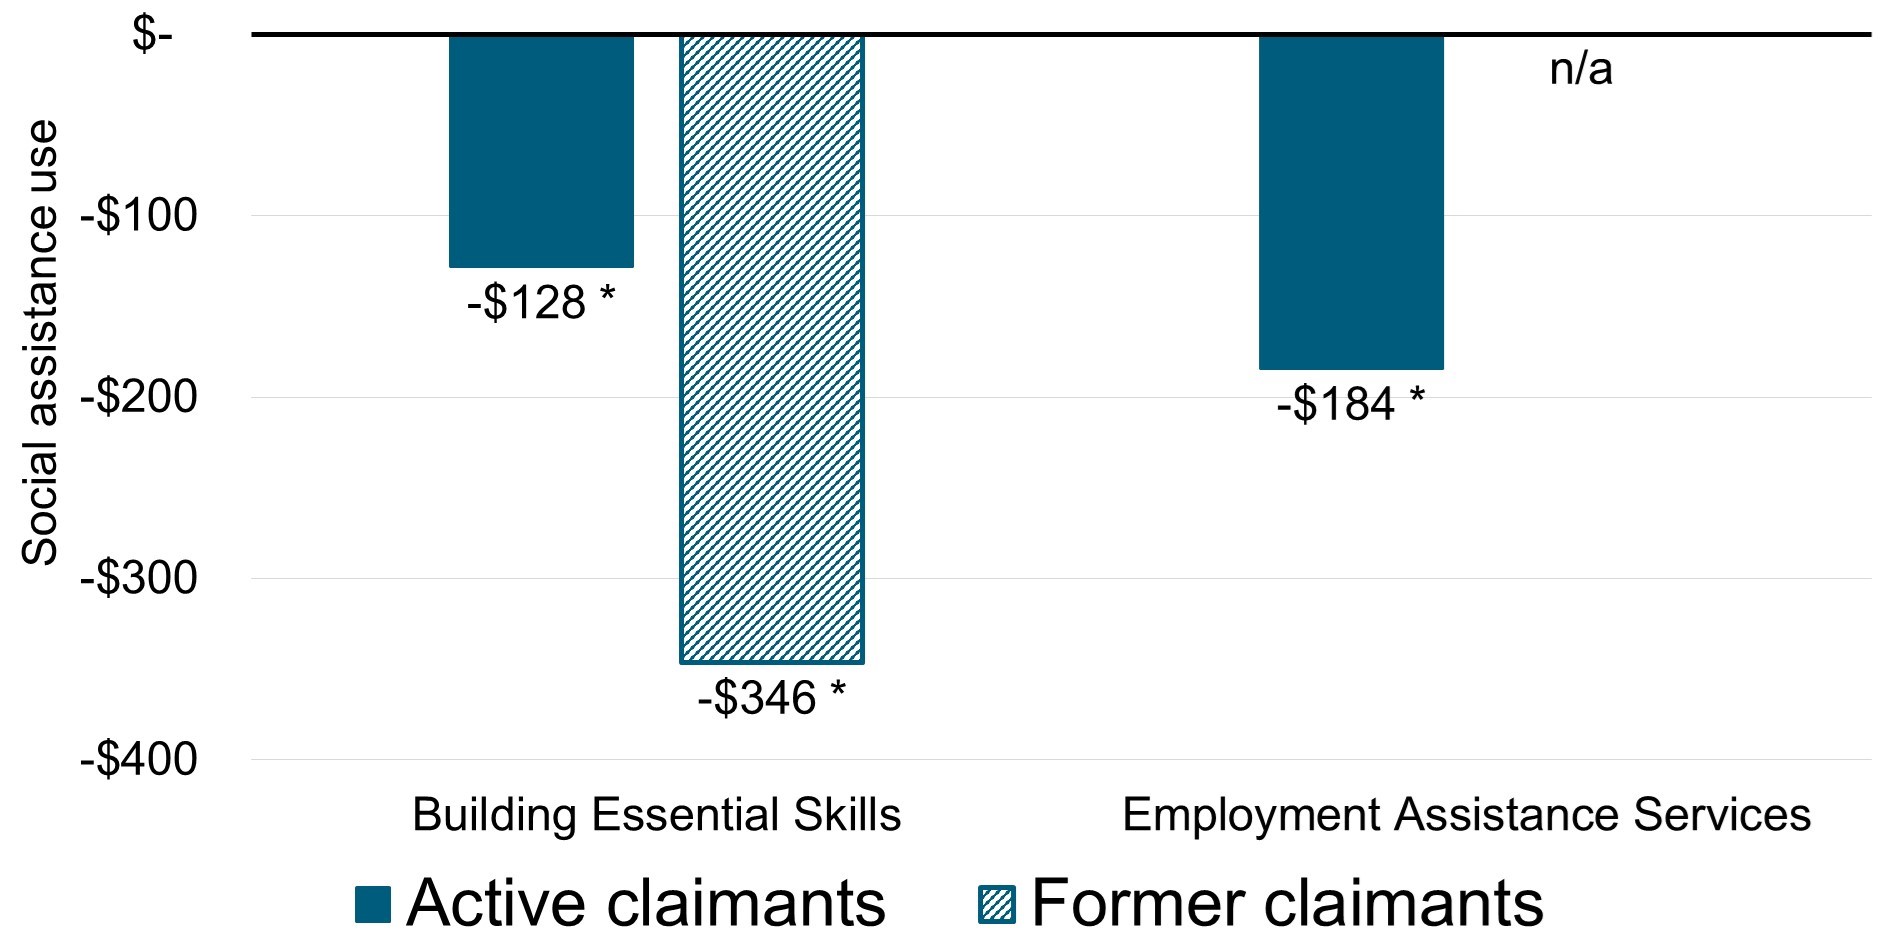
Use of SA benefits
The results presented in Chart 4 are not statistically significant.
- *The impact is not statistically significant over the entire post-participation period.
- Note: Impacts are estimated over 4 post-program years (or 5 years in the case of EAS).
Text description – Chart 4
| Program name | Use of SA benefits for active claimants ($) | Use of SA benefits for former claimants ($) |
|---|---|---|
| Building Essential Skills | -$128* | $346* |
| Employment Assistance Services | $184* | n/a |
- *The impact is not statistically significant over the entire post-participation period.
- Note: Impacts are estimated over 4 post-program years (or 5 years in the case of EAS).
Use of government income support
As shown in Chart 5, active EI claimants in Building Essential Skills reduced their use of government income supports compared to similar non-participants.

- *The impact is not statistically significant over the entire post-participation period.
- Note: Impacts are estimated over 4 post-program years (or 5 years in the case of EAS).
Text description – Chart 5
| Program name | Use of government income support for active claimants (percentage points) |
Use of government income support for former claimants (percentage points) |
|---|---|---|
| Building Essential Skills | -4.1 | -2.8* |
| Employment Assistance Services | -2.6* | n/a |
- *The impact is not statistically significant over the entire post-participation period.
- Note: Impacts are estimated over 4 post-program years (or 5 years in the case of EAS).
Outcomes for former EI claimant participants in Training-on-the-Job and active and former EI claimant participants in EAS Footnote 26
Incremental impacts for Training-on-the-Job were not produced due to low participant numbers or because the models used to estimate the incremental impacts not balancing. Having balanced models is an essential condition to ensure that participants and non-participants are similar. However, medium-term outcomes were estimated for active and former EI claimant participants in Training-on-the-Job and EAS. The outcomes describe the changes in participants’ earnings, use of EI and SA benefits, and incidence of employment that occur from before to after program participation.
The labour market outcomes are based on individuals who began their participation during the 2009 to 2012 period. Statistics focus on 5 years before and 4 years after program participation.
Between 2009 and 2012:
- 78 former EI claimants participated in Training-on-the-Job
- 286 active EI claimants and 513 former EI claimants received EAS
The outcomes for former claimants who received Training-on-the-Job should be interpreted with caution given the small number of participants (n=78).
Employment earnings
As shown in Chart 6, active and former EI claimants who participated in EAS and former claimants who participated in Training-on-the-Job had higher annual employment earnings during the post-participation period when compared to the 5 years before participation. For example, the average annual earnings of former EI claimants who participated in Training-on-the-Job were $9,826 higher in the post-participation period.

- Note: The outcomes for former claimants who participated in TOJ should be interpreted with caution given the small number of participants (n=78).
Text description – Chart 6
| Program name | Employment earnings for active claimants | Employment earnings for former claimants |
|---|---|---|
| Training-on-the-Job | n/a | $9,826 |
| Employment Assistance Services | $4,717 | $6,201 |
- Note: The outcomes for former claimants who participated in TOJ should be interpreted with caution given the small number of participants (n=78).
Use of EI and SA benefits
As shown in Chart 7, compared to the 5 years before participation, the average proportion of participants who used EI benefits is lower in the post-participation period, while use of SA benefits is higher. For example, former claimants who participated in Training-on-the-Job decreased their use of EI benefits by 6 percentage points but increased the use of SA benefits by 7 percentage points post-participation.


Text description – Chart 7
| Program name | Proportion of active claimant participants who received EI benefits (percentage points) |
Proportion of former claimants- participants who received EI benefits (percentage points) |
|---|---|---|
| Training-on-the-Job | n/a | -6 |
| Employment Assistance Services | -5 | -18 |
| Program name | Proportion of active claimant participants who received SA benefits (percentage points) |
Proportion of former claimant participants who received SA benefits (percentage points) |
|---|---|---|
| Training-on-the-Job | n/a | 7 |
| Employment Assistance Services | 2 | 7 |
Incidence of employment
As shown in Chart 8, participants’ incidence of employment was lower in the post-participation period. The lower incidence of employment can be attributed, in part, to participants’ retirement decisions. For example, while the incidence of employment of employed former claimant participants in Training-on-the-Job decreased by 4 percentage points, the percentage of participants receiving Canada Pension Plan and Old Age security benefits increased by 3 and 1 percentage points, respectively.
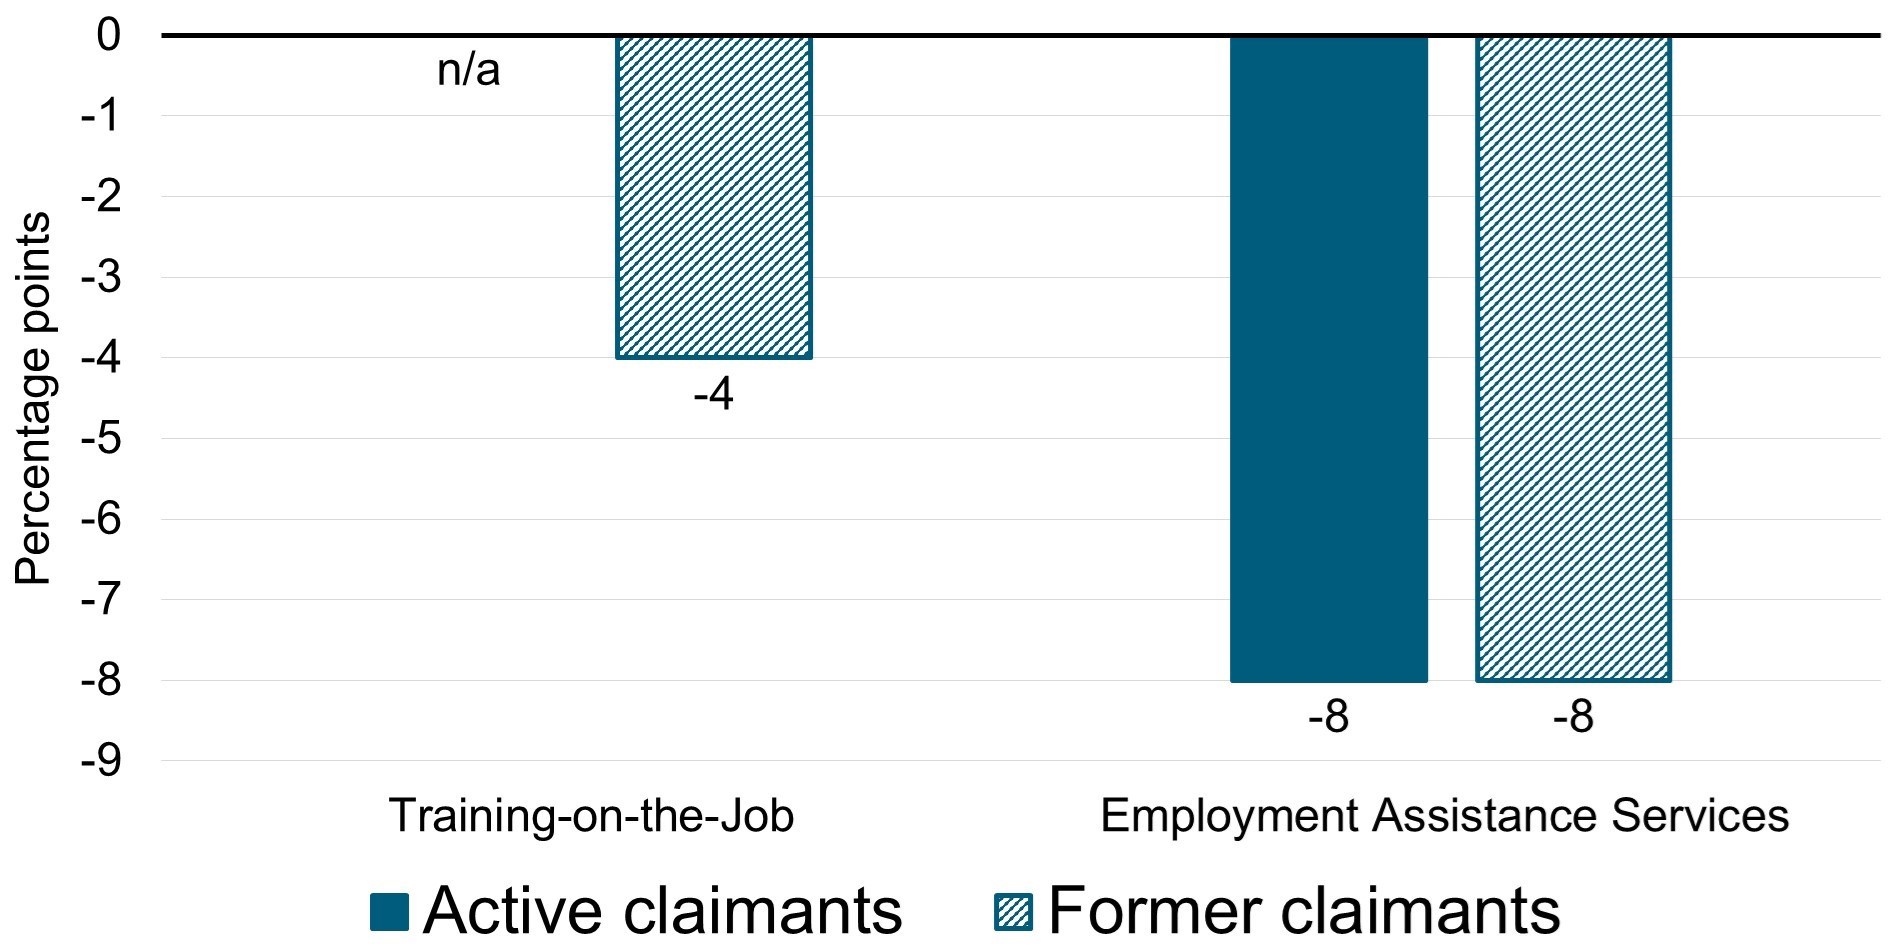
Text description – Chart 8
| Program name | Change in incidences of employment for active claimants (percentage points) |
Change in incidences of employment for former claimants (percentage points) |
|---|---|---|
| Training-on-the-Job | n/a | -4 |
| Employment Assistance Services | -8 | -8 |
Population subgroup profiles and labour market outcomes
Female participants
Main findings
Following program participation, female active and former EI claimant participants in Building Essential Skills, and EAS:
- had higher average annual earnings
- used EI benefits less, but used SA benefits more
- had a lower incidence of employment, which can be partially attributed to participants’ retirement decisions
Between 2009 and 2012, nearly 625 of the participants in Canada-Northwest Territories LMDA-funded programs and services were female, representing nearly 37% of participants.
The profile of female participants is presented in Table 4. It includes their age, sociodemographic group, marital status, educational attainment, occupation and industry. Information about their educational attainment, occupation and industry is based on the last job they held prior to applying for EI benefits. Information about sociodemographic groups is self-reported.
| Categories | Active claimants | Former claimants |
|---|---|---|
| Number of participants | 273 | 350 |
| Age: 30 and under | 31% | 36% |
| Age: 31 to 54 | 60% | 59% |
| Age: 55 and over | 10% | 5% |
| Sociodemographic group: Indigenous people | 52% | 78% |
| Sociodemographic group: Persons with disabilities | <10* | 4% |
| Sociodemographic group: Visible minorities | 4% | <10* |
| Sociodemographic group: Recent immigrants | <10* | 0% |
| Marital status: Single | 42% | 56% |
| Marital status: Married or common-law | 46% | 32% |
| Marital status: Widow / divorced / separated | 9% | 9% |
| Education or skills level: High school or occupational training | 39% | 39% |
| Education or skills level: On-the-job training | 18% | 21% |
| Education or skills level: College, vocational education or apprenticeship training | 28% | 27% |
| Education or skills level: University degree | 8% | 8% |
- Note: Values may not equal 100% due to rounding or missing information.
- *Fewer than 10 participants.
Top 3 occupational groups for female participantsFootnote 27
Active claimants:
- clerical personnel = 23%
- other sales and service professionals; and other manual workers = 14% each
- intermediate sales and service personnel = 13%
Former claimants:
- clerical personnel; and intermediate sales and service personnel = 17% each
- other sales and service personnel = 16%
- administrative and senior clerical personnel = 9%
Top 3 industries for female participants
Active claimants:
- public administration = 21%
- accommodation and food services = 10%
- construction = 8%
Former claimants:
- public administration = 27%
- accommodation and food services = 18%
- retail trade = 8%
Table 5 presents detailed outcomes for female participants. For example, the results reveal that:
- on average, female active EI claimants who participated in Building Essential Skills:
- earned $2,509 more per year in the post-participation period than they did in the pre-participation period
- decreased their use of EI benefits by 13 percentage points, but increase their use of SA benefits by 6 percentage points
- experienced a decline of 12 percentage points in their incident of employment
- on average, female former claimants who participated in EAS:
- earned $839 more per year in the post-participation period than they did in the pre-participation period
- decreased their use of EI benefits by 21 percentage points, but increase their use of SA benefits by 10 percentage points
- experienced a decline of 15 percentage points in their incidence of employment
| Indicator | Building Essential Skills active claimants | Building Essential Skills former claimants | Employment Assistance Services active claimants | Employment Assistance Services former claimants |
|---|---|---|---|---|
| Employment earnings ($) | 2,509 | 11,088 | 670 | 839 |
| Use of EI benefits (percentage points) |
-13 | -15 | -9 | -21 |
| Use of SA benefits (percentage points) |
+6 | +2 | +3 | +10 |
| Incidence of employment (percentage points) |
-12 | -5 | -11 | -15 |
| n= | 135 | 102 | 89* | 159 |
- *Results for active claimant participants in EAS should be interpreted with caution given the low number of participants (n=89).
Male participants
Main findings
Following program participation, male active and former EI claimant participants in Building Essential Skills, and EAS:
- had higher average annual earnings
- used EI benefits less
- with the exception of active claimants who received EAS, used SA benefits more
- had a lower incidence of employment, which can be partially attributed to participants’ retirement decisions
Nearly 1,050 EI active and former claimant participants in LMDA programs and services between 2009 and 2012 in the Northwest Territories are male, representing nearly 63% of participants.
The profile of male participants is presented in Table 6 by age, sociodemographic group marital status, educational attainment, occupation and industry. Information about their educational attainment, occupation and industry is based on the latest job they held prior to applying for EI benefits. Information about sociodemographic groups is self-reported.
| Categories | Active claimants | Former claimants |
|---|---|---|
| Number of participants | 438 | 604 |
| Age: 30 and under | 42% | 45% |
| Age: 31 to 54 | 53% | 51% |
| Age: 55 and over | 5% | 5% |
| Sociodemographic group: Indigenous people | 64% | 74% |
| Sociodemographic group: Persons with disabilities | <10* | 3% |
| Sociodemographic group: Visible minorities | 2% | <10* |
| Sociodemographic group: Recent immigrants | <10* | <10* |
| Marital status: Single | 50% | 60% |
| Marital status: Married or common-law | 41% | 30% |
| Marital status: Widow / divorced / separated | 6% | 6% |
| Education or skills level: High school or occupational training | 31% | 24% |
| Education or skills level: On-the-job training | 31% | 36% |
| Education or skills level: College, vocational education or apprenticeship training | 34% | 35% |
| Education or skills level: University degree | <10* | 2% |
- Note: Values may not equal 100% due to rounding or missing information.
- *Fewer than 10 participants.
Top 3 occupational groups for male participants
Active claimants:
- semi-skilled manual workers = 26%
- other manual workers = 25%
- skilled crafts and trades = 22%
Former claimants:
- other manual workers = 29%
- skilled crafts and trades = 25%
- semi-skilled manual workers = 19%
Top 3 industries for male participants
Active claimants:
- construction = 29%
- public administration = 14%
- mining, quarrying and oil and gas extraction = 9%
Former claimants:
- construction = 34%
- public administration = 14%
- mining, quarrying and oil and gas extraction = 8%
Table 7 presents detailed outcomes for male participants. For example, the results reveal that:
- on average, male former EI claimants who participated in Building Essential Skills:
- earned $21,856 more per year in the post-participation period than they did in the pre-participation period
- decreased their use of EI benefits by 20 percentage points, but increase their use of SA benefits by 3 percentage points
- experienced a decline of 4 percentage points in their incident of employment
- on average, male active claimants who participated in EAS:
- earned $3,711 more per year in the post-participation period than they did in the pre-participation period
- decreased their use of EI and SA benefits by 8 and 1 percentage points, respectively
- experienced a decline of 7 percentage points in their incident of employment
| Indicator | Building Essential Skills active claimants |
Building Essential Skills former claimants |
Employment Assistance Services active claimants |
Employment Assistance Services former claimants |
|---|---|---|---|---|
| Employment earnings ($) | 19,794 | 21,856 | 3,711 | 9,829 |
| Use of EI benefits (percentage points) | -7 | -20 | -8 | -16 |
| Use of SA benefits (percentage points) | +2 | +3 | -1 | +5 |
| Incidence of employment (percentage points) |
-3 | -4 | -7 | -5 |
| n= | 260 | 261 | 100 | 211 |
Youth participants
Main findings
Following program participation, active and former EI claimant youth who participated in Building Essential Skills and EAS:
- had higher average annual earnings
- with the exception of active claimants who received EAS, used EI benefits less, but used SA benefits more
- had a lower incidence of employment
Nearly 675 EI active and former claimant participants between 2009 and 2012 were 30 years of age or younger when they began their program, representing nearly 40% of participants.
The profile of youth participants is presented in Table 8 by gender, sociodemographic group, marital status, educational attainment, occupation and industry. Information about their educational attainment, occupation and industry are based on the latest job they held prior to applying for EI benefits. Information about sociodemographic groups is self-reported.
| Categories | Active claimants | Former claimants |
|---|---|---|
| Number of participants | 266 | 396 |
| Gender: Female | 32% | 32% |
| Gender: Male | 68% | 68% |
| Sociodemographic group: Indigenous people | 61% | 72% |
| Sociodemographic group: Persons with disabilities | <10* | <10* |
| Sociodemographic group: Visible minorities | <10* | <10* |
| Sociodemographic group: Recent immigrants | <10* | 0% |
| Marital status: Single | 59% | 67% |
| Marital status: Married or common-law | 34% | 25% |
| Marital status: Widow / divorced / separated | 4% | 5% |
| Education or skills level: High school or occupational training | 27% | 26% |
| Education or skills level: On-the-job training | 29% | 36% |
| Education or skills level: College, vocational education or apprenticeship training | 35% | 31% |
| Education or skills level: University degree | 4% | 5% |
- Note: Values may not equal 100% due to rounding or missing information.
- *Fewer than 10 participants.
Top 3 occupational groups for older worker participantsFootnote 28
Active claimants:
- skilled crafts and trades = 21%
- other manual workers = 20%
- semi-skilled manual workers = 16%
Former claimants:
- other manual workers = 26%
- skilled crafts and trades = 23%
- clerical personnel; semi-skilled manual workers; and other sales and service personnel = 10% each
Top 3 industries for older workers participants
Active claimants:
- construction = 23%
- public administration = 13%
- mining, quarrying, and oil and gas extraction = 10%
Former claimants:
- construction = 28%
- public administration = 15%
- retail trade = 9%
Table 9 presents detailed outcomes for youth participants. For example, the results reveal that:
- on average, active EI claimant youth who participated in Building Essential Skills:
- earned $22,109 more per year in the post-participation period
- decreased their use of EI benefits by 1 percentage point, but increase their use of SA benefits by 2 percentage points
- experienced a decline of 5 percentage points in their incident of employment
- on average, former claimant youth who participated in EAS:
- earned $10,334 more per year in the post-participation period
- decreased their use of EI benefits by 7 percentage points, but increase their use of SA by 6 percentage points
- experienced a decline of 6 percentage points in their incidence of employment
| Indicator | Building Essential Skills active claimants |
Building Essential Skills former claimants |
Employment Assistance Services active claimantsFootnote 29 |
Employment Assistance Services former claimants |
|---|---|---|---|---|
| Employment earnings ($) | 22,109 | 29,093 | 9,868 | 10,344 |
| Use of EI benefits (percentage points) | -1 | -14 | +6 | -7 |
| Use of SA benefits (percentage points) | +2 | 0 | -4 | +6 |
| Incidence of employment (percentage points) |
-5 | -2 | -6 | -6 |
| n= | 161 | 184 | 56 | 129 |
- Note: Values may not equal 100% due to rounding or missing information.
Indigenous participants
Main findings
Following program participation, Indigenous active and former EI claimant participants in Building Essential Skills, and EAS:
- had higher average annual earnings
- used EI benefits less
- with the exception of active claimants who received EAS, used SA benefits more
- had a lower incidence of employment, which can be partially attributed to participants’ retirement decisions
Nearly 1,150 active and former claimant participants, between 2009 and 2012, self-identify as being Indigenous Canadians, representing about 69% of participants.
The profile of Indigenous participants is presented in Table 10 by gender, age marital status, educational attainment, occupation and industry. Information about educational attainment, occupation and industry are based on the latest job held prior to applying for EI benefits.
| Categories | Active claimants | Former claimants |
|---|---|---|
| Number of participants | 423 | 719 |
| Gender: Female | 34% | 38% |
| Gender: Male | 66% | 62% |
| Age: 30 and under | 39% | 39% |
| Age: 31 to 54 | 55% | 56% |
| Age: 55 and over | 7% | 4% |
| Marital status: Single | 53% | 61% |
| Marital status: Married or common-law | 39% | 29% |
| Marital status: Widow / divorced / separated | 7% | 7% |
| Education or skills level: High school or occupational training | 37% | 30% |
| Education or skills level: On-the-job training | 32% | 35% |
| Education or skills level: College, vocational education or apprenticeship training | 25% | 27% |
| Education or skills level: University degree | 3% | 5% |
- Note: Values may not equal 100% due to rounding or missing information.
Top 3 occupational groups for male participants
Active claimants:
- Other manual workers = 23%
- Semi-skilled manual workers = 22%
- Skilled crafts and trades = 11%
Former claimants:
- other manual workers = 24%
- semi-skilled manual workers = 16%
- other sales and service personnel = 12%
Top 3 industries for male participantsFootnote 30
Active claimants:
- construction = 26%
- public administration = 21%
- mining, quarrying, and oil and gas extraction = 9%
Former claimants:
- construction; and public administration = 22% each
- accommodation and food services; and mining, quarrying, and oil and gas extraction = 9% each
- retail trade; and transportation and warehousing = 5% each
Table 11 presents detailed outcomes for Indigenous participants. For example, the results reveal that:
- on average, Indigenous former EI claimants who participated in Building Essential Skills:
- earned $14,180 more per year in the post-participation period than they did in the pre-participation period
- decreased their use of EI benefits by 17 percentage points, but increase their use of SA by 3 percentage points
- experienced a decline of 4 percentage points in their incident of employment
- on average, Indigenous active claimants who participated in EAS:
- earned $3,522 more per year in the post-participation period than they did in the pre-participation period
- decreased their use of EI and SA benefits 9 and 1 percentage points, respectively
- experienced a decline of 8 percentage points in their incidence of employment
| Indicator | Building Essential Skills active claimants |
Building Essential Skills former claimants |
Employment Assistance Services active claimants |
Employment Assistance Services former claimants |
|---|---|---|---|---|
| Employment earnings ($) | 13,311 | 14,180 | 3,522 | 6,040 |
| Use of EI benefits (percentage points) | -10 | -17 | -9 | -18 |
| Use of SA benefits (percentage points) | +4 | +3 | -1 | +7 |
| Incidence of employment (percentage points) |
-6 | -4 | -8 | -9 |
| n= | 241 | 273 | 108 | 273 |
Cost-benefit analysis
This analysis is based on the EBSM medium-term incremental impacts previously described in this report. Costs and benefits are examined over the participation period of 1 or 2 years and 5 or 10 years after the end of participation.Footnote 31
The cost-benefit analysis addresses the following questions:
- Are the benefits from EBSMs exceeding the costs within 5 years (for EAS), 10 years (for Building Essential Skills) after the end of participation?
- How much is the benefit for the government and society if the government spends $1 in EI part II funding?
- How many years does it take the benefits to recover the costs?
Table 12 presents the cost-benefit results for active and former EI claimant participants.
Results are presented from the social perspective, that is, the government and individual combined. This allows for a sound assessment of program effectiveness in achieving its objectives of helping unemployed individuals to obtain and maintain employment and to generate EI savings.
| Indicator | Building Essential Skills active claimants (10 years post-program) | Building Essential Skills former claimants (10 years post-program) | Employment Assistance Services active claimants (5 years post-program) |
|---|---|---|---|
| Net present value | $54,080 | $82,730 | $5,496 |
| Benefit cost ratio | $7.27 | $9.96 | $4.48 |
| Payback period (years after end of participation) | 1.3 | 1.6 | <11 |
| Social return | 627% | 896% | 348% |
| Savings to public health care | $485 | $492 | $90 |
- 1 Paid back within the program start year.
The information below provides examples of the net present value, the benefit-cost ratio, the payback period, the social rate of return and savings to health care costs.
Building Essential SkillsFootnote 32
During the 2009 to 2012 period, Building Essential Skills represented almost 51% of EBSM expenditures under the LMDAs in the Northwest Territories. The average duration of a Building Essential Skills Action Plan Equivalent is 33 weeks for active claimants and 34 weeks for former claimants.
Table 12 presents the cost-benefit analysis results for active and former EI claimant participants in BES. For example, over the 10 year post-program period, the benefit for active claimants is $54,080 higher than the costs, yielding a social return of 627% on investment. This means that if the government spends $1 on Building Essential Skills for active EI claimants, it generates a benefit of $7.27 for society. It takes 1.3 years for the benefits to recover the costs of programming. Overall, there are savings in health care costs of $485 per participant.
The benefit for former claimants is $82,730 higher than the costs, yielding a social return of 896% on investment. This means that if the government spends $1 on Building Essential Skills for active EI claimants, it generates a benefit of $9.96 for society. It takes 1.6 years for the benefits to recover the costs of programming. Overall, there are savings in health care costs of $492 per participant.
Employment Assistance ServicesFootnote 33
EAS includes a variety of services such as computer access for job search services, group sessions to prepare for an interview, career counselling, and action plan development. The administrative data, however, do not allow to identify what proportion of EAS interventions belong to each category or the intensity of services offered to participants.
While EAS is often provided with other EBSMs, this analysis examined only participants who received 1 or more EAS services without participating in other EBSMs. EAS represented about 29% of total EBSM expenditures in the Northwest Territories between 2009 and 2012. The average length of an EAS-only Action Plan Equivalent is 17 weeks compared to between 33 or 51 weeks for active EI claimant participants in other EBSMs.
As shown in Table 12, over the 5 year post-participation period the benefit for active claimants in EAS is $5,496 higher than the costs, yielding a social return on investment of 348%. This means that if the government spends $1 on EAS for active EI claimants, it generates a benefit of $4.48 for society. The benefits recover the costs of programming within the program start year. Overall, there are savings in health care costs of $90 per participant.
Supplemental studies
Self-Employment OptionFootnote 34
Program design and delivery
The Self-Employment Option program aims to assist participants in creating employment for themselves by providing them with a range of services including:
- providing feedback on participants’ business plan
- counselling, coaching and mentoring
- entrepreneurial training and workshops
In addition to being EI-eligible, participants must have a viable business idea, demonstrate that they are a personally suited to self-employment, and have financial resources and other supports.
The Northwest Territories has the flexibility to design and deliver the program to meet its labour market needs. In fall 2018, the Self-Employment Option program was delivered by third-party service providers who were contracted to assist participants in developing their ideas and creating business and financial plans.
Program officials reported that the amount allocated to the Self-Employment Option program is influenced by demand for the program. In the 6 fiscal yearsFootnote 35 between 2013 and 2019, the Northwest Territories allocated between 3.2% and 4.9% of its LMDA funding to the Self-Employment Option program. While spending on self-employment programs tended to decrease in Canada during this period, it remained stable in the Northwest Territories.
Participants’ employment outcomesFootnote 36
According to key informants, the Self-Employment Option program is expected to improve participants’ incidence of employment, ability to hire staff, and self-sufficiency.
An analysis of EI and income tax data from the Canada Revenue Agency revealed that active EI claimant participants decreased their use of EI benefits after participating in the Self-Employment Option program.
Key informants identified several factors that enable participants to succeed at starting and maintaining their businesses:
- having skills and experience related to the business
- having a good business idea and product
- having supports in place, such as those provided through the program, industry connections and a supportive personal network
- being committed, motivated and suited to self-employment
Key informants identified several factors that contribute to participants’ inability to start or maintain their business. These included:
- insufficient preparation and understanding of what is required to successfully launch and maintain a business, such as:
- realistic revenue projections
- sound financial planning
- sound market research
- strong project management skills
- adequate marketing
- economic downturns or changes in participants’ life circumstances
- insufficient dedication and commitment
Challenges and lessons learned related to program design and delivery
Key informants identified challenges related to program design and delivery, including:
- communication between territorial program officials and third-party service providers
- finding experienced third-party service providers
- marketing the program in small and remote communities
- lack of alignment between program eligibility criteria (EI eligibility) and the pool of potential participants
Key informants identified several lessons learned related to program design and delivery. Good practices included:
- employing third-party service providers with expertise in business development to deliver the program
- selecting third-party service providers who are able to assist participants to obtain small loans
- conducting in-depth eligibility and suitability assessments to identify promising candidates for program participation
- tailoring interventions to the needs of participants
Job Creation Partnerships (JCP)Footnote 37
Program objective
The JCP program aims to:
- create jobs and grow the territorial workforce in partnership with community organizations
- provide participants with the opportunity to develop their skills and gain work experience or training that improves their employment prospects
- provide opportunities for employer involvement in training to ensure that skills are better aligned to job opportunities
JCP is delivered through the provisions of funds to third parties. Funded organizations work with at least 2 community partners to implement projects that provide valuable work experience to participants while responding to local labour market needs.
Participants receive benefits from EI Part I or II.Footnote 38 Depending on the type of project, participants may receive a wage subsidy or living allowance while participating in the program.
Program delivery
The Northwest Territories implements JCP through the provision of funds to organizations that implement a project while providing work experience and developing the skills of participants.
The design and delivery of JCP allows the Northwest Territories to address a variety of barriers to employment and to address territorial labour market needs. For example, JCP has been used to support the labour market needs of specific sectors and industries, and to support communities after the loss of a major employer.
The annual budget for JCP is influenced by regional needs, demand for the program by organizations, as well as the historical and projected use of the program.
In addition to participants gaining work experience, key informants identified a variety of other program benefits. These included:
- improved participant well-being, community standing, and employability
- increased intersectoral partnerships and collaboration
- improved ability to meet employers’ workforce needs
Challenges and lessons learned
Key informants identified challenges related to:
- recruiting organizations to undertake and implement funded projects and employers to host work placements
- the administrative burden of project proposal development and project implementation
- the capacity of sponsors to complete reporting requirements
- the clarity and appositeness expense eligibility criteria
Key informants identified several factors that are associated with program and participant success. These included:
- beneficial design features, including the work experience component, the flexibility to serve Workforce Development Agreement clients, and the supportive learning environment
- strong, collaborative and committed partnerships between career development officers, funded organizations and project partners
- active involvement of career development officers in improving community awareness about the program, recruiting organizations to implement projects, and employers to host work placements
- supporting funded organizations with participant and project monitoring, and making on-site visits
Key informant also noted that JCP is best suited to participants who are further from the labour market and motivated to participate.
Key considerations for JCP program and policy development
The following considerations emerged as part of the JCP study.
Key consideration #1
The Northwest Territories may wish to seek opportunities to improve partnerships and leverage the projects/activities undertaken by Indigenous organizations that are Skills and Partnership Fund (SPF) agreement holders
The project implemented by the Mine Training Society seems to have multiple similarities with its SPF project.
Key consideration #2
The Northwest Territories may wish to share lessons learned and best practices regarding the design and delivery of JCP with officials from the Government of Manitoba and the Government of Alberta.
The Northwest Territories faces similar challenges as northern Manitoba regarding the low capacity of non-profit organizations and training providers. Both Manitoba and Alberta also provide training with work experience through JCP.
Key consideration #3
The Northwest Territories may wish to develop detailed program guidelines outlining eligible expenses.
Sponsors find the project guidelines difficult to understand and career development officers find that eligible expenses are not clearly defined.
Strategic Workforce InitiativesFootnote 39
The Strategic Workforce Initiatives program aims to support community partners in undertaking labour market activities that promote labour force development, and support workforce adjustments and effective human resources planning. It includes a wide range of funded activities, such as:
- labour market research
- development of strategic plans to address community economic and employment issues
- promotion of employment supports to employers and unemployed individuals
- communications to share best practices or to initiate discussions regarding community challenges and opportunities
- coordination to facilitate community problem solving related to labour market/employment challenges; and to support the development of local planning groups
- coordination of workforce adjustment to help businesses set up support mechanisms to assist employees who are at risk of losing their jobs
The Strategic Workforce Initiatives program is one type of support measures delivered under the LMDAs. In 2019 to 2020, the Northwest Territories spent nearly $75,000 or nearly 2% of total expenditure under the Canada-Northwest Territories Labour Market Development Agreement.
Funded organizations
Funded organizations include local and Indigenous governments and non-profit organizations.
Targeted labour market issues
Funded projects targeted labour market issues associated with:
- employee attraction and retention challenges for employers and communities
- limited employment opportunities in small communities
- skills development challenges (such as lack of programming for youth)
All projects reviewed aligned with program objectives.
Partnerships
The Department of Education, Culture and Employment and 2 program officials confirmed that the Department carried out activities to support the formation and maintenance of partnerships as a part of the Strategic Workforce Initiatives program design and delivery. The Department and key informants explained that partners’ expertise, time and financial contributions are all essential to project implementation and success.
The document review of 4 projects confirmed that:
- partnerships were established to support the delivery of all projects
- partners made financial or in-kind contributions, such as providing expertise or staff time to support project delivery
- project activities delivered with the support of partners included workforce plan development and career awareness activities
Performance measurement
As per the Labour Market Transfer Agreements’ Performance Measurement Strategy, the Northwest Territories collected data on:
- the number of employers that participated in the Strategic Workforce Initiatives program
- under-represented groups targeted under the Strategic Workforce Initiatives program
Challenges and lessons learned
The Department of Education, Culture and Employment and key informants identified challenges related to program administration, project holder recruitment, and project holder capacity to develop proposals, build partnerships, and implement projects.
Factors and practices identified as being conducive to the success of the program included:
- having clearly defined project objectives and activities
- ensuring that project holders have the capacity to deliver the project
- ensuring that the project budget is realistic
- ensuring the selection of appropriate partners who will be able to contribute financially and in-kind to the project
- providing guidance and a template to support application through the proposal development process
- involving government officials in project development, implementation, monitoring, and reporting
Key considerations for Labour Market Partnership program and policy development
Key consideration #1
Considering that the current performance indicators do not reflect the diversity of activities funded under Strategic Workforce Initiatives, it is important for ESDC and Northwest Territories to discuss current funded activities in order to make recommendations on how to best report on results.
Key consideration #2
It is important to share lessons learned about successful Strategic Workforce Initiatives projects. Particularly, for projects targeted to employers (such as workplace or employer-sponsored training), and those assisting communities and economic sectors dealing with labour market adjustment issues (contraction or expansion).
Research and InnovationFootnote 40
Research and Innovation projects in the Northwest Territories support the design and development of new initiatives and programs. Funded activities can include, for example, research, stakeholder engagement, and proposal development.
The Northwest Territories used the Research and Innovation program in 5 out the 7 fiscal years between April 2013 and March 2020. Research and Innovation spending varied between 0% ($0) to 3% ($119,000) of annual LMDA expenditures in the territory.
Funded organizations
Funded organizations included local and municipal governments and Indigenous governments, which further subcontracted project deliver to for-profit businesses.
Funded Research and Innovation activity
Research and Innovation programming funded the creation of community labour market development plans, including stakeholder engagement, community labour force analysis, identification of labour force development opportunities, identification of community training needs and development implementation road maps.
Conclusions and recommendations
The Canada-Northwest Territories LMDA is the largest annual investment in active labour market programs and services in the Northwest Territories. Based on the findings presented in this report, the EBSMs are generally helping participants to improve increase their earnings and to reduce their use of some government income support benefits.
Summary of findings
Overall, where results were statistically significant, incremental impacts demonstrate that:
- active claimant participants in Building Essential Skills had improved their earnings and decreased their use of government income supports
- former claimant participants had increased their incidence of employment and earnings
- active claimant participants who received EAS decreased their use of EI by $1,269 and $863 in years 1 and 2 post-program participation respectively.
A subgroup analysis of medium-term outcomes shows that female, male, youth, and Indigenous participants in Building Essential Skills and EAS generally:
- had higher earnings
- used EI benefits less, but used SA benefits more
- had a lower incidence of employment, which could partially be explained by participants’ retirement decisions
While no incremental impact analysis was conducted for Training-on-the-Job, outcomes were identified for active claimant participants in EAS, and for former claimant participants in Training-on-the-Job and EAS. Outcomes for these participants were consistent with those for subgroup participants in Building Essential Skills and EAS.
A series of supplemental studies address information gaps previously identified in LMDA evaluations for Self-Employment Option, JCP, Strategic Workforce Initiatives and Research and Innovation. Overall, it was found that the Northwest Territories use:
- the Self-Employment Option program to assist participants in creating employment for themselves by providing them with a range of services
- JCP to collaborate with community organizations and employers to develop the territorial labour market by providing participants with the opportunity to gain work experience or training that improves their employment prospects
- Strategic Workforce Initiatives to support activities that promote labour force development, support workforce adjustments and facilitate effective human resources planning
- Research and Innovation to support the design and development of activities that support community labour market development
Recommendations
Since 2012, 15 qualitative and quantitative studies addressed issues and questions related to EBSM design, delivery and effectiveness. The quantitative studies successfully assessed the effectiveness and efficiency of EBSMs by producing incremental impacts and cost-benefit analysis. The qualitative studies help to contextualize the findings from the quantitative studies and to identify specific challenges, lessons learned and best practices associated with the design and delivery of EBSMs. Each study included key considerations for program and policy development or recommendations.
In addition, the recently completed evaluation of the Workforce Development Agreements complements the LMDA qualitative studies. This comprehensive evaluation provided unique insights into challenges and lessons learned to assist persons with disabilities, immigrants and those further removed from the labour market.
Advanced causal analysis permitting the attribution of impacts to specific EBSMs was conducted as part of this evaluation. These analyses are predicated on having access to high quality administrative records, thereby confirming the importance of the capacity to leverage and integrate relevant administrative data.
From these main findings, 2 key recommendations for the Northwest Territories emerge:
Recommendation #1
The Northwest Territories are encouraged to share and discuss lessons learned, best practices and challenges associated with the design and delivery of program and services. Discussions are encouraged with ESDC, at the bilateral or multilateral levels as well as with the territorial service delivery network if necessary.
Recommendation #2
The Northwest Territories are encouraged to pursue efforts to maintain and strengthen data collection provisions in support of reporting, performance measurement and data-driven evaluations at the national and territorial levels.
References
Allin, S., Corscadden, L., Gapanenko, K., and Grignon, M. Lifetime Distributional Effects of Publicly Financed Health Care in Canada. CIHI,2013.
Employment and Social Development Canada. Cost-Benefit Analysis: Incorporating Public Health Care Costs Savings in the Context of the Labour Market Programs Evaluation. Internal document, 2022. Available upon request.
Employment and Social Development Canada. Cycle II of the Evaluation of the Labour Market Development Agreements: Cost-Benefit Analysis of Employment Benefits and Support Measures. Internal document, 2015.
Employment and Social Development Canada. Design and delivery of the Job Creation Partnerships program in the Northwest Territories. Internal report, 2019.
Employment and Social Development Canada. Employment Insurance Monitoring and Assessment Reports. 2010 to 2022.
Employment and Social Development Canada. Evaluation of the Canada-Northwest Territories Labour Market Development Agreement – Cycle III: Design and delivery of the Research and Innovation Support measure in the Northwest Territories. Internal report, 2022.
Employment and Social Development Canada. Evaluation of the Canada-Northwest Territories Labour Market Development Agreement – Cycle III: Estimation of medium-term outcomes and incremental impacts from 2009 to 2017. Internal report, 2021.
Employment and Social Development Canada. Evaluation of the Labour Market Development Agreements, Design and delivery of the Self-Employment Option program in the Northwest Territories. Internal report, 2021.
Employment and Social Development Canada. Horizontal evaluation of the Labour Market Development Agreements, Design and delivery of the Strategic Workforce Initiatives program in the Northwest Territories. Internal document, 2021.
Employment and Social Development Canada. Labour Market Development Agreements Process for Determination of Similarity. Internal document, 2012.
Employment and Social Development Canada. Technical Report on the Analysis of Employment Benefits and Support Measures (EBSMs) Profile, Outcomes and Medium-Term Incremental Impacts from 2010 to 2017. Internal report, 2021. Available upon request.
Employment and Social Development Canada. Third Cycle for the Horizontal Evaluation of the Labour Market Development Agreements: Quantitative Methodology Report. Internal document, 2019. Available upon request.
Appendix A. List of 8 studies included in this national synthesis report
This report includes findings from 8 studies
Study 1: Examination of medium-term outcomes from 2009 to 2017
Evidence generated: profile of active and former EI claimants; outcomes by claimant type and by subgroup
Methods: before and after results of program participation
Reference period: 2009 to 2012 participants
Observation period: up to 12 years (5 years before participation, 1 to 2 years of participation, and up to 5 years after participation)
Study 2: Estimation of medium-term incremental impacts from 2009 to 2017
Evidence generated: incremental impacts for active and former EI claimants; incremental impacts by subgroup; profile and socio-demographic characteristics of participants
Methods: non-experimental method using propensity score matching in combination with difference-in-differences; statistical profiling
Reference period: 2009 to 2012 participants
Observation period: up to 7 years (1 to 2 years in program, and up to 5 years after participation)
Study 3: Cost-benefit analysis of Employment Benefits and Support Measures in the Northwest Territories
Evidence generated: cost-benefit analysis
Methods: non-experimental method using propensity score matching in combination with difference-in-differences; cost-benefit analysis
Reference period: 2009 to 2012 participants
Observation period: 5 years post-program for EAS and 10 years post-program for Building Essential Skills
Study 4: Cost-benefit analysis: Incorporating public health care costs savings in the context of the labour market programs evaluation in the Northwest Territories
Evidence generated: cost-benefit analysis
Methods: estimation of adjusted annualized healthcare costs
Reference period: 2009 to 2012 participants
Observation period: 5 years post-program for EAS and 10 years post-program for Building Essential Skills
Study 5: Design and delivery of the Job Creation Partnerships program in the Northwest Territories
Evidence generated: program design and delivery; challenges and lessons learned
Methods: document review; semi-structured telephone interviews with 4 key informants
Reference period: 2017 to 2018
Observation period: 2015 to 2019
Study 6: Design and delivery of the Self-Employment Option program in the Northwest Territories
Evidence generated: program design, delivery and success; define outcomes attributed to the program; fill in knowledge gaps; challenges and lessons learned
Methods: document review; literature review; semi-structured telephone interviews with 10 key informants; statistical analysis of administrative data; survey of Self-employment participants in the Northwest Territories
Reference period: 2015 to 2017 participants
Observation period: 2015 to 2020
Study 7: Design and delivery of the Strategic Workforce Initiatives program in the Northwest Territories
Evidence generated: program design and delivery; challenges and lessons learned
Methods: document review; questionnaire completed the territory; semi-structured interviews with 5 key informants
Reference period: 2018 to 2020
Observation period: design and delivery at the time of the data collection
Study 8: Design and delivery of the Research and Innovation Support measure in the Northwest Territories
Evidence generated: program design and delivery; challenges and lessons learned
Methods: document review; questionnaires completed by key informants
Reference period: 2017 to 2020
Observation period: design and delivery at the time of the data collection
Footnotes
- Footnote 1
-
Incremental impacts for JCP were not produced due to small sample size or due to the fact that the models used to estimate the incremental impacts did not balance. Having balanced models is an essential condition to ensure that participants and non-participants are similar.
- Footnote 2
-
The average cost for Building Essential Skills includes the cost of delivering Building Essential Skills regular and Building Essential Skills apprentices. It is not possible to estimate the cost of delivering Building Essential Skills regular alone because expenditure information is not available for Building Essential Skills regular and Building Essential Skills apprentices separately.
- Footnote 3
-
Strategic Workforce Initiatives and Research and Innovation do not typically have participant specific interventions.
- Footnote 4
-
A fiscal year runs from April 1 to March 31.
- Footnote 5
-
Former claimants can be underemployed and unable to requalify for EI, out of the labour force for various reasons or on social assistance.
- Footnote 6
-
Cost-benefit analysis was not conducted for Training-on-the-Job, as the estimation of incremental impacts was not possible due to the low number of participants.
- Footnote 7
-
EAS is available to all Canadians.
- Footnote 8
-
Employment and Social Development Canada. (2022). 2020 to 2021 EI Monitoring and Assessment Report.
- Footnote 9
-
As of April 1, 2018, eligibility for employment benefits was expanded to include those who have made minimum EI premium contributions above the premium refund threshold (that is $2,000 in earnings) in at least 5 of the last 10 years.
- Footnote 10
-
In July 2016, new provisions were introduced, changing the definition of former claimants to cover those who completed an EI claim in the past 5 years.
- Footnote 11
-
Targeted Earnings Supplements is not examined as part of this evaluation, as it is not currently being used.
- Footnote 12
-
EAS is available to all Canadians.
- Footnote 13
-
Employment and Social Development Canada (2012). Labour Market Development Agreements Process for Determination of Similarity (internal document).
- Footnote 14
-
Former claimants can be underemployed and unable to requalify for EI, out of the labour force for various reasons or on social assistance.
- Footnote 15
-
The average cost for Building Essential Skills includes the cost of delivering Building Essential Skills regular and Building Essential Skills apprentices. It is not possible to estimate the cost of delivering Building Essential Skills regular alone because expenditure information is not available for Building Essential Skills regular and Building Essential Skills apprentices separately.
- Footnote 16
-
Strategic Workforce Initiatives and Research and Innovation do not typically have participant specific interventions.
- Footnote 17
-
For more details about the methodology used for the incremental impacts, please refer to: ESDC, Third Cycle for the Horizontal Evaluation of the Labour Market Development Agreements: Quantitative Methodology Report. (ESDC Evaluation Directorate, 2019, internal document).
- Footnote 18
-
This is based on previous evaluation methodologies, on expert advice and given the difficulty in generating a suitable comparison for former claimants using administrative data alone.
- Footnote 19
-
Further details are available in the report entitled Technical Report on the Analysis of Employment Benefits and Support Measures (EBSMs) Profile, Outcomes and Medium-Term Incremental Impacts from 2010 to 2017 (2021). The report is available upon request.
- Footnote 20
-
Further details about the methodology used for the cost-benefit analysis are available in the technical report entitled Cycle II of the Evaluation of the Labour Market Development Agreements: Cost-Benefit Analysis of Employment Benefits and Support Measures (2015). The report is available upon request.
- Footnote 21
-
Further details about the methodology used for the savings to health care are available in the technical report entitled Cost-Benefit Analysis: Incorporating Public Health Care Costs Savings in the Context of the Labour Market Programs Evaluation (2022). The report is available upon request.
- Footnote 22
-
Further details are available in the report entitled Technical Report on the Analysis of Employment Benefits and Support Measures (EBSMs) Profile, Outcomes and Medium-Term Incremental Impacts from 2010 to 2017 (2021). The report is available upon request.
- Footnote 23
-
The lower incidence of employment can be attributed, in part, to participants’ retirement decisions. The percentage of participants receiving Canada Pension Plan and Old Age Security benefits increased from the pre-participation period to the post-participation period.
- Footnote 24
-
When the same percentage of participants worked in 2 or more industries, all are listed.
- Footnote 25
-
An individual is considered employed if they earned more than $1 from employment or Self-Employment Option in a calendar year.
- Footnote 26
-
Unlike with incremental impacts, outcomes do not compare the labour market experience of participants, before and after their participation with that of a similar non-participant. Accordingly, the outcome analysis provides an assessment of how the labour market situation of participants evolved over time but does not permit inference regarding the extent to which those changes were due to EBSM participation.
- Footnote 27
-
When the same percentage of participants worked in 2 or more occupational groups, all are listed.
- Footnote 28
-
When the same percentage of participants worked in 2 or more occupational groups, all are listed.
- Footnote 29
-
Results for active claimant participants in EAS should be interpreted with caution given the low number of participants (n=56).
- Footnote 30
-
When the same percentage of participants worked in 2 or more industries, all are listed.
- Footnote 31
-
EAS is examined for 1 participation year, while Building Essential Skills is examined for 2 participation years. EAS is examined over 5 post-program years, while Building Essential Skills is examined over 10 years (the first 4 post-program years are based on an observed period, while the fifth year and onwards are projected).
- Footnote 32
-
Please note, the cost of delivering Building Essential Skills pertains to both Building Essential Skills-regular and Building Essential Skills-apprentices since expenditure information is not available for each intervention type separately. However, the benefits detailed in this report are those that relate solely to participation in Building Essential Skills-regular.
- Footnote 33
-
The cost-benefit analysis is conducted only for EAS active claimants, since it is not possible to evaluate incremental impacts for EAS former claimants using available administrative data.
- Footnote 34
-
Findings presented in this section are based on a study entitled Evaluation of the Labour Market Development Agreements, Design and delivery of the self-employment program in the Northwest Territories, January 19, 2021.
- Footnote 35
-
A fiscal year starts on April 1 and ends on March 31.
- Footnote 36
-
Findings in this section are based on EI/CRA data, and key informant interviews with program officials, caseworkers, and service providers. Due to the low number of survey respondents in NWT, this report is unable to provide post-program outcome information from participants regarding employment levels, earnings, financial situation, importance of services received to launching a business, skills acquisition, job satisfaction, the number of participants who launched a business during participation, hours worked, business viability, and the number of employees hired. For information at the national level regarding these results, please consult the LMDA report Design and delivery of the self-employment program.
- Footnote 37
-
Findings presented in this section are based on a study entitled Design and delivery of the JCP program in the Northwest Territories, September 23, 2019.
- Footnote 38
-
As specified by the EI Act, Part I refers to federally delivered direct income supports and Part II refers to provincially or territorially delivered employment benefits.
- Footnote 39
-
Further details about the program are available in a study entitled Horizontal evaluation of the Labour Market Development Agreements, Design and delivery of the Strategic Workforce Initiatives program in the Northwest Territories, November 2, 2021.
- Footnote 40
-
Findings in this section are based on a document review and a written questionnaire completed by the Northwest Territories. Reviewed documents included, for example, territorial program guidelines, EI Monitoring and Assessment reports, and project documents.
Page details
- Date modified: