
Gender-Based Analysis Plus Exploratory Evaluation Study on Selected Labour Market Programs
Official title: Gender-based analysis plus exploratory evaluation study on selected labour market programs: final report (March 2023)
Alternate formats

Large print, braille, MP3 (audio), e-text and DAISY formats are available on demand by ordering online or calling 1 800 O-Canada (1-800-622-6232). If you use a teletypewriter (TTY), call 1-800-926-9105.
List of acronyms
- APE
- Action Plan Equivalent
- ATE
- Average Treatment Effect
- ATET
- Average Treatment Effect on the Treated
- CRA
- Canada Revenue Agency
- EI
- Employment Insurance
- ESDC
- Employment and Social Development Canada
- GATE
- Group Average Treatment Effect
- GBA Plus
- Gender-Based Analysis Plus
- IATE
- Individualized Average Treatment Effect
- LMDA
- Labour Market Development Agreements
- MCF
- Modified Causal Forest
- OFPD
- Opportunities Fund for Persons with Disabilities
- SD
- Skills Development
- TWS
- Targeted Wage Subsidies
List of tables
- Table 1: Difference in program impacts between female recent immigrants and male recent immigrants who were active EI claimant participants in TWS before and after controlling for different characteristics
- Table 2: Recent immigrant participants in TWS (active EI claimants): Distribution by age and sex
- Table 3: Recent immigrant participants in TWS (active EI claimants): Distribution by socio-demographic groups and sex
- Table 4: Recent immigrant participants in TWS (active EI claimants): Distribution by marital status and sex
- Table 5: Recent immigrant participants in TWS (active EI claimants): Distribution by education level and sex
- Table 6: Recent immigrant participants in TWS (active EI claimants): Distribution by profession and sex
- Table 7: Active EI participants (all groups) that started an action plan equivalent under LMDA between 2011 and 2012: Distribution by intersecting identity factors, sex and APE type
- Table 8: Active EI participants who were 30 years old or younger that started an action plan equivalent under LMDA between 2011 and 2012: Distribution by intersecting identity factors, sex and APE type
- Table 9: Active EI participants who were 31 to 54 years old that started an action plan equivalent under LMDA between 2011 and 2012: Distribution by intersecting identity factors, sex and APE type
- Table 10: Active EI participants who were 54 years and older that started an action plan equivalent under LMDA between 2011 and 2012: Distribution by intersecting identity factors, sex and APE type
- Table 11: Active EI participants who were Indigenous that started an action plan equivalent under LMDA between 2011 and 2012: Distribution by intersecting identity factors, sex and APE type
- Table 12: Active EI participants who were persons with disabilities that started an action plan equivalent under LMDA between 2011 and 2012: Distribution by intersecting identity factors, sex and APE type
- Table 13: Active EI participants who were visible minorities that started an action plan equivalent under LMDA between 2011 and 2012: Distribution by intersecting identity factors, sex and APE type
- Table 14: Active EI participants who were recent immigrants that started an action plan equivalent under LMDA between 2011 and 2012: Distribution by intersecting identity factors, sex and APE type
- Table 15: Former participants (all groups) that started an action plan equivalent under LMDA between 2011 and 2012: Distribution by intersecting identity factors, sex and APE type
- Table 16: Former participants who were 30 years old or younger that started an action plan equivalent under LMDA between 2011 and 2012: Distribution by intersecting identity factors, sex and APE type
- Table 17: Former participants who were 31 to 54 years old that started an action plan equivalent under LMDA between 2011 and 2012: Distribution by intersecting identity factors, sex and APE type
- Table 18: Former participants who were over 54 year that started an action plan equivalent under LMDA between 2011 and 2012: Distribution by intersecting identity factors, sex and APE type
- Table 19: Former participants who were Indigenous that started an action plan equivalent under LMDA between 2011 and 2012: Distribution by intersecting identity factors, sex and APE type
- Table 20: Former participants who were persons with disabilities that started an action plan equivalent under LMDA between 2011 and 2012: Distribution by intersecting identity factors, sex and APE type
- Table 21: Former participants who were visible minorities that started an action plan equivalent under LMDA between 2011 and 2012: Distribution by intersecting identity factors, sex and APE type
- Table 22: Former participants who were recent immigrants that started an action plan equivalent under LMDA between 2011 and 2012: Distribution by intersecting identity factors, sex and APE type
- Table 23: Number of participants that started an action plan equivalent under Opportunity Fund between 2011 and 2012: Distribution by sex, APE type and other intersecting identity factors
List of figures
- Figure 1: Three levels of treatment effect produced with (based on Lechner, 2019)
- Figure 2: Incremental impacts by gender and by other subgroups for active claimants in SD, 5-year post-participation period, annual averages
- Figure 3: Incremental impacts by gender and by other subgroups for active claimants in TWS, 5-year post-participation period, annual averages
- Figure 4: Incremental impacts by gender and by other subgroups for active claimants in either SD or TWS, 5-year post-participation period, annual averages
- Figure 5: Incremental impacts by gender and by other subgroups in SD for former claimants, 5-year post-participation period, annual averages
- Figure 6: Incremental impacts by gender and by other subgroups for former claimants in TWS, 5-year post-participation period, annual averages
- Figure B1.1.1: IATE distribution for employment earnings for overall participants in SD
- Figure B1.1.2: IATE distribution for incidence of employment for overall participants in SD
- Figure B1.1.3: IATE distribution for dependence on income support for overall participants in SD
- Figure B1.2.1: IATE distribution for employment earnings for overall participants in TWS
- Figure B1.2.2: IATE distribution for incidence of employment for overall participants in TWS
- Figure B1.2.3: IATE distribution for dependence on income support for overall participants in TWS
- Figure B2.1.1: IATE distribution for employment earnings for overall former participants in SD
- Figure B2.1.2: IATE distribution for incidence of employment for overall former participants in SD
- Figure B2.1.3: IATE distribution for dependence on income support for overall former participants in SD
- Figure B2.2.1: IATE distribution for employment earnings for overall former participants in TWS
- Figure B2.2.2: IATE distribution for incidence of employment for overall former participants in TWS
- Figure B2.2.3: IATE distribution for dependence on income support for overall former participants in TWS
- Figure B3.1.1: IATE distribution for employment earnings for overall participants in either SD or TWS
- Figure B3.1.2: IATE distribution for incidence of employment for overall participants in either SD or TWS
- Figure B3.1.3: IATE distribution for dependence on income support for overall participants in either SD or TWS
Executive summary
Overview of the report
The Evaluation Directorate of ESDC conducted this exploratory study to support the Departmental GBA Plus agenda.
This study tested whether a novel machine learning method could effectively provide granular evidence about program impacts according to different intersecting identity factors. The study also aimed to establish optimal quantitative techniques and best practices for conducting GBA Plus analysis for evaluating labour market programs. This can help decision makers better understand “what works for whom” and support in designing and delivering labour market programs.
Taking advantage of the rich administrative data available, the analysis focuses on 2 active labour market programs. These programs are the LMDA and the OFPD. The study considers the following evaluation questions:
- 1) Are there significant differences in the impacts of various interventions supporting participants’ employment outcomes, depending on gender and other intersecting observable socio-demographic characteristics?
- 2) How do these subgroup-specific impacts compare to the average impact across all participants?
The study used administrative panel data from the Labour Market Program Data Platform. This analysis covers all participants who took part in an intervention from April 2010 to December 2012. It follows them up to calendar year 2018 (most recent tax records at the time of the evaluation). This allowed examining incremental impacts over a period of at least 5 years after participation.
The novelty of this study is that it uses a causal machine learning method known as the MCF. This approach helps understand how program impacts vary by going beyond the average impact. It provides granular results on how program impacts vary according to intersecting identity factors. Previous evaluation studies of labour market programs have used the methods of propensity score matching combined with difference-in-difference. These methods allowed examining the average incremental impacts for some predefined subgroups. While these methods provide reliable results, they don’t allow for a granular analysis looking at intersecting identify factors.
The findings suggest that the machine learning method can provide more granular impact analysis at the subgroup level. This is possible when large samples of disaggregated data are available. The analysis was also helpful in gaining a better understanding of gender differences within each subgroup. Finally, when looking at results across all programs, it is possible to see which programs work best for various subgroups.
The analysis shows that some subgroups of participants benefit more than others from specific interventions. Insights derived from such refined analysis could help inform decisions which involve allocating resources towards various types of employment support programs. When interpreting the results, readers should keep in mind that results obtained for each program and intervention type aren’t directly comparable.
This study provided examples of impact results that could support future evaluations when quality participant-level data is available. Findings suggest that machine learning could become a useful tool to support the department’s commitments towards GBA Plus. Evaluations that include complementary lines of evidence (for example, key informant interviews, focus groups) can further contextualize such results. These lines of evidence can provide a finer understanding of the differences across key subgroups of participants. Therefore, it is essential to collect relevant program data in order to assess program impacts. This supports evidence-based policy making as per the objectives of the Policy on Results.
Key findings
Over the 5-year period following the intervention, both LMDA and OFPD participants increased their average annual employment earnings compared to non-participants. They also increased their incidence of employment compared to non-participants during the same period. These results are consistent with findings from previous evaluations of the LMDA and OFPD.
While most subgroups benefited from the programs, the analysis revealed that the program impacts somewhat varied across subgroups of participants. Results suggest that, compared to other subgroups:
- male recent immigrants who were active EI claimants:
- had the largest reduction in dependence on income support from SD
- had the largest increase in employment earnings from TWS
- middle-aged male participants:
- had a larger reduction in dependence on income support from SD
- participants from visible minority groups (female and male):
- had the largest improvement in employment earnings and incidence of employment from participating in TWS
- female participants aged over 54 years:
- had the largest improvement in employment earnings from the OFPD SD or TWS interventions
The analysis also assessed whether there were gender differences by calculating the difference in program impacts between female and male subgroups. However, for most of the subgroups, the results weren’t statistically significant, suggesting that program impacts don’t vary by gender.
These key findings are helpful to demonstrate the net positive impacts of program interventions on participants. Yet, further studies using qualitative research methods might help to understand why certain groups benefited less. Future evaluation cycles of active labour market programs could include both qualitative research methods and the new machine learning method. This could help understand which interventions work best for whom.
Limitations and considerations
The study confirms that novel machine learning methods can be effective to conduct advanced causal analysis. They can also be effective in attributing the impacts of specific interventions to specific subgroups. Impact analysis compares the labour market outcomes of participants with those of similar non-participants. This allows to learn about what would have happened in the absence of the intervention.
Results demonstrate that the MCF method was successful in producing robust gender-based results when datasets are sufficiently large. Future evaluation studies could use the MCF to assess program impacts at the individual level and by intersecting identity factors. While promising, the study highlighted the following limitations to consider when planning similar studies in the future.
From a GBA Plus perspective, the analysis was limited to the information available in administrative data. For example, administrative data includes the biological sex of participants combined with other socio-demographic or identity factors. However, no information was available in administrative datasets regarding gender identifiers of participants other than the biological sex. Therefore, one of the limitations of this study is that it combines biological sex (used as a proxy for gender) and other socio-demographic characteristics. In the future, adding other data sources (Census data from Statistics Canada) could allow for more refined data analysis. It will thus ensure more relevant policy analysis, research and evaluation activities from a GBA Plus perspective.
This type of advanced causal analysis requires large datasets. The larger the dataset, the more reliable and robust results are. The study benefited from a significant number of participants and non-participants leveraging the Labour Market Program Data Platform. This allowed the analysis to produce statistically significant results for 2 main program interventions. With a larger dataset, the study could have produced even more granular results. It could do so by combining gender and additional intersecting factors (for example, age and visible minority status). But most importantly, this means that when there is limited program data, machine learning cannot produce robust results.
Overall, the results are consistent with the previous evaluations. However, for some interventions, we observed slight differences in the magnitude and level of statistical significance. An in-depth comparative analysis will help explain the differences between the results produced by the MCF and those produced by the matching method. Further investigation could help understand the optimal parameters for using the MCF depending on the number of observations available. This suggests that while the machine learning method has shown robust results with large datasets, propensity score matching remains a relevant method. Propensity score matching is a solid and versatile approach to produce average net impact analysis for interventions with a smaller number of participants.
This analysis looked at impacts by program intervention. For each intervention, the study used a unique comparison group. For this reason, results aren’t directly comparable between programs or interventions. Having a unique comparison group in the study allowed to better reflect the set of observable characteristics of their respective participants at the time.
In addition, the study used the APEs as the unit of analysis. It attributed the longest intervention within an APE as the principal intervention. As a result, the study doesn’t capture participants’ involvement in multiple interventions. In the future, additional research could investigate how combining and sequencing these interventions may affect program impacts.
Observation
Findings highlight how important it is for ESDC to collect participant-level data. This will enable data integration and better inform policy analysis, research and evaluation activities, from a GBA Plus perspective.
1. Introduction
The Evaluation Directorate conducted this exploratory study to support the Departmental GBA Plus agenda. It also supports the Government of Canada’s commitment to assessing the potential impacts of policies, programs, and services on diverse groups. Gender and other intersecting identity factors (such as age, disability, Indigenous identity, visible minority and immigration status) are defining attributes of GBA Plus groups.
This study explores whether a novel machine learning method could provide more granular evidence about “what works best for whom” using a GBA Plus lens. Future evaluations could consider this method to provide novel insights into how program impacts vary across diverse groups. These insights could then prove valuable in informing further qualitative research and analysis in support of program design and implementation.
The methodology section provides an overview of the machine learning method and the data sources. The results section presents the highlights from the analysis for key programs. It illustrates that the machine learning method was effective in providing robust and granular program impacts according to GBA Plus intersecting identity factors.
While the results are promising, this report also discusses the considerations and limitations that can inform next steps and future GBA Plus analyses.
2. Background
Since 2011, the Government of Canada has committed to using GBA Plus to advance gender equality in Canada. Adopting gender-based budgeting has been one of the key initiatives in promoting this agenda. The Canadian Gender Budgeting Act of 2018 embodies this important agenda. In part, the Act seeks to ensure that the government considers gender and diversity in allocating public resources.
ESDC programs touch the lives of Canadians across the country. The Department works to ensure that these programs and services meet the diverse needs of all Canadians. Incorporating a GBA Plus lens into evaluations can help identify barriers to access and systemic inequalities experienced by various groups. To that end, this exploratory evaluation study examines 2 active labour market programs. It assesses their impact across diverse groups as defined by gender and other intersecting identity factors. These programs are the LMDA and OFPD.
These programs seek to improve the labour market outcomes of participants through training and support services. The LMDAs are bilateral agreements between Canada and each province and territory. Their objective is to design and deliver employment benefits and support measures. They aim to assist individuals to prepare for, obtain, and maintain employment. The OFPD helps persons with disabilities prepare to find and keep jobs, advance in their careers. It also helps employers hire and integrate persons with disabilities into the work environment and create inclusive and accessible workplaces.
Leveraging high-quality administrative data, ESDC has evaluated the impact of active labour market programs by comparing the outcomes of participants against those of non-participants. There are various methods to build comparison groups of non-participants. Most common methods (for example, propensity score matching) allow for estimating average program impacts. However, these results aren’t at a sufficiently granular level to allow for a refined sub-group analysis or GBA Plus analysis. Methods used in previous evaluations, therefore, only measured average program impacts.
More recently, the Evaluation Directorate used a machine learning approach to examine whether the effectiveness of LMDAs varies across socio-demographic characteristics of participants. This study provided not only the average treatment effect, but also the incremental impacts by gender and other socio-demographic subgroupings. It demonstrated that LMDAs generally had a positive impact on participants. However, studies like this haven’t looked at intersecting factors through a GBA Plus lens.
The current study goes beyond and assesses program impacts through a GBA Plus lens, which intersects gender with other characteristics. For example, it assesses program impacts for female participants who were also Indigenous. It uses an innovative causal machine learning method called MCF that can analyze the impact at a much more granular level. It can provide statistically significant findings on program impacts on the GBA Plus groups of participants. These findings can help understand “what works best for whom” and inform policy and delivery of the labour market programs.
3. Data and methodology
3.1. Data sources, unit of analysis and timeframe
The study uses administrative panel data from the Labour Market Program Data Platform, which includes:
- program participation data
- EI data (part I data on EI claims and part II data on program participation)
- income tax data from the CRA
For LMDA, the analysis covers all participants who started an intervention between April 2010 and December 2012. For the OFPD, the analysis includes all OFPD participants who started an intervention between January 2011 and December 2012. It follows them up to 2018, the most recent year for which data are available. The purpose of selecting this reference period is to examine the incremental impacts over a period of at least 5 years after participation.
The study used separate analyses for the LMDA and OFPD. Under LMDA, for both active and former EI claimantsFootnote 1, this study examines the incremental impacts for gender in interaction with the following socio-demographic characteristics:
- age group
- disability status
- Indigenous identity
- visible minority status
- being a recent immigrant
For the LMDA, the study uses the APE as the unit of analysis. An APE is a group of interventions in which an individual participated within an interval of 6 months of each other. The principal intervention is the longest intervention within the APE. Given the information available, it was possible to conduct the impact analysis for the following LMDA interventions:
- Skills Development (SD) helps participants obtain employment skills by giving them financial assistance in order to attend classroom training
- Targeted Wage Subsidies (TWS) help participants obtain on-the-job work experience by providing employers with a wage subsidy
For the OFPD, the analysis covered only non-EI claimants and the number of participants was insufficient to conduct the analysis by APE types. Therefore, the analysis focused on a group of participants that includes those who took part either in SD or TWS. Future analysis could focus on other program interventions considering data availability. The analysis for SD and TWS under OFPD also produced incremental impacts by gender and other socio-demographic characteristics:
- age group
- visible minority status
- reporting a mental health disability
- Indigenous identity
3.2. Methodology
The method used in this study estimates the effectiveness of the LMDA and OFPD programs. It does so by comparing the outcomes of program participants with their counterfactual outcomes. Counterfactual outcomes are the outcomes that participants would have experienced were they not part of the program. To compare participants with non-participants during the reference period, the analysis needs to include an appropriate comparison group to “stand in” as the counterfactual.
The comparison group for active claimants consisted of EI active claimants who were eligible to participate in the program but didn’t participate. For former and non-EI claimants, it wasn’t possible to identify a comparison group of non-participants using the administrative data available. Instead, the study used former and non-EI claimants who received Employment Assistance Services. This provided a comparison group of individuals who benefited from low-intensity employment services during the same reference period.
This study considers 3 types of outcome variables based on labour market history:
- the employment earnings (that is, incomes earned through paid employment and/or self-employment)
- the incidence of employment (that is, probability of having a job in any given year)
- the dependence on income support (that is, the probability to rely on government-provided income support during a given year)
For each outcome, this study estimated annual average impacts over the 5-year period following an intervention.
This analysis used data that covers a large number of characteristics reflecting the individuals’ labour market experience, including:
- the socio-demographic characteristics of participants and non-participants (for example, age, gender, marital status, disability)
- their economic region and province
- their qualifications (for example, occupational group, skill levels related to their last job before opening their EI claim, industry codes)
- their labour market history (for example, use of EI benefits and social assistance, employment earnings, incidence of employment in the 5 years preceding participation)
This study uses a causal machine learning method called the MCF. It estimates the impact of labour market programs by factors of identity. The method is based on the causal forest proposed by Wager and Athey (2018). This study is among the first to apply the MCF method to GBA Plus analysis using administrative data.
In order to conduct this analysis, this study split the population into 2 groups:
- training data: data used to build the MCF model
- testing data: data used to estimate the impacts of the intervention
In the training phase, the MCF algorithm builds the model by splitting the sample of data into smaller and smaller groups called strata. The algorithm aims to make these strata as homogenous as possible. It also aims to mitigate selection effect and uncover variability in the impact. Then, the trained model calculates the program impacts within each stratum. It does so by computing the difference of the mean outcomes of the participants (treatment group) and non-participants (control group). These phases help avoid errors that could arise if the analysis uses the same datasets to train the model and estimate the intervention’s impact.
As Figure 1 shows, the MCF allows to produce results that estimate net impacts at 3 levels of aggregation:
- the IATEs, which measure the impact of participation compared to non-participation for individuals with particular features
- the GATE, which are in between the IATEs and ATEs with respect to their aggregation levels
- the ATEs and ATET, which represent the average impact on participants’ population on the aggregate level
Individualized Average Treatment Effect (IATE)
Previously unavailable
Grouped Average Treatment Effect (GATE)
Previously unavailable
Average Treatment Effect (ATE)
Previously available
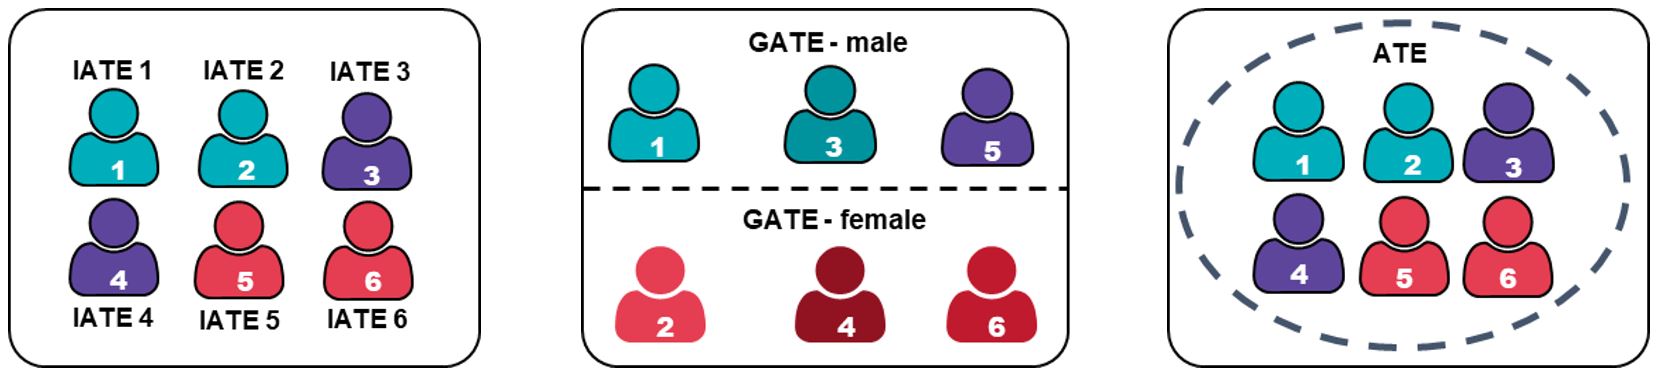
Figure 1 – Text version
Visual representation of MCF model. The model allows to produce results that estimate net impacts at 3 levels of aggregation:
- the IATEs (previously unavailable) measure the impact of participation compared to non-participation for individuals with particular features
- the GATEs (previously unavailable) measure the impact of participation compared to non-participation for groups with specific characteristics (that is, male and female)
- the ATEs (previously available) represent the average impact on participants’ population on the aggregate level
For each subgroup, we calculated the difference in the impacts between female and male subgroups. When gender differences in program impacts were statistically significant, we used an approach known as the entropy balancing. Entropy balancing helps produce a balanced estimation of what the incremental impacts for men would be if they had similar characteristics to women.
This approach is novel compared to the matching approach used in previous evaluations at ESDC. The matching approach isn’t optimized to detect how program impacts vary across participants. MCF enables assessing the impact by sub-groups and produce a more precise understanding of “what works best for whom.” The matching approach only provides the ATEs. The MCF algorithm presents a major benefit by estimating IATEs, GATEs and ATEs jointly. It does so in an internally consistent manner (by aggregation).
A potential limitation of this study is the possibility that there might have been pre-existing differences between the participants and non-participants. The matching process could not have measured these differences, if any. Such factors include ability, health, and motivation to seek employment. The quality of available data and information ensures that pre-existing differences are generally well captured. For example, the study used rich data and information on participants’ and non-participants’ labour market history and skills level related to their last occupation. Still, the matching process could be further refined for specific subgroups as additional information becomes available. For instance, this would include the type and severity of the disability for persons with disabilities. This could also include the country of origin and the level of proficiency in English or French for recent immigrants.
4. Results
4.1. Incremental impacts for LMDA
This section presents incremental impacts of program participation for active claimants as it is the main focus of this report. Annex A presents the results for former claimants. These results illustrate the level of granularity that one can achieve using the MCF method. Interpreting these results in an in-depth manner would require complementary research and analysis, which the future program-specific evaluation cycles could integrate.
4.1.1. Skills Development (SD)
All subgroups improved their labour market outcomes due to SD interventions.
Figure 2 shows the incremental impacts of the SD intervention by gender and for different subgroups. Results take the form of average annual increases/decreases over the 5-year period following participation in the program, relative to similar non-participants. The study provides results for 3 indicators: employment earnings, incidence of employment and dependence on income support.
In particular, for the male recent immigrant subgroup, the intervention led to:
- an average annual increase of $2,535 in post participation earnings for participants
- an average annual increase of 7.3 percentage points in the incidence of employment for participants
- an average annual decrease of 1.1 percentage points in the dependence on income support for participants
These results are consistent with the results from propensity score matching analysis of the third cycle evaluation of LMDA in terms of direction and magnitude of the impacts.

- Notation for significance levels: *** 1% level, ** 5% level, * 10% level. The overall average treatment effect on the participants annotated as the dashed line
Figure 2 – Text version
Incremental impacts by gender and by other subgroups for active claimants in SD, 5-year post-participation period, annual averages
| Subgroups | Employment earnings ($) Female |
Employment earnings ($) Male |
|---|---|---|
| 30 years old or younger | 2,969*** | 3,210*** |
| 31 to 54 years old | 2,323*** | 2,651*** |
| 55 years old or older | 3,070*** | 2,261** |
| Visible minority | 2,387*** | 2,647*** |
| People with disabilities | 2,781*** | 3,040*** |
| Indigenous people | 3,013*** | 3,420*** |
| Recent immigrants | 2,127*** | 2,535*** |
- The overall average treatment effect on the participants for employment earnings is $2,962*** (dashed line).
| Subgroups | Incidence of employment (percentage points) Female |
Incidence of employment (percentage points) Male |
|---|---|---|
| 30 years old or younger | 5.5*** | 4.9*** |
| 31 to 54 years old | 4.4*** | 4.2*** |
| 55 years old or older | 11.3*** | 10.1*** |
| Visible minority | 6.1*** | 6.5*** |
| People with disabilities | 6.1*** | 5.6*** |
| Indigenous people | 6.5*** | 5.9*** |
| Recent immigrants | 6.4*** | 7.3*** |
- The overall average treatment effect on the participants for incidence of employment is 5.2 percentage points*** (dashed line).
| Subgroups | Dependence on income support (percentage points) Female |
Dependence on income support (percentage points) Male |
|---|---|---|
| 30 years old or younger | -0.5 | -0.8 |
| 31 to 54 years old | -0.6 | -1.0** |
| 55 years old or older | 1.1 | 1.1 |
| Visible minority | -0.6 | -0.6 |
| People with disabilities | 0.0 | 0.6 |
| Indigenous people | -0.3 | -0.5 |
| Recent immigrants | -0.7 | -1.1* |
- The overall average treatment effect on the participants for dependence on income support is -0.6 percentage points (dashed line).
- Notes: Notation for significance levels: *** 1% level, ** 5% level, * 10% level.
Most active EI claimants who participated in the SD intervention increased their employment incomes as well as their incidence of employment. Results for the average impact at the participant level (Figures B1.1.1, B1.1.2 and B1.1.3 in Annex B) indicated that overall:
- 94% of participants increased their incidence of employment
- 92% of participants increased their employment earnings
- 59% of participants decreased their dependence on income support
Figure 2 provides a more granular breakdown of program impacts. It shows that all subgroups increased their labour market attachment through increased employment earnings and incidence of employment. Only the magnitude of the impacts varies across subgroups. In terms of dependence on income support, male participants aged between 31 and 54 years and male recent immigrants are the ones that have benefited the most.
The analysis also assessed whether there were gender differences within each of the subgroups. To do so, the study calculated the difference in program impacts between female and male subgroups. However, no results were statistically significant, suggesting that the program impacts may not vary by gender within each subgroup. As a result, we couldn’t conclude that the SD intervention impacts female and male participants differently.
4.1.2. Targeted Wage Subsidies (TWS)
Overall, all subgroups of participants in TWS increased their incidence of employment.
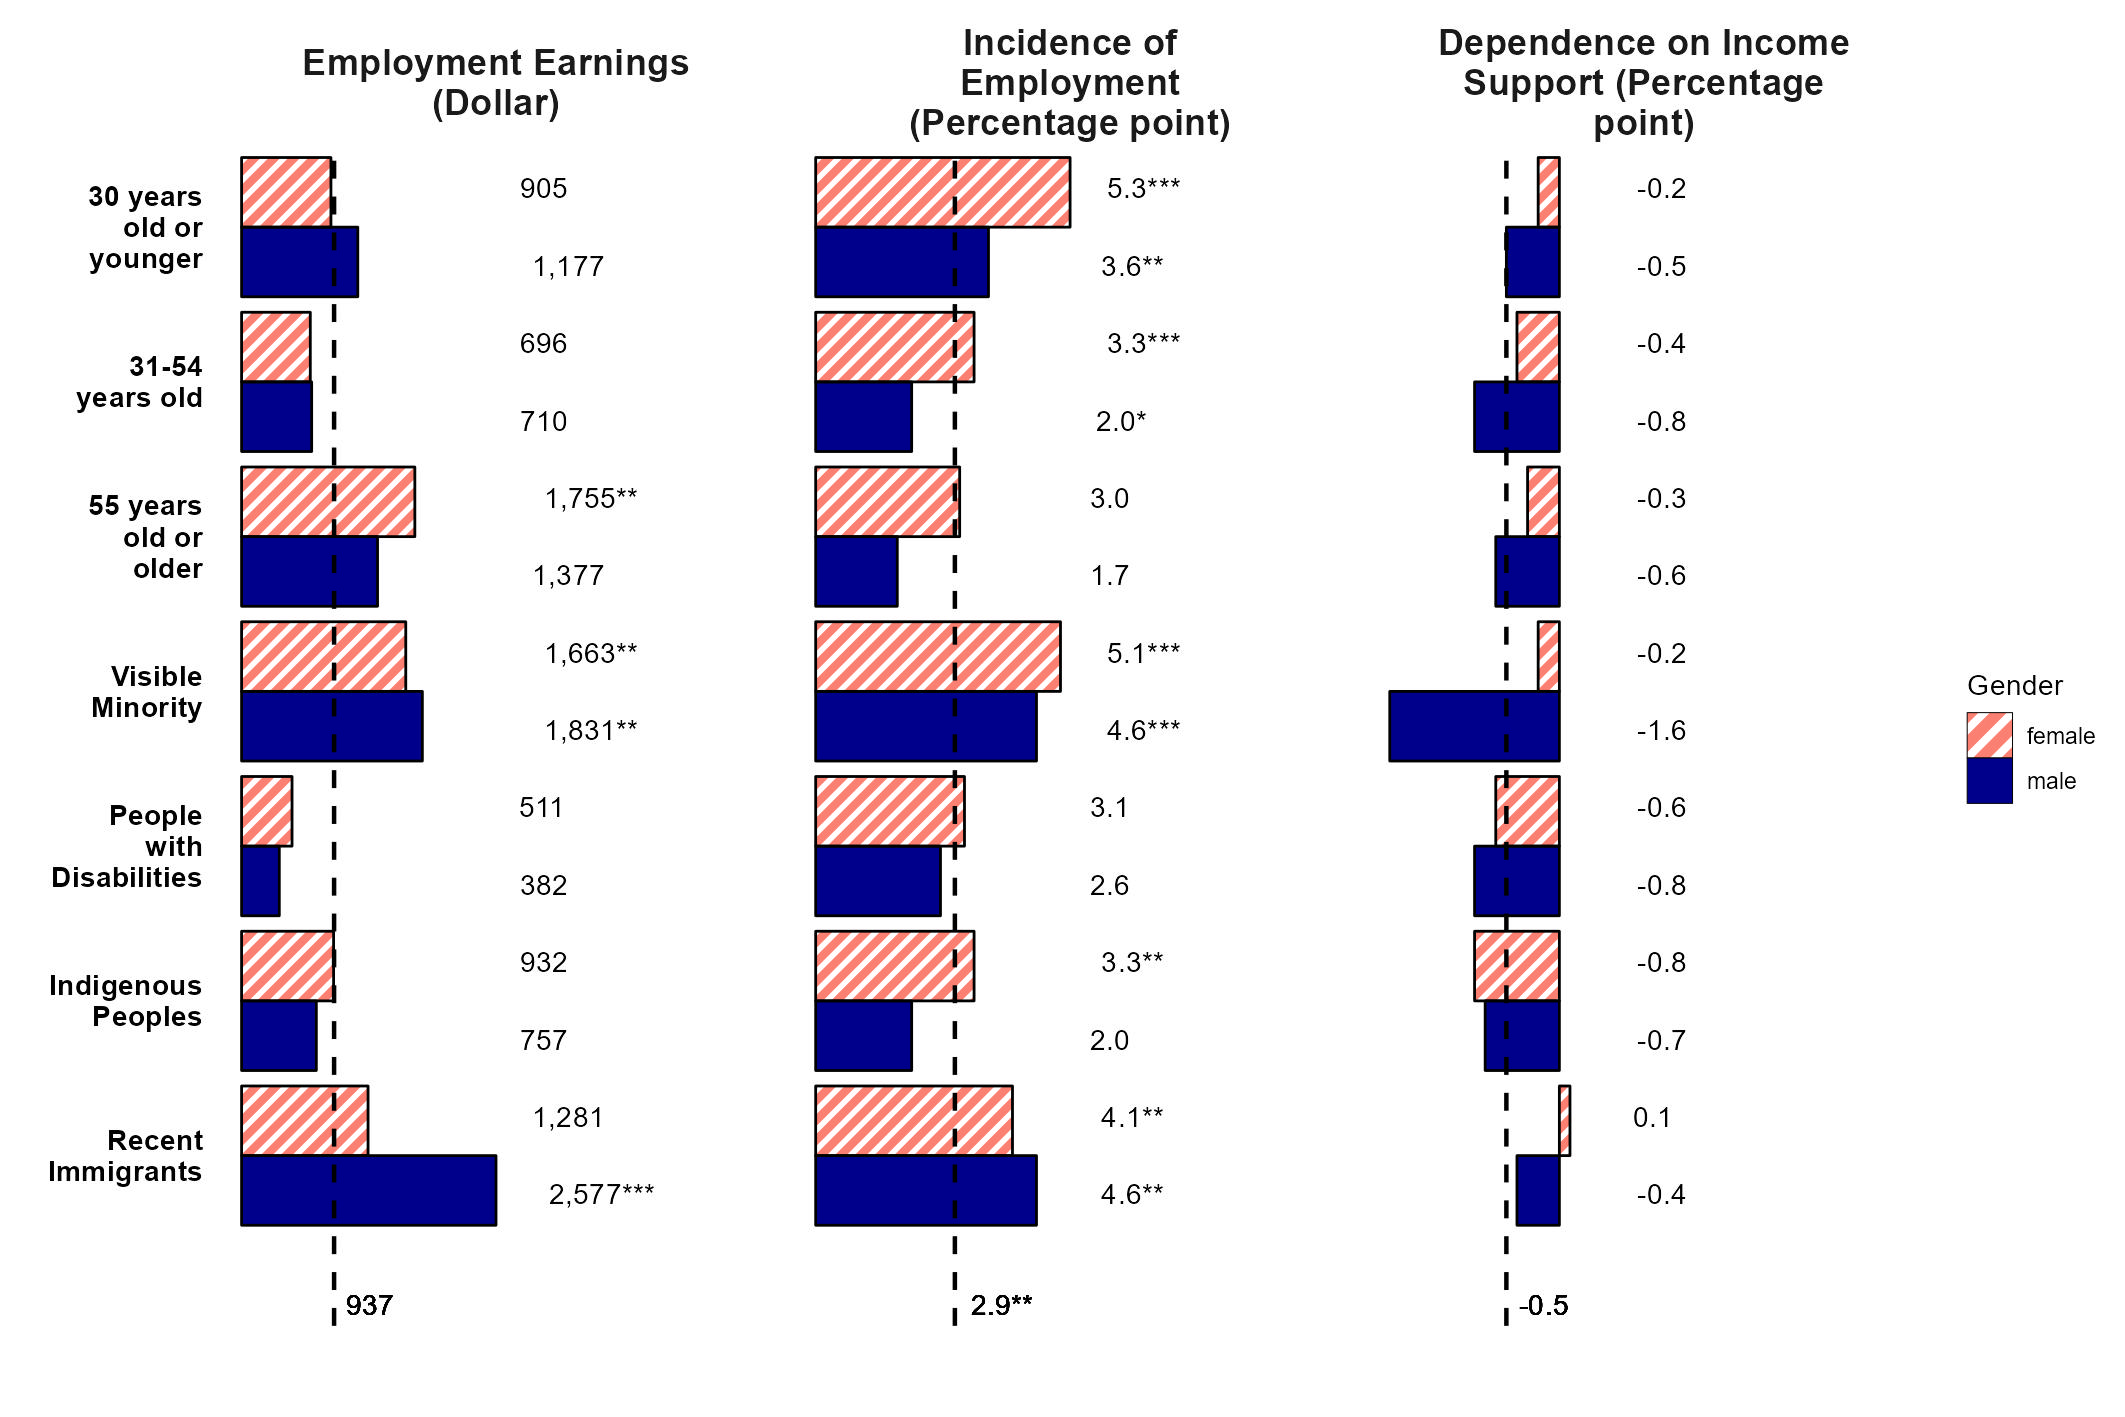
Figure 3 shows the incremental impacts of TWS by gender and for different subgroups. Results take the form of average annual increases over the 5-year period following participation in the program, relative to similar non-participants. The study provides results for 3 indicators: employment earnings, incidence of employment and dependence on income support.
In particular, for the male recent immigrant subgroup, the intervention led to:
- an average annual increase of $2,577 in post participation earnings for participants
- an average annual increase of 4.6 percentage points in the incidence of employment for participants
- an average annual decrease of 0.4 percentage points in the dependence on income support for participants (non-statistically significant)
Also, for the visible minority subgroup, the intervention led to:
- an average annual increase in post participation earnings of $1,663 for female participants and of $1,831 for male participants
- an average annual increase in the incidence of employment of 5.1 percentage points for female participants and of 4.6 percentage points for male participants
- an average annual decrease in the dependence on income support of 0.2 percentage points for female participants and of 1.6 percentage points for male participants (both non-statistically significant)
These results are consistent with the results from propensity score matching analysis of the third cycle evaluation of LMDA. However, we can observe a few marginal differences in terms of magnitude and level of significance. Future evaluation cycles could include further investigations to explain some of the differences.
- Notation for significance levels: *** 1% level, ** 5% level, * 10% level. The overall average treatment effect on the participants annotated as the dashed line.
Figure 3 – Text version
Incremental impacts by gender and by other subgroups for active claimants in TWS, 5-year post-participation period, annual averages
| Subgroups | Employment earnings ($) Female |
Employment earnings ($) Male |
|---|---|---|
| 30 years old or younger | 905 | 1,177 |
| 31 to 54 years old | 696 | 710 |
| 55 years old or older | 1,755** | 1,377 |
| Visible minority | 1,663** | 1,831** |
| People with disabilities | 511 | 382 |
| Indigenous people | 932 | 757 |
| Recent immigrants | 1,281 | 2,577*** |
- The overall average treatment effect on the participants for employment earnings is $937 (dashed line).
| Subgroups | Incidence of employment (percentage points) Female |
Incidence of employment (percentage points) Male |
|---|---|---|
| 30 years old or younger | 5.3*** | 3.6** |
| 31 to 54 years old | 3.3*** | 2.0* |
| 55 years old or older | 3.0 | 1.7 |
| Visible minority | 5.1*** | 4.6*** |
| People with disabilities | 3.1 | 2.6 |
| Indigenous people | 3.3** | 2.0 |
| Recent immigrants | 4.1** | 4.6** |
- The overall average treatment effect on the participants for incidence of employment is 2.9 percentage points** (dashed line).
| Subgroups | Dependence on income support (percentage points) Female |
Dependence on income support (percentage points) Male |
|---|---|---|
| 30 years old or younger | -0.2 | -0.5 |
| 31 to 54 years old | -0.4 | -0.8 |
| 55 years old or older | -0.3 | -0.6 |
| Visible minority | -0.2 | -1.6 |
| People with disabilities | -0.6 | -0.8 |
| Indigenous people | -0.8 | -0.7 |
| Recent immigrants | 0.1 | -0.4 |
- The overall average treatment effect on the participants for dependence on income support is -0.5 percentage points (dashed line).
- Notes: Notation for significance levels: *** 1% level, ** 5% level, * 10% level.
Most active EI claimants who participated in a TWS intervention experienced an increase in their employment income as well as their incidence of employment. Results for the average impact at the participant level (Figures B1.2.1, B1.2.2 and B1.2.3 in Annex B) indicated that overall:
- 79% of participants increased their incidence of employment
- 70% increased their employment earnings, and
- 44% decreased their dependence on income support
Figure 3 provides a more granular breakdown of program impacts. It shows that visible minorities and male recent immigrants are the subgroups who had the most significant improvements in employment earnings and incidence of employment. Overall, results indicate that several subgroups benefited from TWS by increasing their employment earnings and their incidence of employment.
The analysis also assessed whether there were gender differences within each of the subgroups. To do so, the study calculated the difference in program impacts between female and male subgroups. Except for recent immigrants, the findings suggest no statistically significant gender differences in program impacts. As Table 1 shows, for the recent immigrant participants, the increase in employment earnings is higher for men than for women by $1,296. This difference is statistically significant at the level of 5%. The study also notes slight gender differences in favour of men on the incidence of employment and dependence on income support. However, these results aren’t statistically significant.
| Indicators | Employment income ($) | Incidence of employment (percentage point) | Dependence on income support (percentage point) |
|---|---|---|---|
| Characteristics are different | -1,296** | -0.5 | 0.5 |
| Men have similar characteristic as women | -328 | 0.0 | 0.0 |
- Notation for significance levels: *** 1% level, ** 5% level, * 10% level.
However, there are also gender differences in terms of the socio-demographic profile of recent immigrants prior to their participation in TWS. For example, as Annex C shows, male recent immigrants tended to work in construction (10%) or manufacturing (18%) or administration (17%). At the same time, female recent immigrants tended to work in administration (11%) or the professional, scientific and technical services (11%).
These differences may contribute to gender differences in program impacts on employment earnings. In order to account for these socio-demographic differences, we conducted additional analysis while controlling for different socio-demographic characteristics and labour market history. This study estimated what the incremental impacts for male participants would be if they had similar characteristics to female participants, and vice versa. The findings suggest that when factoring out these socio-demographic differences, as Table 1 shows, there is no gender difference. This is due to the fact that differences in program impacts decreased and are no longer statistically significant.
4.2. Incremental impacts for OFPD
This section presents the incremental impact results for the OFPD SD and TWS interventions. In the OFPD program, the number of participants was insufficient to conduct the analysis by intersecting identity factors for each intervention separately. Therefore, the analysis produced the incremental impacts for those who either took part in SD or TWS. The study produced results by gender and other socio-demographic characteristics.
4.2.1. Skills Development (SD) and Targeted Wage Subsidies (TWS)
All subgroups of OFPD participants in either SD or TWS interventions, on average, increased their employment earnings and incidence of employment.
Figure 4 shows the incremental impacts of either SD or TWS by gender and for different subgroups. Results take the form of average annual increases over the 5-year period following participation in the program, relative to similar non-participants. The study produced results for 3 indicators: employment earnings, incidence of employment and dependence on income support.
In particular, for the subgroup of participants aged over 54 years, the intervention led to:
- an average annual increase in post participation earnings of $3,647 for female participants and of $3,257 for male participants
- an average annual increase in the incidence of employment of 13.7 percentage points for female participants and of 13.9 percentage points for male participants
- an average annual increase in the dependence on income support of 0.4 percentage points for female participants and of 0.7 percentage points for male participants (both non-statistically significant)
These results align with those from the last OFPD evaluation cycle. They indicated that SD and TWS had positive outcomes for participants in terms of employment earnings and incidence of employment.

- Notation for significance levels: *** 1% level, ** 5% level, * 10% level. The overall average treatment effect on the participants annotated as the dashed line.
Figure 4 – Text version
Incremental impacts by gender and by other subgroups for active claimants in either SD or TWS, 5-year post-participation period, annual averages
| Subgroups | Employment earnings ($) Female |
Employment earnings ($) Male |
|---|---|---|
| 30 years old or younger | 1,601 | 1,628 |
| 31 to 54 years old | 2,757*** | 2,615*** |
| 55 years old or older | 3,647** | 3,257** |
| Visible minority | 2,798*** | 2,805*** |
| People with disabilities | 2,367*** | 2,425*** |
| Indigenous people | 2,178*** | 2,048** |
- The overall average treatment effect on the participants for employment earnings is $2,361*** (dashed line).
| Subgroups | Incidence of employment (percentage points) Female |
Incidence of employment (percentage points) Male |
|---|---|---|
| 30 years old or younger | 15.2*** | 14.4** |
| 31 to 54 years old | 14.9*** | 15.5*** |
| 55 years old or older | 13.7*** | 13.9*** |
| Visible minority | 15.6*** | 15.4*** |
| People with disabilities | 15.7*** | 16.1*** |
| Indigenous people | 14.7*** | 16.2*** |
- The overall average treatment effect on the participants for incidence of employment is 14.9 percentage points*** (dashed line).
| Subgroups | Dependence on income support (percentage points) Female |
Dependence on income support (percentage points) Male |
|---|---|---|
| 30 years old or younger | 3.4 | 4.7 |
| 31 to 54 years old | 1.0 | -0.5 |
| 55 years old or older | 0.4 | 0.7 |
| Visible minority | 1.0 | 0.8 |
| People with disabilities | 1.4 | -0.2*** |
| Indigenous people | 2.0 | 2.2 |
- The overall average treatment effect on the participants for dependence on income support is 1.7 percentage points (dashed line).
- Notes: Notation for significance levels: *** 1% level, ** 5% level, * 10% level.
Most OFPD participants in either SD or TWS increased their employment income as well as their incidence of employment. In particular, results for the Individualized ATE (Figures B3.1.1, B3.1.2 and B3.1.3 in Annex B) indicated that:
- 89% of these participants increased their incidence of employment
- 84% increased their employment earnings
- 48% decreased their dependence on income support
Figure 4 provides a more granular breakdown of program impacts. It shows that most subgroups of participants in either SD or TWS increased their employment earnings and incidence of employment. Participants aged over 54 years old saw the greatest improvement to their employment earnings. This gain is the largest for female participants over 54 years old, but there is no statistically significant difference in impacts between male and female. Considering that the analysis covered participants in either SD or TWS, this analysis cannot inform the extent to which each intervention contributed to the outcomes.
The analysis also assessed whether there were gender differences within each of the subgroup. To do so, the study calculated the difference in program impacts between female and male participants. However, no results were statistically significant, suggesting that the program impacts may not vary by gender within each subgroup.
5. Limitations
Machine learning can be effective in conducting advanced causal analysis whereby impacts can be attributed to a specific program for various subgroups. Impact analysis compares the labour market outcomes of participants with those of similar non-participants. It allows learning about what would have happened in the absence of the intervention. Results demonstrate that the MCF method was successful in producing statistically significant results by gender when sample size was sufficiently large.
While promising, the study highlighted the following limitations, which future evaluations and studies could consider.
From a GBA Plus perspective, the analysis was limited to the information available in administrative data. For example, administrative data contains various identity factors, including the biological sex of participants combined with other socio-demographic characteristics. However, no information was available in administrative datasets regarding gender identifiers of participants other than the biological sex. Therefore, this study combines biological sex (used as a proxy for gender) and other socio-demographic characteristics. In future, adding other data sources (Census data from Statistics Canada) could allow for more refined data analysis. It will ensure a more relevant policy analysis, research and evaluation activities from a GBA Plus perspective.
This type of advanced causal analysis requires large datasets. The larger the dataset, the more reliable and robust results are. The study benefited from a significant sample of participants and non-participants leveraging the Labour Market Program Data Platform. This allowed the analysis to produce statistically significant results for 2 main program interventions. With a larger dataset, the study could have produced even more granular results. It could do so by combining additional intersecting identity factors (for example, gender, age and visible minority status). But most importantly, this means that when there is limited program data, machine learning could not produce robust results.
Overall, the results are consistent with the previous evaluations. However, for some interventions there are slight differences in the magnitude and level of statistical significance. An in-depth comparative analysis will help explain the differences between the results produced by the MCF and those produced by propensity score matching method. It is possible that the dataset, even if relatively large, was too small for some interventions to allow the algorithm to perform well. This may lead to results with a high level of variability. Further investigation could help understand the optimal parameters for using the MCF depending on the number of observations available. This suggests that while the MCF method has shown robust results with large sample sizes, the propensity score matching method remains a relevant approach. Propensity score matching is a solid and versatile approach that can produce average net impacts with a relatively smaller number of participants.
This study performed the analysis by looking at impacts by program intervention. For each intervention, the study used a unique comparison group. For this reason, results aren’t directly comparable between programs or interventions. Having a unique comparison group in the study allowed to better reflect the set of observable characteristics of their respective participants at the time.
In addition, the study used the APE as the unit of analysis. It attributed the longest intervention within an APE as the principal intervention. As a result, the study does not capture participants’ involvement in multiple interventions. Future, research could look at how combining and sequencing these interventions may affect program impacts.
6. Conclusion
This report presents the findings from an exploratory study of the LMDAs and OFPD. The report used the GBA Plus as an analytical framework. Methodologically, the study applied a causal machine learning method known as the MCF. Using MCF, it assessed program impacts by gender and intersecting identity factors.
Previous evaluation studies of labour market programs have provided valuable information by examining incremental impacts for some predefined subgroups. Yet, they have not applied a GBA Plus lens looking at multiple intersecting characteristics (for example, young Indigenous women).
In contrast, this evaluation study leveraged quality participant-level data to examine how program impacts vary according to gender and intersecting identity factors. The findings suggest that machine learning can be effective to produce robust results when the number of participants is sufficiently large. Results provide more than the average impact and can help understand the distribution of impacts (positive or negative) across participants.
However, machine learning requires substantial amounts of data. The method didn’t produce statistically significant results for some interventions with a relatively smaller number of participants. Further analysis would help understand the optimal parameters for using machine learning depending on the data available. Therefore, while this approach is promising, the propensity score matching combined with difference-in-difference methods remains a reliable tool to conduct net impact analysis.
This study provided examples of quantitative results that machine learning could produce for future program-specific evaluation cycles when quality participant-level data is available. Findings suggest that the machine learning method has the potential to become a tool for impact evaluations. It can support the department’s commitments towards GBA Plus.
Going forward, labour market program evaluations could leverage these new advanced quantitative methods to inform impacts from a GBA Plus perspective. These evaluations could also include complementary qualitative research that would ensure the quantitative results can be appropriately contextualized. Depending on the data available, integrating a third intersecting factor could be explored to refine the analysis further. This could provide a more nuanced understanding of which interventions work best for whom.
Finally, the report highlights the importance of the department’s efforts to collect participant-level data. This will enable data integration and better inform policy analysis, research and evaluation activities, from a GBA Plus perspective.
References
Athey, S., Tibshirani, J., & Wager, S. (2019). Generalized Random Forests. Annals of Statistics, 47(2), 1148-1178. doi:10.1214/18-AOS1709.
Athey, S., & Wager, S. (2021). Policy Learning with Observational Data. Econometrica, 89(1), 133–161.
Breiman, L. (2001). Random Forests. Machine Learning, 45(1), 5–32.
Chattopadhyay, A., Hase, C., & Zubizarreta, J.R. (2020). Balancing Versus Modeling Approaches to Weighting in Practice. Statistics in Medicine, 39(24), 3227-3254.
Chen, J., & Hsiang, C.-W. (2019). Causal Random Forests Model Using Instrumental Variable Quantile Regression. Econometrics, 7(4): 49.
Chen, J., Huang, C.-H., & Tien, J.J. (2021). Debiased/Double Machine Learning for Instrumental Variable Quantile Regressions. Econometrics, 9(2): 15.
Cockx, B., Lechner, M., & Bollens, J. (May 6, 2020). Priority to Unemployed Immigrants? A Causal Machine Learning Evaluation of Training in Belgium. Repository arXiv.
Cockx, B., Lechner, M., & Bollens, J. (2023). Priority to unemployed immigrants? A causal machine learning evaluation of training in Belgium. Labour Economics, Volume 80, January 2023, 102306.
Davis, J.M.V., & Heller, S.B. (2017). Using Causal Forests to Predict Treatment Heterogeneity: An Application to Summer Jobs. American Economic Review, 107(5), 546-550.
Department of Women and Gender Equality. (August 6, 2020). Introduction to GBA+.
Department of Women and Gender Equality. (July 18, 2017) GBA+ Research Guide.
ESDC (Employment and Social Development Canada). (September 8, 2015). EI Monitoring and Assessment Report 2012/13 Impacts and Effectiveness of Employment Benefits and Support Measures (EBSMs—EI Part II).
ESDC (Employment and Social Development Canada). (January 8, 2020). Evaluation of the Opportunities Fund for Persons with Disabilities – Phase I.
Hankivsky, O. (2014). Intersectionality 101. The Institute for Intersectionality Research & Policy, SFU.
Hainmueller, J. (2012). Entropy Balancing for Causal Effects: A Multivariate Reweighting Method to Produce Balanced Samples in Observational Studies. Political Analysis, 20(1), 25-46.
James, G., Witten, D., Hastie, T. & Tibshirani, R. (2013). An introduction to statistical learning: with applications in R. Springer
Knaus, M.C., Lechner, M., & Strittmatter, A. (2020). Machine Learning Estimation of Heterogeneous Causal Effects: Empirical Monte Carlo Evidence. The Econometrics Journal, 21(1), 134-161.
Lechner, Michael, Modified Causal Forests for Estimating Heterogeneous Causal Effects (January 2019). CEPR Discussion Paper No. DP13430, Available at SSRN: https://ssrn.com/abstract=3314050
Lechner, M., & Mareckova, J. (2022): Modified Causal Forests, arXiv: 2209.03744
Neyman, J., Iwaszkiewicz, K. & Kolodziejczyk, St. (1935). Statistical Problems in Agricultural Experimentation. Supplement to the Journal of the Royal Statistical Society, 2(2), p.107.
Phillippo, D. M., Dias, S., Ades, A. E., & Welton, N. J. (2020). Equivalence of Entropy Balancing and the Method of Moments for Matching-Adjusted Indirect Comparison. Research Synthesis Methods, 11(4), 568-572.
Roy, A. D. (1951). Some Thoughts on the Distribution of Earnings. Oxford Economic Papers, 3(2), 135–146
Rubin, D. B. (1974). Estimating Causal Effects of Treatments in Randomized and Nonrandomized Studies. Journal of Educational Psychology, 66(5), 688–701.
Tübbicke, S. (May 28, 2020). Entropy Balancing for Continuous Treatments. Repository arXiv.
Wager, S., & Athey, S. (2018). Estimation and Inference of Heterogeneous Treatment Effects using Random Forests. Journal of the American Statistical Association, 113(523), 1228-1242.
Zhao, Q., & Percival, D. (2016). Entropy Balancing is Doubly Robust. Journal of Causal Inference, 5(1), 20160010. https://doi.org/10.1515/jci-2016-0010
Annex A: Incremental impacts for LMDA former claimants
Skills Development (SD)
Most of the subgroups of participants in SD who were former EI claimants improved their labour market attachment.
Figure 5 shows incremental impacts of the SD intervention by gender and other subgroups. Results take the form of average annual increases over the 5-year period following the receipt of the intervention relative to similar non-participants. The study provides results for 3 indicators: employment earnings, incidence of employment and dependence on income support.
These results are consistent with the results from propensity score matching analysis of the third cycle evaluation of LMDA. They are consistent in terms of direction, magnitude and level of significance of the impacts.

- Notation for significance levels: *** 1% level, ** 5% level, * 10% level. The overall average treatment effect on the participants annotated as the dashed line.
Figure 5 -Text version
Incremental impacts by gender and by other subgroups in SD for former claimants, 5-year post-participation period, annual averages
| Subgroups | Employment earnings ($) Female |
Employment earnings ($) Male |
|---|---|---|
| 30 years old or younger | 1,884*** | 1,931*** |
| 31 to 54 years old | 1,073*** | 1,060** |
| 55 years old or older | 1,238** | 1,407** |
| Visible minority | 838 | 922* |
| People with disabilities | 1,883*** | 1,798*** |
| Indigenous people | 2,288*** | 2,087*** |
| Recent immigrants | -794 | -947 |
- The overall average treatment effect on the participants for employment earnings is $1,363*** (dashed line).
| Subgroups | Incidence of employment (percentage points) Female |
Incidence of employment (percentage points) Male |
|---|---|---|
| 30 years old or younger | 3.1*** | 3.0*** |
| 31 to 54 years old | 3.1*** | 3.6*** |
| 55 years old or older | 4.4* | 4.7** |
| Visible minority | 3.4*** | 3.4*** |
| People with disabilities | 4.3*** | 4.6*** |
| Indigenous people | 4.3*** | 3.4*** |
| Recent immigrants | 1.7 | 2.0* |
- The overall average treatment effect on the participants for incidence of employment is 3.3 percentage points*** (dashed line).
| Subgroups | Dependence on income support (percentage points) Female |
Dependence on income support (percentage points) Male |
|---|---|---|
| 30 years old or younger | -0.4 | 0.0 |
| 31 to 54 years old | -1.5*** | -1.3** |
| 55 years old or older | -1.4** | -1.0 |
| Visible minority | -1.4** | -0.9* |
| People with disabilities | -1.7*** | -1.3** |
| Indigenous people | -1.1* | -0.5 |
| Recent immigrants | -1.0* | -1.0* |
- The overall average treatment effect on the participants for dependence on income support is -1.0* percentage points (dashed line).
- Notes: Notation for significance levels: *** 1% level, ** 5% level, * 10% level.
Former EI claimants who participated in SD increased their employment earnings and incidence of employment and decreased their dependence on income support. As Figures B2.1.1, B2.1.2 and B2.1.3 in Annex B show:
- 80% of participants increased their incidence of employment
- 62% increased their employment earnings
- 48% decreased their dependence on income support
Except for both female and male participants who were recent immigrants, all subgroups of participants in SD improved their labour market attachment. Results indicate statistically significant increases in employment earnings and incidence of employment. Except for young participants, male participants who were over 54 years or Indigenous, all subgroups in SD significantly decreased their dependence on income support.
The analysis also assessed gender-based differences within each of the subgroups by calculating the difference in program impact between female and male subgroups. However, no results were statistically significant, suggesting that the program impact may not vary by gender within each subgroup.
Targeted Wage Subsidies (TWS)
All subgroups of participants in TWS who were former EI claimants increased their employment earnings and their incidence of employment. They also decreased their dependence on income support.
Figure 6 shows the incremental impacts of TWS by gender and other subgroups. Results take the form of average annual increases over the 5-year period following participation in the program, relative to similar non-participants. The study provides results for 3 indicators: employment earnings, incidence of employment and dependence on income support.
These results are consistent with the results from propensity score matching analysis of the third cycle evaluation of LMDA.
All subgroups of participants in TWS had a statistically significant increase in their employment earnings and their incidence of employment. They also experienced a statistically significant decrease in their dependence on income support. The analysis also assessed gender-based differences within each of the subgroups by calculating the difference in program impact between female and male subgroups. However, no results were statistically significant, suggesting that the program impact wouldn’t vary by gender within each subgroup.

- Notation for significance levels: *** 1% level, ** 5% level, * 10% level. The overall average treatment effect on the participants annotated as the dashed line.
Figure 6 -Text version
Incremental impacts by gender and by other subgroups for former claimants in TWS, 5-year post-participation period, annual averages
| Subgroups | Employment earnings ($) Female |
Employment earnings ($) Male |
|---|---|---|
| 30 years old or younger | 3,607*** | 3,623*** |
| 31 to 54 years old | 3,267*** | 3,077*** |
| 55 years old or older | 3,660*** | 3,376*** |
| Visible minority | 3,938*** | 4,041*** |
| People with disabilities | 3,261*** | 3,108*** |
| Indigenous people | 3,625*** | 3,856*** |
| Recent immigrants | 3,246*** | 3,150*** |
- The overall average treatment effect on the participants for employment earnings is $3,330*** (dashed line).
| Subgroups | Incidence of employment (percentage points) Female |
Incidence of employment (percentage points) Male |
|---|---|---|
| 30 years old or younger | 8.1*** | 8.1*** |
| 31 to 54 years old | 8.1*** | 8.7*** |
| 55 years old or older | 12.3*** | 10.6*** |
| Visible minority | 9.4*** | 10.6*** |
| People with disabilities | 9.2*** | 9.4*** |
| Indigenous people | 9.7*** | 9.0*** |
| Recent immigrants | 9.0*** | 9.3*** |
- The overall average treatment effect on the participants for incidence of employment is 8.8 percentage points*** (dashed line).
| Subgroups | Dependence on income support (percentage points) Female |
Dependence on income support (percentage points) Male |
|---|---|---|
| 30 years old or younger | -3.7*** | -3.9*** |
| 31 to 54 years old | -3.1*** | -3.1*** |
| 55 years old or older | -2.7*** | -3.1*** |
| Visible minority | -3.2*** | -3.2*** |
| People with disabilities | -3.6*** | -3.6*** |
| Indigenous people | -2.9** | -3.0*** |
| Recent immigrants | -2.9*** | -3.0*** |
- The overall average treatment effect on the participants for dependence on income support is -3.3*** percentage points (dashed line).
- Notes: Notation for significance levels: *** 1% level, ** 5% level, * 10% level.
Annex B: Graphs on individualized average treatment effect distribution
This section provides graphs which show how the individualized average treatment effects are distributed. Graphs are produced in the form of histograms and show whether the impact of a given program intervention had a positive outcome on participants.
Horizontal axes show how the impacts are distributed among participants according to their IATEs. Graphs show the IATEs by program interventions (SD and TWS) for the following indicators:
- employment earnings
- incidence of employment
- dependence on income support
For employment earnings and incidence of employment, any value above 0 indicates a positive outcome and below 0 a negative outcome. The greater the value of IATE, the more beneficial program intervention is.
For dependence on income support, any value below 0 indicates a positive outcome and above 0 a negative outcome. The lower the value of IATE, the more beneficial program intervention is.
B1. Individualized average treatment effect for active participants in LMDA
Overall impact of SD at the participant level:
- 94% of participants increased their incidence of employment
- 92% of participants increased their employment earnings
- 59% of participants decreased their dependence on income support
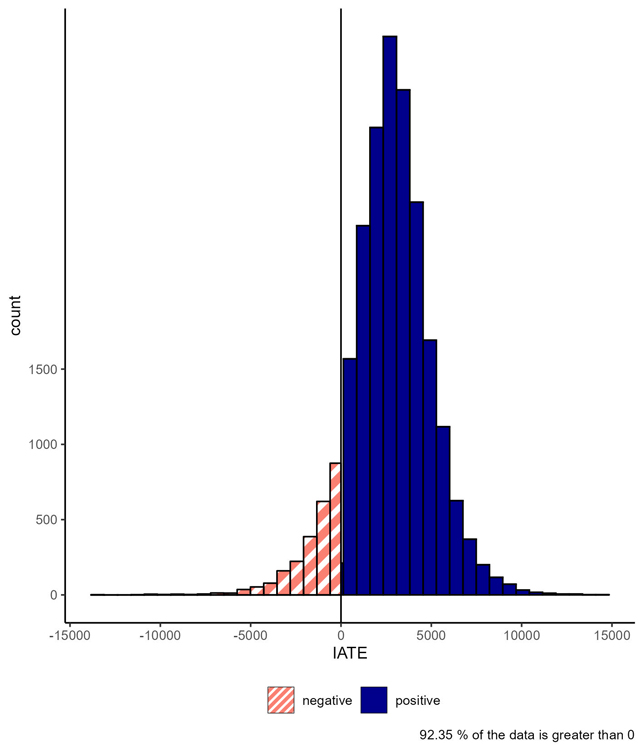
Figure B1.1.1 -Text version
Distribution of individual average treatment effects for employment earnings for overall participants in SD.
The histogram shows the distribution of IATEs for employment earnings. The distribution curve is almost normal around the average. The histogram highlights negative values below 0 (7.65%) and positive values above 0 (92.35%). Most of the program participants in SD (92.35%) increased their employment earnings following participation in the program.
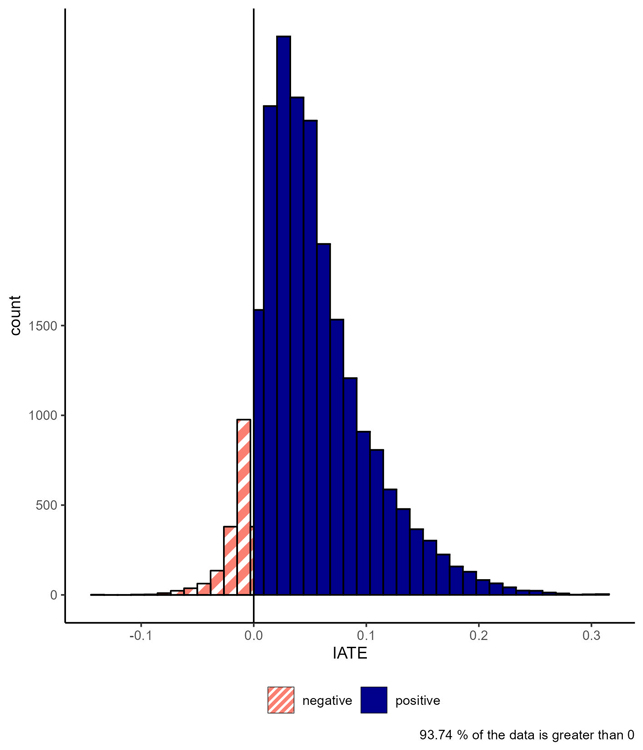
Figure B1.1.2 -Text version
Distribution of individual average treatment effects for incidence of employment for overall participants in SD.
The histogram shows the distribution of IATEs for the incidence of employment. The distribution curve is asymmetric. It has a mostly positive skew and longer right tail. The histogram highlights negative values below 0 (6.26%) and positive values above 0 (93.74%). Most of the program participants in SD (93.74%) increased their incidence of employment following participation in the program.
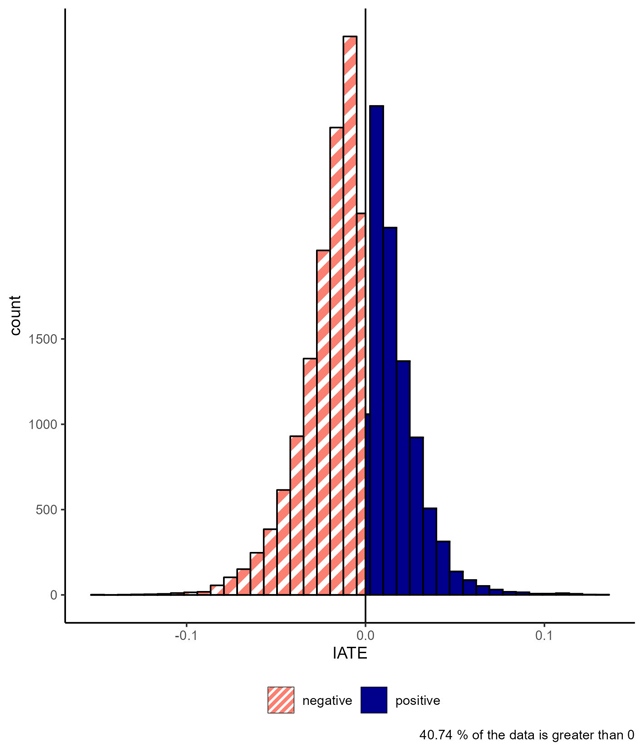
Figure B1.1.3 -Text version
Distribution of individual average treatment effects for dependence on income support for overall participants in SD
The histogram shows the distribution of IATEs for dependence on income support. The distribution curve is almost normal and centred around 0. The histogram highlights negative values below 0 (59.26%) and positive values above 0 (40.74%). Following participation in the program, 59.26% of participants in SD (below 0) decreased their dependence on income support.
Overall impact of TWS at the participant level (for active EI participants):
- 79% of participants increased their incidence of employment
- 70% of participants increased their employment earnings
- 44% decreased their dependence on income support

Figure B1.2.1 -Text version
Distribution of individual average treatment effects for employment earnings for overall participants in TWS
The histogram shows the distribution of IATEs for employment earnings. The distribution curve is asymmetric. The histogram highlights negative values below 0 (29.92%) and positive values above 0 (70.08%). Over two thirds of the program participants in TWS (70.08%) increased their employment earnings following participation in the program.
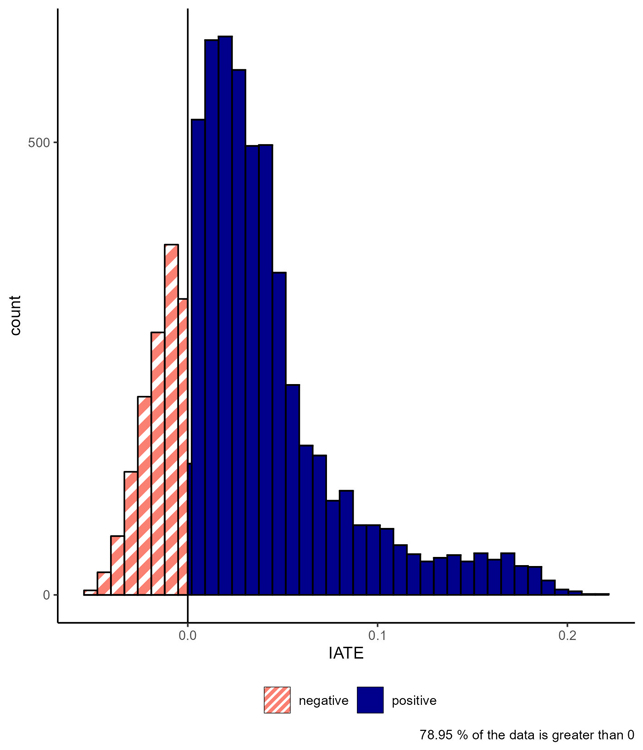
Figure B1.2.2 -Text version
Distribution of individual average treatment effects for incidence of employment for overall participants in TWS
The histogram shows the distribution of IATEs for the incidence of employment. The distribution curve is asymmetric. It has a mostly positive skew and longer right tail. The histogram highlights negative values below 0 (21.05%) and positive values above 0 (78.95%). Most of the program participants in TWS (78.95%) increased their incidence of employment following participation in the program.

Figure B1.2.3 - Text version
Distribution of individual average treatment effects for dependence on income support for overall participants in TWS
The histogram shows the distribution of IATEs for dependence on income support. The distribution curve is asymmetric. The histogram highlights negative values below 0 (43.63%) and positive values above 0 (56.37%). Following participation in the program, 43.63% of participants in TWS (below 0) decreased their dependence on income support.
B2. Individualized average treatment effect for former participants
Overall impact of SD on former participants:
- 80% of participants increased their incidence of employment
- 62% of participants increased their employment earnings
- 48% of participants decreased their dependence on income support
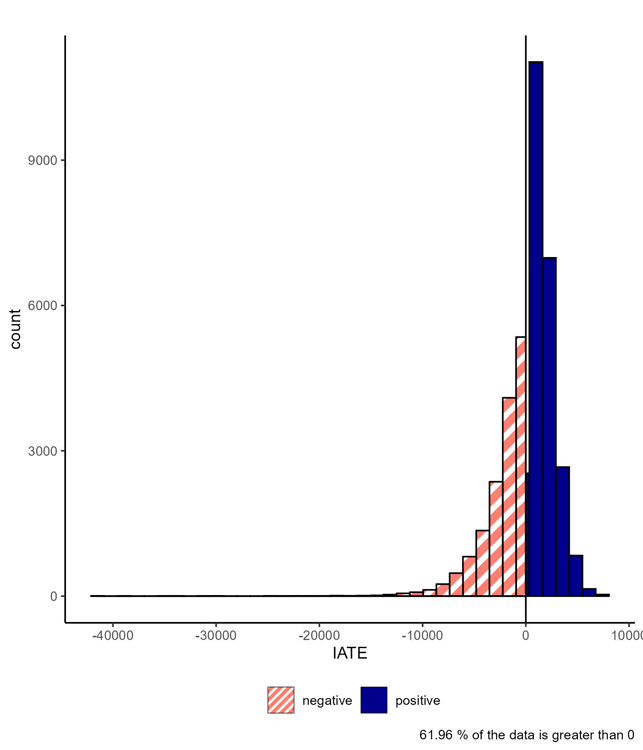
Figure B2.1.1 -Text version
Distribution of individual average treatment effects for employment earnings for overall former participants in SD
The histogram shows the distribution of IATEs for employment earnings. The distribution curve is asymmetric. The histogram highlights negative values below 0 (38.04%) and positive values above 0 (61.96%). More than half of the former program participants in SD (61.96%) increased their employment earnings following participation in the program.
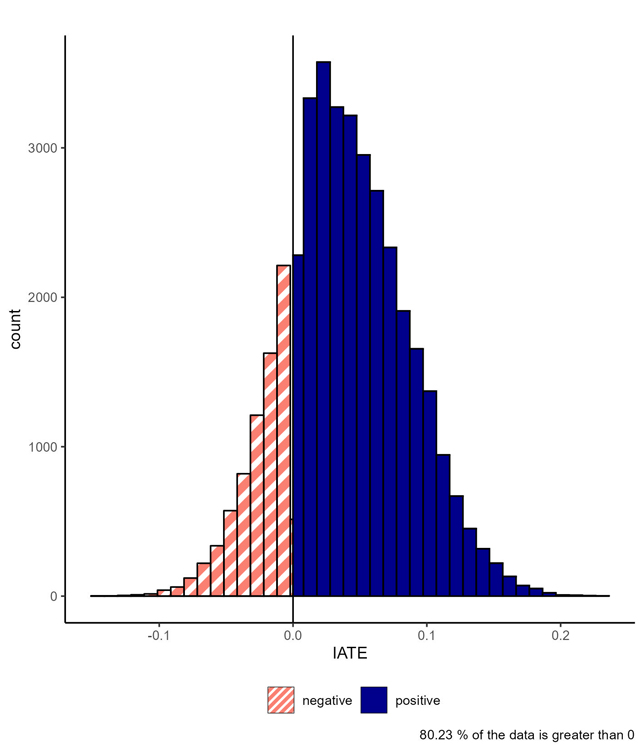
Figure B2.1.2 -Text version
Distribution of individual average treatment effects for incidence of employment for overall former participants in SD
The histogram shows the distribution of IATEs for the incidence of employment. The distribution curve is almost symmetric. It has a mostly positive skew and longer right tail. The histogram highlights negative values below 0 (19.77%) and positive values above 0 (80.23%). Most of the former program participants in SD (80.23%) increased their incidence of employment following participation in the program.

Figure B2.1.3 -Text version
Distribution of individual average treatment effects for dependence on income support for overall former participants in SD
The histogram shows the distribution of IATEs for dependence on income support. The distribution curve is asymmetric. The histogram highlights negative values below 0 (47.95%) and positive values above 0 (52.05%). Following participation in the program, 47.95% of former participants in SD (below 0) decreased their dependence on income support.
The overall impact of TWS on former participants:
- 93% of participants increased their incidence of employment
- 95% of participants increased their employment earnings
- 95% of participants decreased their dependence on income support

Figure B2.2.1 -Text version
Distribution of individual average treatment effects for employment earnings for overall former participants in TWS
The histogram shows the distribution of IATEs for employment earnings. The distribution curve is almost normal around the average. The histogram highlights negative values below 0 (5.00%) and positive values above 0 (95.00%). Most of the former program participants in TWS (95.00%) increased their employment earnings following participation in the program.

Figure B2.2.2 -Text version
Distribution of individual average treatment effects for incidence of employment for overall former participants in TWS
The histogram shows the distribution of IATEs for the incidence of employment. The distribution curve is binormal. It has a mostly positive skew and longer right tail. The histogram highlights negative values below 0 (6.77%) and positive values above 0 (93.23%). Most of the former program participants in TWS (93.23%) increased their incidence of employment following participation in the program.
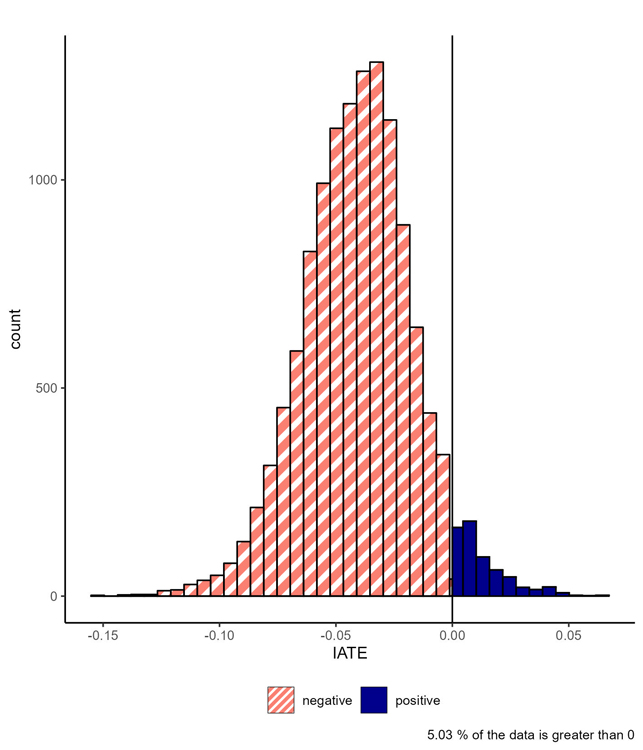
Figure B2.2.3 -Text version
Distribution of individual average treatment effects for dependence on income support for overall former participants in TWS
The histogram shows the distribution of IATEs for dependence on income support. The distribution curve is almost normal. It has a mostly negative skew and longer left tail. The histogram highlights negative values below 0 (94.97%) and positive values above 0 (5.03%). Following participation in the program, 94.97% of former participants in TWS (below 0) decreased their dependence on income support.
B3. Individualized average treatment effect for participants in the OFPD
Overall impact of SD or TWS interventions participants:
- 89% of participants increased their incidence of employment
- 84% of participants increased their employment earnings
- 48% of participants decreased their dependence on income support

Figure B3.1.1 -Text version
Distribution of individual average treatment effects for employment earnings for overall participants in either SD or TWS
The histogram shows the distribution of IATEs for employment earnings. The distribution curve is asymmetric. The histogram highlights negative values below 0 (16.42%) and positive values above 0 (83.58%). Most of the program participants in OFPD (83.58%) increased their employment earnings following participation in the program.
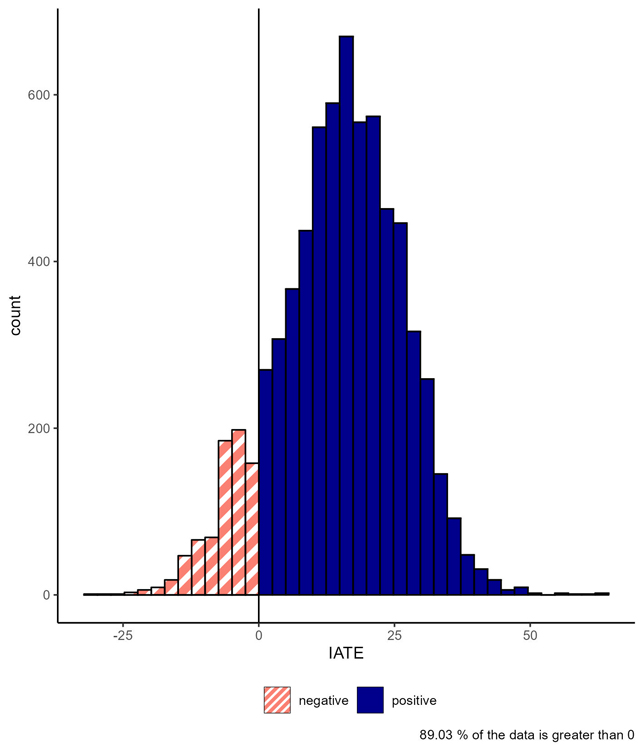
Figure B3.1.2 -Text version
Distribution of individual average treatment effects for incidence of employment for overall participants in either SD or TWS
The histogram shows the distribution of IATEs for the incidence of employment. The distribution curve is almost normal around the average. The histogram highlights negative values below 0 (10.97%) and positive values above 0 (89.03%). Most of the program participants in OFPD (89.03%) increased their incidence of employment following participation in the program.

Figure B3.1.3 -Text version
Distribution of individual average treatment effects for dependence on income support for overall participants in either SD or TWS
The histogram shows the distribution of IATEs for dependence on income support. The distribution curve is almost normal and centred around 0. The histogram highlights negative values below 0 (48.24%) and positive values above 0 (51.76%). Following participation in the program, 48.24% of participants in OFPD (below 0) decreased their dependence on income support.
Annex C: Socio-demographic and labour market characteristics of active EI claimants who were recent immigrant participants in TWS
Tables 2 to 6 present the socio-demographic and labour market characteristics of active EI claimants who were recent immigrant participants in TWS.
| Age | Female | Male |
|---|---|---|
| 30 years and under | 23% | 8% |
| 31 to 54 years | 72% | 88% |
| 55 years and over | 5% | 4% |
| Socio-demographic group | Female | Male |
|---|---|---|
| Indigenous individual | 0% | 2% |
| Person with disability | 1% | 3% |
| Visible minority | 16% | 18% |
| Marital status | Female | Male |
|---|---|---|
| Married or common-law | 67% | 77% |
| Widow / divorced or separated | 15% | 9% |
| Single | 16% | 13% |
| Education level related to National Occupation Code (2nd Digit) associated with the last EI claim opened before participation in 2011 | Female | Male |
|---|---|---|
| University Degree | 14% | 10% |
| College, vocational education or apprenticeship training | 30% | 45% |
| High School or occupational training | 31% | 25% |
| On-the-job training | 20% | 14% |
| Industry based on the North American Industry Classification System (second digit) associated with the last EI claim opened before participation | Female | Male |
|---|---|---|
| Agriculture, forestry, fishing and hunting | 4% | 2% |
| Mining, quarrying, and oil and gas extraction | 0% | 0% |
| Utilities | 0% | 1% |
| Construction | 3% | 10% |
| Manufacturing | 8% | 18% |
| Wholesale trade | 7% | 8% |
| Retail trade | 5% | 5% |
| Transportation and warehousing | 5% | 3% |
| Information and cultural industries | 4% | 3% |
| Finance and insurance | 4% | 2% |
| Real estate and rental and leasing | 2% | 1% |
| Professional, scientific and technical services | 11% | 7% |
| Management of companies and enterprises | 2% | 0% |
| Administrative and support, waste management and remediation services | 11% | 17% |
| Educational services | 8% | 3% |
| Health care and social assistance | 9% | 2% |
| Arts, entertainment and recreation | 3% | 0% |
| Accommodation and food services | 5% | 5% |
| Other services (except public administration) | 5% | 6% |
| Public administration | 1% | 2% |
Annex D: Intersectionality tables
Tables 7 to 14 present the number of active EI participants that started an action plan equivalent under LMDA between 2011 and 2012.The tables provide these numbers by sex and by other intersecting identity factors and by APE type.
| Intersectionality factors | SD: Female | SD: Male | TWS: Female | TWS: Male |
|---|---|---|---|---|
| 30 years and under | 12,154 | 18,073 | 993 | 1,325 |
| 31 to 54 years | 23,953 | 23,103 | 2,840 | 2,833 |
| 55 years and over | 2,921 | 2,870 | 678 | 840 |
| Indigenous individual | 1,628 | 2,451 | 187 | 236 |
| Person with disability | 1,734 | 1,658 | 496 | 753 |
| Visible minority | 1,417 | 1,591 | 144 | 152 |
| Recent Immigrant | 1,542 | 1,968 | 133 | 146 |
| Participants who were 30 years old or younger | SD: Female | SD: Male | TWS: Female | TWS: Male |
|---|---|---|---|---|
| Indigenous individual | 551 | 911 | 44 | 87 |
| Person with disability | 409 | 479 | 67 | 143 |
| Visible minority | 271 | 397 | 34 | 30 |
| Recent Immigrant | 304 | 331 | 31 | 12 |
| Participants who were 31-54 years old | SD: Female | SD: Male | TWS: Female | TWS: Male |
|---|---|---|---|---|
| Indigenous individual | 985 | 1,410 | 127 | 132 |
| Person with disability | 1,163 | 1,034 | 339 | 470 |
| Visible minority | 1,036 | 1,068 | 94 | 102 |
| Recent Immigrant | 1,203 | 1,583 | 96 | 128 |
| Participants who were over 54 years | SD: Female | SD: Male | TWS: Female | TWS: Male |
|---|---|---|---|---|
| Indigenous individual | 92 | 129 | 16 | 17 |
| Person with disability | 162 | 145 | 90 | 140 |
| Visible minority | 110 | 126 | 16 | 20 |
| Recent Immigrant | 35 | 54 | 6 | 6 |
| Participants who were Indigenous | SD: Female | SD: Male | TWS: Female | TWS: Male |
|---|---|---|---|---|
| 30 years and under | 551 | 911 | 44 | 87 |
| 31 to 54 years | 985 | 1,410 | 127 | 132 |
| 55 years and over | 92 | 129 | 16 | 17 |
| Person with disability | 144 | 148 | 25 | 28 |
| Visible minority | 129 | 187 | 10 | 19 |
| Recent Immigrant | n/a | n/a | n/a | n/a |
| Participants who were persons with disabilities | SD: Female | SD: Male | TWS: Female | TWS: Male |
|---|---|---|---|---|
| 30 years and under | 409 | 479 | 67 | 143 |
| 31 to 54 years | 1,163 | 1,034 | 339 | 470 |
| 55 years and over | 162 | 145 | 90 | 140 |
| Indigenous individual | 144 | 148 | 25 | 28 |
| Visible minority | 78 | 70 | 11 | 15 |
| Recent Immigrant | 16 | 14 | 1 | 5 |
| Participants who were visible minorities | SD: Female | SD: Male | TWS: Female | TWS: Male |
|---|---|---|---|---|
| 30 years and under | 271 | 397 | 34 | 30 |
| 31 to 54 years | 1,036 | 1,068 | 94 | 102 |
| 55 years and over | 110 | 126 | 16 | 20 |
| Indigenous individual | 129 | 187 | 10 | 19 |
| Person with disability | 78 | 70 | 11 | 15 |
| Recent Immigrant | 229 | 262 | 21 | 27 |
| Participants who were recent immigrants | SD: Female | SD: Male | TWS: Female | TWS: Male |
|---|---|---|---|---|
| 30 years and under | 304 | 331 | 31 | 12 |
| 31 to 54 years | 1,203 | 1,583 | 96 | 128 |
| 55 years and over | 35 | 54 | 6 | 6 |
| Indigenous individual | n/a | n/a | n/a | n/a |
| Person with disability | 16 | 14 | 1 | 5 |
| Visible minority | 229 | 262 | 21 | 27 |
Tables 15 to 22 present the number of former participants that started an action plan equivalent under LMDA between 2011 and 2012. The tables provide these numbers by sex and other intersecting identify factors, as well as by APE type.
| Intersectionality factors | SD: Female | SD: Male | TWS: Female | TWS: Male |
|---|---|---|---|---|
| 30 years and under | 7,995 | 8,288 | 1,745 | 2,376 |
| 31 to 54 years | 13,123 | 10,563 | 3,830 | 4,172 |
| 55 years and over | 1,432 | 1,429 | 747 | 954 |
| Indigenous individual | 1,384 | 2,128 | 289 | 403 |
| Person with disability | 1,143 | 1,157 | 717 | 1,112 |
| Visible minority | 1,194 | 1,108 | 227 | 189 |
| Recent Immigrant | 1,239 | 926 | 164 | 172 |
| Former participants who were 30 years old or younger | SD: Female | SD: Male | TWS: Female | TWS: Male |
|---|---|---|---|---|
| Indigenous individual | 546 | 785 | 73 | 152 |
| Person with disability | 310 | 329 | 140 | 261 |
| Visible minority | 244 | 242 | 51 | 44 |
| Recent Immigrant | 294 | 148 | 52 | 25 |
| Former participants who were 31 to 54 years old | SD: Female | SD: Male | TWS: Female | TWS: Male |
|---|---|---|---|---|
| Indigenous individual | 760 | 1,234 | 188 | 225 |
| Person with disability | 718 | 727 | 474 | 668 |
| Visible minority | 883 | 756 | 160 | 127 |
| Recent Immigrant | 929 | 743 | 109 | 140 |
| Former participants who were over 54 years | SD: Female | SD: Male | TWS: Female | TWS: Male |
|---|---|---|---|---|
| Indigenous individual | 78 | 109 | 28 | 26 |
| Person with disability | 115 | 101 | 103 | 183 |
| Visible minority | 66 | 110 | 16 | 18 |
| Recent Immigrant | 15 | 35 | 3 | 7 |
| Former participants who were Indigenous | SD: Female | SD: Male | TWS: Female | TWS: Male |
|---|---|---|---|---|
| 30 years and under | 546 | 785 | 73 | 152 |
| 31 to 54 years | 760 | 1,234 | 188 | 225 |
| 55 years and over | 78 | 109 | 28 | 26 |
| Person with disability | 123 | 163 | 35 | 36 |
| Visible minority | 121 | 163 | 11 | 28 |
| Recent Immigrant | n/a | n/a | n/a | n/a |
| Former participants who were persons with disabilities | SD: Female | SD: Male | TWS: Female | TWS: Male |
|---|---|---|---|---|
| 30 years and under | 310 | 329 | 140 | 261 |
| 31 to 54 years | 718 | 727 | 474 | 668 |
| 55 years and over | 115 | 101 | 103 | 183 |
| Indigenous individual | 123 | 163 | 35 | 36 |
| Visible minority | 67 | 57 | 22 | 10 |
| Recent Immigrant | 11 | 7 | 4 | 2 |
| Former participants who were visible minorities | SD: Female | SD: Male | TWS: Female | TWS: Male |
|---|---|---|---|---|
| 30 years and under | 244 | 242 | 51 | 44 |
| 31 to 54 years | 883 | 756 | 160 | 127 |
| 55 years and over | 66 | 110 | 16 | 18 |
| Indigenous individual | 121 | 163 | 11 | 28 |
| Person with disability | 67 | 57 | 22 | 10 |
| Recent Immigrant | 153 | 115 | 23 | 17 |
| Former participants who were recent immigrants | SD: Female | SD: Male | TWS: Female | TWS: Male |
|---|---|---|---|---|
| 30 years and under | 294 | 148 | 52 | 25 |
| 31 to 54 years | 929 | 743 | 109 | 140 |
| 55 years and over | 15 | 35 | 3 | 7 |
| Indigenous individual | - | - | - | - |
| Person with disability | 11 | 7 | 4 | 2 |
| Visible minority | 153 | 115 | 23 | 17 |
Table 23 presents the number of participants that started an action plan equivalent under the Opportunity Fund between 2011 and 2012. The table provides this information by sex and other intersecting identity factors, as well as by APE type.
| Intersecting identity factors | Female | Male |
|---|---|---|
| 30 years old or younger | 1,851 | 1,258 |
| 31 to 54 years | 2,114 | 2,220 |
| 55 years old or older | 501 | 449 |
| Visible minority | 387 | 346 |
| Mental disability | 1019 | 1057 |
| Indigenous | 244 | 205 |
Page details
- Date modified: