
Evaluation of the Canada Apprentice Loan - Phase 2
From: Employment and Social Development Canada
On this page
- List of figures
- List of tables
- List of acronyms and abbreviations
- Introduction
- Key findings
- Conclusions
- Management response and Action plan
- Consideration #1
- Annex A: Evaluation questions and Lines of evidence
- Annex B: Evaluation approach
- Annex C: Description of the program
- Annex D: Logic model
- Annex E: Additional figures and tables
Alternate formats

List of figures
- Figure 1: During your technical training period, how easy or difficult was it to make ends meet financially?
- Figure 2: Proportion of Apprentices who had difficulty making ends meet during technical training
- Figure 3: Level of importance of the loan in covering the costs of apprenticeship by subgroup (N=1,083)
- Figure 4: Proportion of recipients that used the loan toward these specifics items (N=1,083)
- Figure 5: Awareness level of the Canada Apprentice Loan before becoming an apprentice (N=1,525)
- Figure 6: Apprentices first heard about the Canada Apprentice Loan from these promotional elements
- Figure 7: Apprentices received information about the Canada Apprentice Loan from the following sources
- Figure 8: Estimated take-up rate for Canada Apprentice Loan by gender
- Figure 9: Stage during the apprenticeship when loan recipients first applied (N=1,111)
- Figure 10: Level of satisfaction with service delivery by sub-groups (N=1,111)
- Figure 11: Level of satisfaction with the timeliness of the loan (the time from application to receipt). (N=1,083)
- Figure 12: Proportion of apprentices using other financial supports by sub-group (N=1,825)
- Figure 13: Proportion of loan recipients receiving support from other Federal support measures for apprentices
- Figure 14: Proportion of apprentices paid by employer during technical training by selected group (N=1,825)
- Figure 15: Total amount of debt by top 10 Red Seal trades group
- Figure 16: Status of the loan for all the recipients at the end of calendar year 2017
- Figure 17: Proportion of loan recipients who have completed the apprenticeship program and are aware of the Repayment Assistance Program and using the Repayment Assistance Program (N=589)
- Figure 18: Proportion of recipients in repayment using the Repayment Assistance Program
- Figure 19: Proportion of apprentices who had difficulty making ends meet during technical training
- Figure 20: How important does knowing about the Canada Apprentice Loan contribute to your decision to become an Apprentice? (N=564)
- Figure 21: Estimated take-up rate for Canada Apprentice Loan by province
- Figure 22: Proportion of loan recipients receiving support from other Federal support measures for apprentices by trade groups
- Figure 23: Does the employer pay full wage, partial wage of other type of payment by selected group (N=198)
- Figure 24: Proportion of recipients indicating that the loan was important in helping them covering the cost of the apprenticeship training by trade groups (N=1,083)
- Figure 25: Use of Canada Apprentice Loan by trade (N=1,083)
- Figure 26: Total amount of debt by gender
- Figure 27: Level of satisfaction of Canada Apprentice Loan recipients with service delivery by education level (N=1,111)
- Figure 28: Timeliness of the loan by region (the time from application to receipt). (N=1,083)
- Figure 29: Percentage of Recipients in Repayment by status of their apprenticeship (N=1,083)
- Figure 30: Stage at which recipients start repaying their loan (N=354)
- Figure 31: Proportion of loan recipients in repayment using the Repayment Assistance Program
- Figure 32: Proportion of recipients that used the loan toward these specifics items (N=1,083)
List of tables
- Table 1: Advantages of completing an apprenticeship
- Table 2: Comparing loan recipients and non-recipients: apprentice’s views on their needs during the apprenticeship period
- Table 3: Estimates from a probit model with completion as the dependent variable
- Table 4: Canada Apprentice Loans by calendar year
- Table 5: Thinking more generally about your experience, what else could governments do to help support apprentices during their training?
- Table 6: Average number of loans taken by different groups of recipients
- Table 7: Estimates from a probit model with completion as the dependent variable by gender
- Table 8: Estimates from a nearest-neighbour matching model with completion as the dependent variable
List of acronyms and abbreviations
- AIG:
- Apprenticeship Incentive Grant
- ACG:
- Apprenticeship Completion Grant
- CAL:
- Canada Apprentice Loan
- CR:
- Core Responsibility
- DRF:
- Departmental Results Framework
- EI:
- Employment Insurance
- ESDC:
- Employment and Social Development Canada
- PRA:
- Prairie Research Associates
- RAIS:
- Registered Apprenticeship Information System
- RS:
- Results Statements
Introduction
This report constitutes Phase II of the Evaluation of the Canada Apprentice Loan. Phase I was completed in 2017 and covered program relevance, the use of the loans, administrative costs, and program delivery and awareness. Phase II expands on additional questions about loan repayment and the impact of the loan on completing an apprenticeship.
This evaluation uses an impact analysis method to estimate the contribution of the loans on the completion of an apprenticeship. Due to omitted variable bias, impacts of the program were reported as contributions. For more details about this study please see the methodology and limitations section in Annex B.
The evaluation covers calendar years 2015 to 2019Footnote 1 and complies with the Financial Administration Act and the 2016 Treasury Board Policy on Results.Footnote 2
Key evaluation findingsFootnote 3
- The loan contributes to completion of training
- There is a need for the Canada Apprentice Loan given that most apprentices continue to have difficulty making ends meet during technical training
- The Canada Apprentice Loan responds to the need of various sub-populations
- A higher than average proportion of women, Indigenous recipients, recipients with a disability and older recipients surveyed indicated that the loans were important or very important in covering the costs of training and other related expenses.
- Approximately one-third (37%) of apprentices surveyed are aware of the loan prior to registering
- Of this 37%, one-third (39%) feel that knowing about the loan is an important part of their decision making to participate in an apprenticeship program. Most awareness about the program occurs after registering into a trade school.
- The take up rate has been relatively stable since inception of the program
- During the period between 2015 and 2017, approximately one-third of the eligible population used the loan. The average take-up rate of the Canada Apprentice Loan over this period was 31.6% with a slightly higher rate for women (33.1%)Footnote 4
- A majority of the recipients surveyed are satisfied with the application process (78.6%) and the timeliness (82%) of the loan
- This is consistent with the findings from Phase 1.
- Between 2015 and 2017, 74.1% of the loan recipients were also using both Apprenticeship Grants and Employment Insurance benefits
- During the same period, only 4% of the loan recipients were using the loan as their sole source of federal financial support.
- On average, an apprentice has $5,534 of debt during training
- A large majority (81.5%) started repaying before the end of their first year of training.
- In general, about 10% of recipients start repaying their loan before completing their training
- A small percentage of borrowers in repayment (1.7%) are using the Repayment Assistance Program. This could be due to a low level of awareness about the Repayment Assistance Program.
Recommendation
The program should focus on increasing awareness of the loans among underrepresented groups. Both in terms of promoting the program and in terms of providing clarity about its principal features so more apprentices that are in need can benefit.
Consideration
The Canada Apprenticeship Loan is only one part of a broader suite of federal support measures for apprenticeships. The Department should consider how the loan links into a broader Apprenticeship Strategy.
Program background
The Canada Apprentice Loan was launched in 2015. It offers interest-free loans of up to $4,000 per period of technical training (minimum request of $500). In loan year 2015 to 2016, a total of 16,429 apprentices borrowed from the Canada Apprentice Loan, leading to disbursements totaling $69.4 million.Footnote 5
The lifetime maximum loan amount is set to $20,000 and/or a maximum of 5 periods of technical training. The program was designed to help registered Red Seal apprentices:
- cover the costs related to their apprenticeship
- to assist more apprentices in completing their trainingFootnote 6
The Canada Apprentice Loan builds on other federal government measures that aim to financially support individual apprentices:Footnote 7
Employment Insurance
- Individuals referred by their province or territory to attend full-time technical training (sometimes referred to as block-release training) may be eligible to receive Employment Insurance benefits
- This can only occur while they are unemployed and attending the training.
Apprenticeship Grants
- The Apprenticeship Grants are comprised of the Apprenticeship Incentive Grant, the Apprenticeship Completion Grant and the Apprenticeship Incentive Grant for Women
- They allow apprentices to receive up to $4,000 in lifetime grants to pay for tuition, travel, tools, or other expenses up to $8,000 in grants for apprentices who are women.
Tax deductions
Tax deductions and credits for supporting apprentices and tradespersons including:
- the Tradesperson’s Tools deduction
- the Tuition Tax CreditFootnote 8 and
- the Education Tax Credit
Role of government in apprenticeship
In 2015:
- Canadians working in the skilled trades: 4,000,000Footnote 9
- estimated percentage of employed Canadians who worked in a skilled trade: 22.1%Footnote 10
- percentage of Red Seal apprentices who were women: 9%
- the percentage of women who were apprentices when more "traditional" trades such as baker and hairstylist are removed: 5%Footnote 11
Completing an apprenticeship program can be a challenge for apprentices and it can also vary significantly across jurisdictions and trades. Table 1 below demonstrates that apprentices who completed their programs are more likely to find employment and have, on average, higher earnings.Footnote 12
Table 1: Advantages of completing an apprenticeship
| Apprentice Characteristic | Completers | Discontinuers |
|---|---|---|
| Have a permanent job | 80.8% | 77% |
| Average Annual Income | $69,512 | $59,782 |
Key findings
Need for the loan
Both Canada Apprentice Loan recipients and non-recipients indicate that there is a need for the loan given the high cost of technical training and the overall apprenticeships costs.
Figure 1 shows that close to half of the apprentices surveyed (48.1%) said it was difficult or very difficult to make ends meet during the technical training period.
The proportion of apprentices who had difficulties making ends meet during the technical training period is higher among loan recipients (52.6%) compared to the non-recipients (42.5%).
This suggests that there is a need for the Canada Apprentice Loan.

Text description of Figure 1
| During your technical training period, how easy or difficult was it to make ends meet financially? | Total (N=1,825) | Used Canada Apprentice Loan (N=1,011) | No Canada Apprentice Loan (N=814) |
|---|---|---|---|
| Very difficult | 12.2% | 14.7% | 13.6% |
| Difficult | 30.3% | 37.9% | 34.5% |
| Neither easy nor difficult | 31.0% | 32.9% | 32.1% |
| Easy | 21.9% | 11.7% | 16.2% |
| Very easy | 4.7% | 2.5% | 3.4% |
| Don't know / No response | 0.1% | 0.1% | 0.1% |
| Total | 100.0% | 100.0% | 100.0% |
- Source of information: ESDC-PRA Inc. Survey of Canada Apprentice Loan recipients and eligible non-recipients 2019
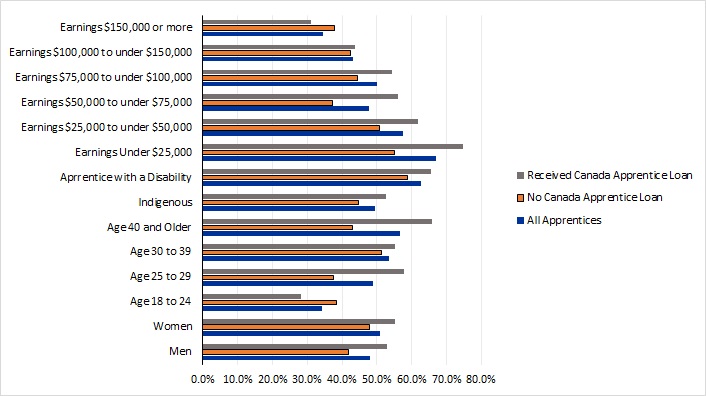
There are variations in terms of difficulties making ends meet, showing that some groups have more of a need for the Canada Apprentice Loan than others. Figure 2 indicates certain groups were more likely to say that they had difficulties making ends meet.
This includes women (51%), apprentices 40 years and older (56.6%), apprentices with a disability (62.7%) and those apprentices with lower annual earnings (66.9%).
A larger proportion of loan recipients indicated that they have difficulties making ends meet compared to eligible non-recipients.
The exceptions are those recipients earning more than $150,000 and those between 18 and 24 years old.
As shown in Figure 19 in Annex E, other groups of apprentices were also more likely to say that they had difficulties making ends meet.
These include industrial electricians (60.8%), welders (59.4%), plumbers (57.1%) and apprentices being trained in more than one trade (60.9%).Footnote 13
Text description of Figure 2
| Apprentice groups | All apprentices | No Canada Apprentice Loan | Received Canada Apprentice Loan |
|---|---|---|---|
| Men | 48% | 41.9% | 52.8% |
| Women | 51% | 47.7% | 55.1% |
| Age 18 to 24 | 34.1% | 38.3% | 28.3% |
| Age 25 to 29 | 49.0% | 37.5% | 57.7% |
| Age 30 to 39 | 53.5% | 51.3% | 55.2% |
| Age 40 and older | 56.6% | 43.0% | 65.8% |
| Indigenous | 49.5% | 44.6% | 52.7% |
| Apprentice with a disability | 62.7% | 58.7% | 65.6% |
| Earnings Under $25,000 | 66.9% | 55.1% | 74.7% |
| Earnings $25,000 to under $50,000 | 57.4% | 50.9% | 61.8% |
| Earnings $50,000 to under $75,000 | 47.7% | 37.3% | 56.0% |
| Earnings $75,000 to under $100,000 | 50.0% | 44.3% | 54.4% |
| Earnings $100,000 to under $150,000 | 43.1% | 42.3% | 43.8% |
| Earnings $150,000 or more | 34.5% | 37.7% | 31.2% |
- Source of information: ESDC-PRA Inc. Survey of Canada Apprentice Loan recipients and eligible non-recipients 2019
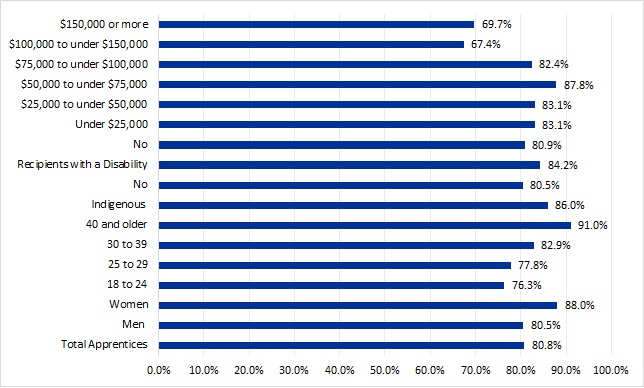
The Canada Apprentice Loan contributes to covering the costs of training and other expenses for most recipients (80.8%). A larger contribution was observed for vulnerable groups.
Figure 3 shows 80.8% of the recipients surveyed indicated that the loans were important or very important in covering the costs of training and other related expenses.
This proportion is higher among:
- women (88%)
- older apprentices (91%)
- Indigenous (86%)
- recipients with a disability (84.2%)
- those earnings less than $75,000 annually (87.8%)
Text description of Figure 3
| Apprentice groups | Percentage |
|---|---|
| Total Apprentices | 80.8% |
| Men | 80.5% |
| Women | 88% |
| 18 to 24 | 76.3% |
| 25 to 29 | 77.8% |
| 30 to 39 | 82.9% |
| 40 and older | 91% |
| Indigenous | 86% |
| No | 80.5% |
| Recipients with a Disability | 84.2% |
| No | 80.9% |
| Under $25,000 | 83.1% |
| $25,000 to under $50,000 | 83.1% |
| $50,000 to under $75,000 | 87.8% |
| $75,000 to under $100,000 | 82.4% |
| $100,000 to under $150,000 | 67.4% |
| $150,000 or more | 69.7% |
- Source of information: ESDC-PRA Inc. Survey of Canada Apprentice Loan recipients and eligible non-recipients 2019
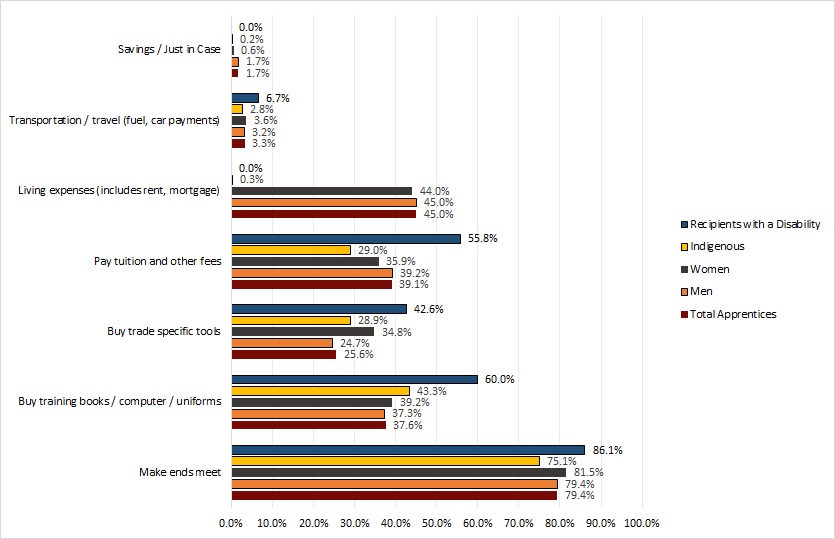
Approximately three quarters (79.4%) of recipients surveyed used the Canada Apprenticeship Loan to make ends meet.
- Figure 4 indicates that 39.1% of recipients used the Canada Apprentice Loan to pay tuition and other fees
- Apprentices also used Canada Apprentice Loans to pay for training items such as books, computer or uniforms (37.6%) and to buy tools (25.6%).
- A higher proportion of lower income recipients and recipients with a disability used the Canada Apprentice Loan to pay for tuition and other fees, buy tools or buy books, computer or uniforms specific for training. See Figure 32 in Annex E for full table including income information
- Loans are used differently by different trade groups
- For example, welders (92.9%), steamfitters/pipefitters (92.4%), recipients with a disability (86.1%), those earning less than $75,000 annually (82%) and women (81.5%) are the most likely to report using the Canada Apprentice Loan to make ends meets as indicated by Figure 25 in Annex E.
- This is likely due to the different nature of the work and differences in income
Text description of Figure 4
| Apprentice group | Make ends meet | Buy training books / computer / uniforms | Buy trade specific tools | Pay tuition and other fees | Living expenses (includes rent, mortgage) | Transportation / travel (fuel, car payments) | Savings / Just in Case |
|---|---|---|---|---|---|---|---|
| Total apprentices | 79.4% | 37.6% | 25.6% | 39.1% | 45.0% | 3.3% | 1.7% |
| Men | 79.4% | 37.3% | 24.7% | 39.2% | 45.0% | 3.2% | 1.7% |
| Women | 81.5% | 39.2% | 34.8% | 35.9% | 44.0% | 3.6% | 0.6% |
| Indigenous | 75.1% | 43.3% | 28.9% | 29.0% | 0.3% | 2.8% | 0.2% |
| Recipients with a Disability | 86.1% | 60.0% | 42.6% | 55.8% | 0.0% | 6.7% | 0.0% |
- Source of information: ESDC-PRA Inc. Survey of Canada Apprentice Loan recipients and eligible non-recipients 2019
Awareness
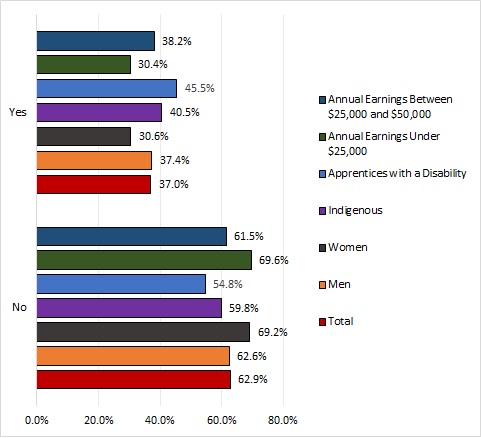
Approximately one-third (37%) of apprentices are aware of the loan prior to registering as indicated by Figure 5.
Figure 5 indicates that level of awareness of the loan is lower for women (30.6%) and for apprentices earning less than $25,000 per year (30.4%). This is a low rate of awareness. Considering one-third feel that knowing about the loan is an important part of their deciding to become an apprentice.
For those who are aware of the loan, Figure 20 in Annex E shows that for 39% of apprentices, knowing about the Canada Apprentice Loan was an important factor (17.4%) or very important factor (21.6%) contributing to the decision to register for apprenticeship training. This proportion is even higher for women (47%) Indigenous apprentices (64.9%), apprentices with a disability (62.5%) and those with annual earnings under $25,000 (59.6%).
One-third of the apprentices who did not apply for a Canada Apprentice Loan (38.2%) mentioned that awareness was a problem for them. This proportion is even higher for women (52.4%), Indigenous apprentices (49.6%) and apprentices with a disability (49.2%).
The level of awareness is lower for women (30.6%) compared to men (37.4%).
Text description of Figure 5
| Apprentice group | No | Yes |
|---|---|---|
| Total | 62.9% | 37.0% |
| Men | 62.6% | 37.4% |
| Women | 69.2% | 30.6% |
| Indigenous | 59.8% | 40.5% |
| Apprentices with a Disability | 54.8% | 45.5% |
| Annual Earnings Under $25,000 | 69.6% | 30.4% |
| Annual Earnings Between $25,000 and $50,000 | 61.5% | 38.2% |
- Source of information: ESDC-PRA Inc. Survey of Canada Apprentice Loan recipients and eligible non-recipients 2019
Most of the awareness about the program is achieved in class or at school and not prior to the program.
Figure 6 indicates that 60% of the apprentices who were aware of the Canada Apprentice Loan before taking the Evaluation survey were informed of the loan either in:
- class (44.6%)
- via a classmate (9.8%)
- by the teacher (5.6%)
This means that awareness of the loan is mostly occurring after registering for the training.

Text description of Figure 6
| Where apprentices first heard about CAL program | Total (N=1,527) | Men (N=1,420) | Women (N=86) |
|---|---|---|---|
| Friend or relative | 5.5% | 5.4% | 4.4% |
| Government information | 2.2% | 2.2% | 2.3% |
| Union representative | 2.5% | 2.5% | 1.2% |
| Classmates | 9.7% | 9.7% | 9.8% |
| Employer | 1.7% | 1.6% | 2.1% |
| Welcome package | 4.7% | 4.8% | 5.0% |
| Apprenticeship office | 3.7% | 3.6% | 3.7% |
| At School/in class | 47.1% | 47.4% | 44.6% |
| At work/Coworkers | 4.3% | 4.2% | 5.9% |
| When I registered | 2.2% | 2.3% | 1.9% |
| Online research | 6.4% | 6.2% | 9.1% |
| E-mail or letter | 2.4% | 2.5% | 2.0% |
| Radio/TV/Media Advertisement | 2.9% | 2.8% | 5.6% |
| Teachers/Instructors | 10.0% | 10.3% | 5.6% |
- Source of information: ESDC-PRA Inc. Survey of Canada Apprentice Loan recipients and eligible non-recipients 2019
A large percentage of the loan recipients made a decision to become an apprentice without knowing about the loan. Most of the information about the program is provided during the training from employers or from the schools.Footnote 14
Figure 7 shows that the source of information about the loan varies across regions. For example there is a higher percentage of apprentices in Ontario receiving information from union representatives, employers and welcome packages relative to other regions.
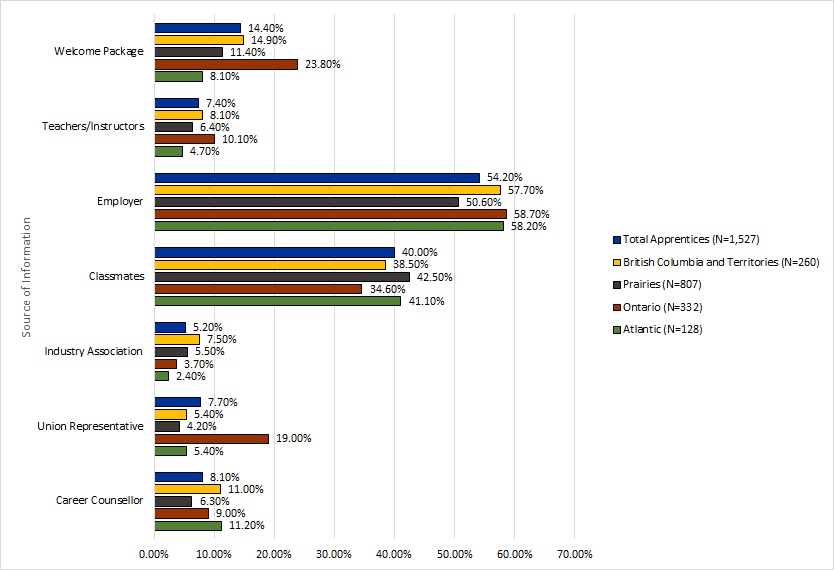
Text description of Figure 7
| Source of information of loan | Atlantic (N=128) | Ontario (N=332) | Prairies (N=807) | British Columbia and Territories (N=260) | Total apprentices (N=1,527) |
|---|---|---|---|---|---|
| Career counsellor | 11.2% | 9.0% | 6.3% | 11.0% | 8.1% |
| Union representative | 5.4% | 19.0% | 4.2% | 5.4% | 7.7% |
| Industry association | 2.4% | 3.7% | 5.5% | 7.5% | 5.2% |
| Classmates | 41.1% | 34.6% | 42.5% | 38.5% | 40.0% |
| Employer | 58.2% | 58.7% | 50.6% | 57.7% | 54.2% |
| Teachers/Instructors | 4.7% | 10.1% | 6.4% | 8.1% | 7.4% |
| Welcome package | 8.1% | 23.8% | 11.4% | 14.9% | 14.4% |
- Source of information: ESDC-PRA Inc. Survey of Canada Apprentice Loan recipients and eligible non-recipients 2019
Take-up
Overall take-up has increased since 2015, but it varies by gender and across jurisdictions.
Figure 8 indicates that other than in 2015, the take-up rate for women is always higher than the one for men. The average take-up rate for women is at 33.1% while the one for men is at 31.5%.
Figure 21 in Annex E also indicated that Alberta and Nova Scotia have the highest take-up rates, averaging 44.9% and 42.8% respectively. However, Ontario, Newfoundland and Labrador both have the lowest take-up rate with an average of 15.6% for both. The take-up rate in Ontario is constantly declining between 2015 and 2017.
A total of 49,550 loans were disbursed to 34,602 apprentices between January 1, 2015 and December 31, 2017.Footnote 15
Most of the loans are disbursed to apprentices registered in Alberta. In terms of trades, most of the loans are disbursed to construction electricians and to other Red Seal trades.
The take-up rate for women is 33.1% overall.
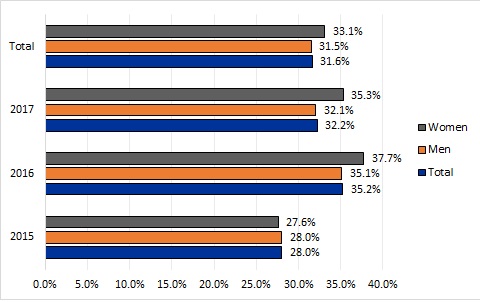
Text description of Figure 8
| Year | Total | Men | Women |
|---|---|---|---|
| 2015 | 28.0% | 28.0% | 27.6% |
| 2016 | 35.2% | 35.1% | 37.7% |
| 2017 | 32.2% | 32.1% | 35.3% |
| Total | 31.6% | 31.5% | 33.1% |
- Source: ESDC, Linked Canada Apprentice Loan, Apprenticeship Grants and Employment Insurance administrative data
Just less than half (42%) of loan recipients obtain their first loan either during the year they registered or 1 year after registration.
The Canada Apprentice Loan allows an apprentice to take up to 5 loans of $4,000 for a maximum lifetime amount of $20,000.
Apprentices obtain on average approximately 2 loans (see Figure 9).
Income is the only factor that impacts on the number of loans taken.
Other demographics as suggested by Table 6 in annex E are not significant factors that contribute to decisions to take loans including:
- gender
- having a disability
- age
This suggests that there is no relationship between sub-groups and the number of loans taken. Although, the number of loans taken decrease significantly when income of the recipient increases.
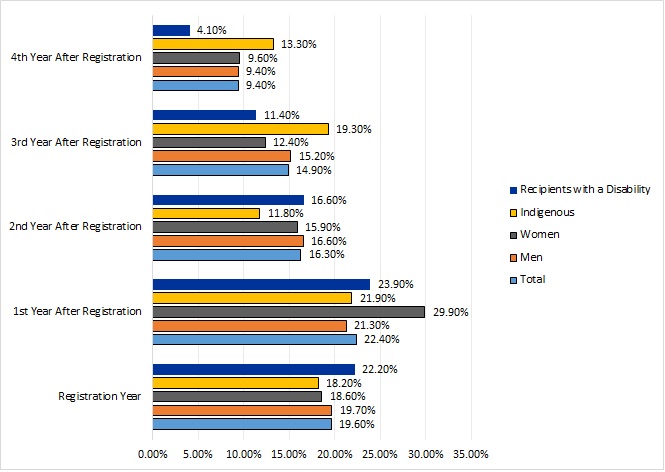
Text description of Figure 9
| Years of apprenticeship | Total | Men | Women | Indigenous | Recipients with a disability |
|---|---|---|---|---|---|
| Registration year | 19.6% | 19.7% | 18.6% | 18.2% | 22.2% |
| 1st year after registration | 22.4% | 21.3% | 29.9% | 21.9% | 23.9% |
| 2nd year after registration | 16.3% | 16.6% | 15.9% | 11.8% | 16.6% |
| 3rd year after registration | 14.9% | 15.2% | 12.4% | 19.3% | 11.4% |
| 4th year after registration | 9.4% | 9.4% | 9.6% | 13.3% | 4.1% |
- Source of information: ESDC-PRA Inc. Survey of Canada Apprentice Loan recipients and eligible non-recipients 2019
Satisfaction levels
Most recipients (78.6%) are satisfied or very satisfied with the application process, with the exception of Indigenous recipients and recipients with a disability.
Figure 10 shows satisfaction with the application process. Indigenous recipients (73%) and recipients with a disability (54.8%) are the least satisfied. Women (86.2%) are the most satisfied with the application process.
Figure 10 also indicates that 73.9% of the recipients are satisfied or very satisfied about the ease of understanding of the program material.
Recipients with a disability (55.2%) appear to be less satisfied with the ease of understanding the loan material while women (85.2%) are more satisfied.
The level of satisfaction with the application process and with the ease of understanding the Canada Apprentice Loan material increases with the level of education (see Figure 27 in Annex E).Footnote 16
Two reasons were given by apprentices who did not apply for a loan:
- 14.2% mentioned being uncomfortable with the idea of having debt
- 39.4% of them did not need a loan
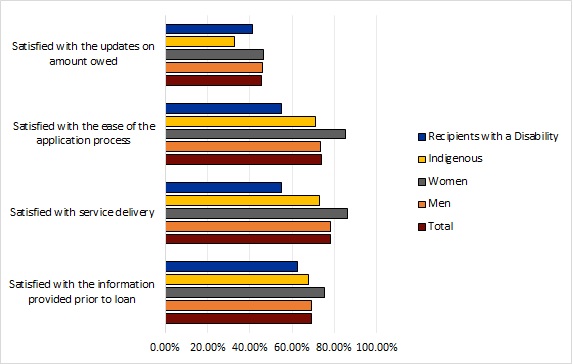
Text description of Figure 10
| Satisfaction level | Total | Men | Women | Indigenous | Recipients with a disability |
|---|---|---|---|---|---|
| Satisfied with the information provided prior to loan | 69.4% | 69.4% | 75.5% | 67.8% | 62.7% |
| Satisfied with service delivery | 78.3% | 78.4% | 86.1% | 73.0% | 54.8% |
| Satisfied with the ease of the application process | 73.9% | 73.6% | 85.2% | 70.9% | 55.2% |
| Satisfied with the updates on amount owed | 45.6% | 45.8% | 46.5% | 32.9% | 41.4% |
- Source of information: ESDC-PRA Inc. Survey of Canada Apprentice Loan recipients and eligible non-recipients 2019
Most loan recipients are satisfied (29.7%) or very satisfied (52.3%) with the timeliness of the loan.Footnote 17
Figure 11 indicates that there are variations in the level of being satisfied with the timeliness of the loan among selected groups. Recipients with a disability and Indigenous recipients appear to be slightly less satisfied with the timeliness of the loan as opposed to other groups.
The geographical variations of level of being satisfied with timeliness can be seen in Figure 28 in Annex E:
- recipients in British Columbia and the Territories (85.2%) are more satisfied
- Ontario (76.2%) are less satisfied
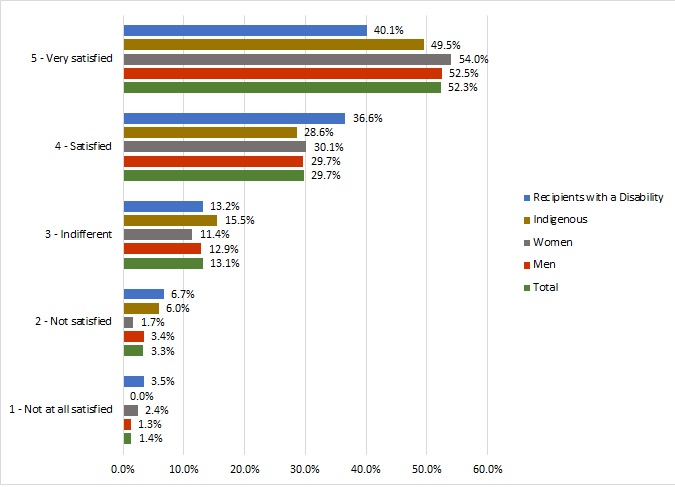
Text description of Figure 11
| Level of satisfaction with the timeliness of the loan | Total | Men | Women | Indigenous | Recipients with a disability |
|---|---|---|---|---|---|
| 1 - Not at all satisfied | 1.4% | 1.3% | 2.4% | 0.0% | 3.5% |
| 2 - Not satisfied | 3.3% | 3.4% | 1.7% | 6.0% | 6.7% |
| 3 - Indifferent | 13.1% | 12.9% | 11.4% | 15.5% | 13.2% |
| 4 - Satisfied | 29.7% | 29.7% | 30.1% | 28.6% | 36.6% |
| 5 - Very satisfied | 52.3% | 52.5% | 54.0% | 49.5% | 40.1% |
- Source of information: ESDC-PRA Inc. Survey of Canada Apprentice Loan recipients and eligible non-recipients 2019
Impact of services
Apprentices suggested changes to the Canada Apprentice Loan and the suite of federal support measures.
- Approximately 4% of apprentices would like to reduce the cost of apprenticeship
- For 4.3% of apprentices, raising awareness about the program could solve many issues, while another 3.8% mentioned that improving information about the loan could help them
- Another 2.8% mentioned that targeting more vulnerable groups, such as single women or low-income families, would be a good solution
- Close to 12% of apprentices surveyed mentioned that more grants or more funds including a targeted grant for specific costs, such as gas, travel and daycare would be useful
- There are some differences between loan recipients and non-recipients as it pertains to their views on enhancing the loan. But these differences are not large and systematic
- For approximately 10% of the apprentices surveyed, solving Employment Insurance issues would provide them a great support as seen in Annex E, Table 5.Footnote 18
| Suggested additional activity | Non-recipients | Canada Apprentice Loan recipients | Total |
|---|---|---|---|
| Increase the Canada Apprentice Loan amount | 1.0% | 3.1% | 2.2% |
| Lower interest rate | 0.2% | 1.4% | 0.9% |
| Raise awareness / advertise programs (in general) | 6.0% | 3.0% | 4.3% |
| Improve the information / awareness about the Canada Apprentice Loan | 5.5% | 2.6% | 3.8% |
| Financial advice from the Canada Apprentice Loan - repayment information | 2.3% | 1.9% | 2.1% |
- Source: ESDC-PRA Inc. Survey of Canada Apprentice Loan recipients and eligible non-recipients 2019.
Loan and completion
Using the loan has a positive contribution to completing the apprenticeship training for every trade.Footnote 19
Table 3 demonstrates that using the Canada Apprentice Loan contributes to completing an apprenticeship program.Footnote 20
The magnitude of the impact on completing an apprenticeship in compulsory tradesFootnote 21 is larger when compared to the voluntary trades.Footnote 22
For women, the loan contributes to completing an apprenticeship program in every trade as seen in Table 7, Annex E. This could be due to the small sample of women using the loan.
Each extra loan used has a diminishing contribution on the probability of completing the apprenticeship for all trades and compulsory trades. Table 3 reports a negative coefficient for the "number of loans used" measure. This means that the greater contribution comes from the first loan. Table 8 in Annex E also supports this finding.
| Parameter | All apprentices | Compulsory trades | Voluntary trades |
|---|---|---|---|
| Number of apprentices | 114,685 | 57,675 | 57,324 |
| Used the Canada Apprentice Loan (any number of loans) | 0.96*** | 0.98*** | 0.54*** |
| Standard errors | (0.128) | (0.145) | (0.169) |
| Number of loan used per apprentice | -0.37*** | -0.26** | -0.13 |
| Standard errors | (0.121) | (0.134) | (0.157) |
- Note:
- *** Significant at the 1% confidence level.
- ** Significant at the 5% confidence level.
- * Significant at the 10% confidence level.
- Source: Registered Apprenticeship Information System, Apprenticeship Grants and Employment Insurance administrative data
Other supports
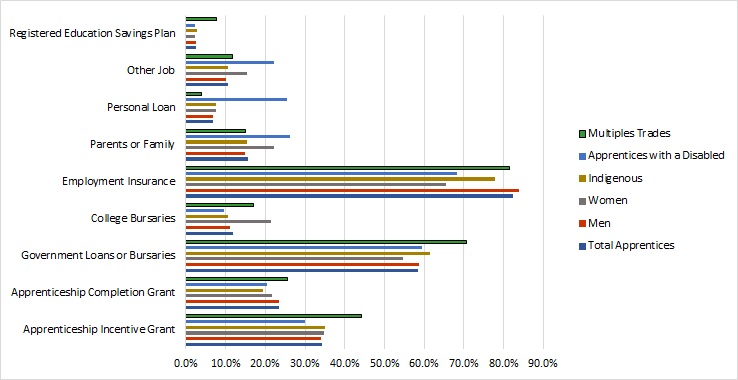
Approximately 82.5% of apprentices used Employment Insurance during their apprenticeship and 58.4% of apprentices used government loan or grants.
Figure 12 indicates that approximately 11.8% of apprentices used college bursaries. Roughly 10.6% of them had to rely on another job to finance their training.
Apprentices with a disability and women tend to rely more on another job, help from parents or family. Apprentices with a disability also rely more on a personal loan compared to other groups. Women apprentices and apprentices with a disability tend to use less employment insurance during their training as seen in Figure 12.
Text description of Figure 12
| Apprentice group using other supports | Apprenticeship Incentive Grant | Apprenticeship Completion Grant | Government loans or bursaries | College bursaries | Employment Insurance | Parents or family | Personal loan | Other job | Registered Education Savings Plan |
|---|---|---|---|---|---|---|---|---|---|
| Total apprentices | 34.2% | 23.5% | 58.4% | 11.8% | 82.5% | 15.7% | 6.8% | 10.6% | 2.6% |
| Men | 34.1% | 23.5% | 58.7% | 11.2% | 83.9% | 14.9% | 6.8% | 10.0% | 2.6% |
| Women | 34.8% | 21.6% | 54.7% | 21.5% | 65.6% | 22.3% | 7.5% | 15.5% | 2.2% |
| Indigenous | 35.1% | 19.4% | 61.5% | 10.6% | 77.9% | 15.4% | 7.6% | 10.5% | 2.8% |
| Apprentices with a disability | 29.9% | 20.5% | 59.5% | 9.5% | 68.4% | 26.1% | 25.4% | 22.1% | 2.3% |
| Multiples trades | 44.3% | 25.5% | 70.6% | 17.0% | 81.4% | 14.9% | 3.9% | 11.7% | 7.6% |
- Source: ESDC-PRA Inc. Survey of Canada Apprentice Loan recipients and eligible non-recipients 2019
A majority of loan recipients (74.1%) received support from the Apprenticeship Grants and Employment Insurance.
Figure 22 in Annex E indicates that there are notable differences in the pattern of usage of the various federal measures of financial support.
The 3 trade groups with the lowest proportion of recipients using the loan, the grants and Employment Insurance:
- hairstylists (42.6%)
- cooks (57.1%)
- industrial electricians (44.7%)
These 3 groups also have the highest proportion of recipients using only the loan as source of financial support. However, the 3 groups with the highest proportion of loan recipients also using both the grants and employment insurance were:
- construction electricians (81.1%)
- plumbers (79.9%)
- automotive service technicians (78.8%)
Only 4% of recipients use the Canada Apprentice Loan as a sole source of financial support (see Figure 13).

Text description of Figure 13
| Federal support measures used by apprentices | Proportion of loan recipients |
|---|---|
| Proportion of recipients using CAL Only | 4.0% |
| Proportion of recipients using CAL and AG | 15.0% |
| Proportion of recipients using CAL and EI | 6.9% |
| Proportion of recipients using CAL, AG and EI | 74.1% |
- Source: ESDC, Linked Canada Apprentice Loan, Apprenticeship Grants and Employment Insurance administrative data
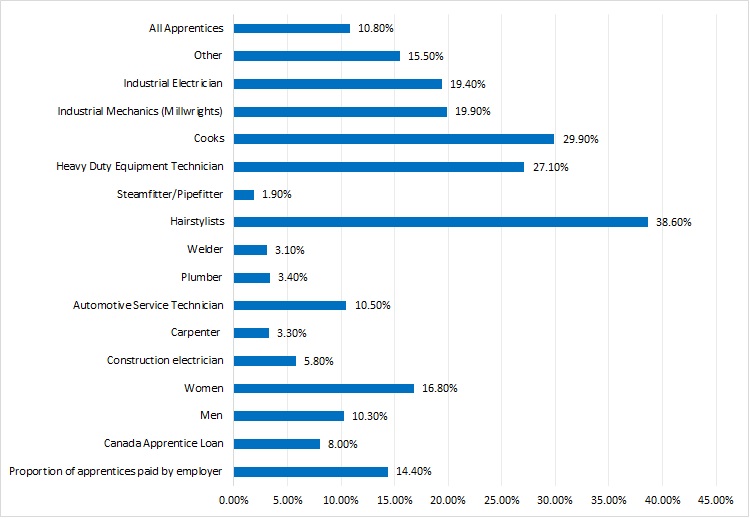
A small proportion (10.8%) of apprentices continue to get paid by their employer during the technical training period.
A large portion of apprentices need to find another source of income during their technical training period as indicated in Figure 14.
Figure 14 also indicates that the proportion of apprentices who are paid by their employer during the technical training period is higher among certain groups. These include:
- non-recipients
- women
- hairstylistsFootnote 23
- cooksFootnote 24
- heavy duty equipment technicians
Among those who are still being paid during the technical training period, most (51.8%) still receive their full wage. As shown in Figure 23 in Annex E, non-recipients (58.2%) and women (78.2%) are more likely to receive their full wage.
Text description of Figure 14
- Proportion of apprentices paid by employer: 14.4%
- Canada Apprentice Loan: 8.0%
- Men: 10.3%
- Women: 16.8%
- Construction electrician: 5.8%
- Carpenter: 3.3%
- Automotive service technician: 10.5%
- Plumber: 3.4%
- Welder: 3.1%
- Hairstylists: 38.6%
- Steamfitter/Pipefitter: 1.9%
- Heavy duty equipment technician: 27.1%
- Cooks: 29.9%
- Industrial mechanics (Millwrights): 19.9%
- Industrial electrician: 19.4%
- Other: 15.5%
- All apprentices: 10.8%
- Source: ESDC-PRA Inc. Survey of Canada Apprentice Loan recipients and eligible non-recipients 2019
Debt
On average an apprentice has $5,534 of debt during training and there are variations in terms of debt level by trade groups.
Figure 15 shows that that hairstylists ($4,536) and cooks $4,731 have the lowest amount of debt among trade groups. Millwright is the trade group taking on the most debt with an average debt per apprentice of $5,972. They are followed by steamfitters/pipefitters and heavy duty equipment technicians who take an average of $5,866 and $5,819 in debt respectively.
The difference in the amount of debt taken by these trade groups relative to the national average is statistically significant.Footnote 25 The eligibility requirement that apprentices in some trades have may be driving these differences in the level of indebtedness (in other words hairstylists and cooks).
Figure 26 in Annex E indicates that men tend to take on more debt than women.Footnote 26

Text description of Figure 15
| Red Seal Trade group | Amount of debt |
|---|---|
| Construction electricians | $5,640 |
| Carpenters | $5,373.32 |
| Automotive service technicians | $5,542.64 |
| Plumbers | $5,552.39 |
| Welders | $5,655.63 |
| Hairstylists | $4,535.82 |
| Steamfitters/Pipefitters | $5,865.78 |
| Heavy duty equipment Technicians | $5,819.15 |
| Cooks | $4,731.48 |
| Millwrights | $5,971.83 |
| Industrial electricians | $5,525.41 |
| Others | $5,302.87 |
| Total | $5,533.85 |
- Source: ESDC, Canada Apprentice Loan administrative data
Repayment
At the end of 2017, a little more than 12% of all the recipients were repaying their loan. Another 6.2% of them had repaid their loan in full.
Figure 16 indicates that, as of December 31, 2017Footnote 27 the status of the loan recipients:
- the majority of apprentices (74%) were still in training
- another 7% of the apprentices were still within the 6 months post training period where repaying the loan was not required
Figure 29 in Annex E also indicates that that 71.8% of the recipients surveyed who have either completed or discontinued their training are in repayment. Apprentices still in training are repaying their loans (20.6%).
Many recipients (81.6%) start repaying their loan before the end of their first year after training completion. About 10% of recipients start repaying their loan before completing their training as shown in Figure 30 in Annex E.

Text description of Figure 16
| Loan status of recipients for 2017 | On repayment assistance | In non-repayment | Paid in Full | In repayment | In training |
|---|---|---|---|---|---|
| Proportion of recipients | 0.2% | 7.1% | 6.2% | 12.4% | 74.1% |
- Source: ESDC, Canada Apprentice Loan administrative data
Less than half of recipients who have completed their apprenticeship are aware of the Repayment Assistance Program.
Figure 17 shows that 43.7% of recipients who have completed their apprenticeship are aware of the Repayment Assistance Program. Awareness is higher among women (48.1%), Indigenous recipients (47.9%) and recipients with a disability (56%).
Figure 17 also shows that 6.5% of recipients in repayment are using the Repayment Assistance Program.Footnote 28 This program tends to be utilized more by women (7.3%), Indigenous recipients (9.7%), and recipients with a disability (14.2%).

Text description of Figure 17
| Apprentices who completed apprenticeship and are aware and use the Repayment Program | Total | Men | Women | Indigenous | Recipients with a disability |
|---|---|---|---|---|---|
| Using Repayment Assistance Program | 6.5% | 6.3% | 7.7% | 9.7% | 14.2% |
| Aware Repayment Assistance Program | 43.7% | 43.4% | 48.1% | 47.9% | 56.6% |
- Source: ESDC-PRA Inc. Survey of Canada Apprentice Loan recipients and eligible non-recipients 2019
Various subgroups are in greater need of assistance when it comes time to repay their loan. This is likely due to lower earnings upon completing apprenticeship training.
Figure 18 shows that a higher proportion of women in repayment (6.2%) compared to 1.5% of men in repayment use the repayment assistance program.Footnote 29 A higher proportion of apprentices from the Atlantic are relying on the repayment assistance program. A higher proportion of hairstylists (30%) and cooks (6.4%) are using the repayment assistance program as seen in Figure 31 in Annex E.

Text description of Figure 18
| Apprentice group by region | Proportion of recipients in repayment using the Repayment Assistance Program |
|---|---|
| All apprentices | 1.7% |
| Men | 1.5% |
| Women | 6.2% |
| Atlantic | 3.5% |
| Ontario | 1.3% |
| Prairies | 1.5% |
| British Columbia and Territories | 1.8% |
- Source: Canada Apprentice Loan administrative data
Conclusions
Despite the program being in the developmental stages, the findings indicate a need for the program. Importantly, various lines of evidence confirm that the loan contributes to the apprentices completing their training.
The program does not have an objective to use the loan as an incentive to join an apprenticeship program. However, it was observed that only one third of apprentices are aware of the loan prior to registering. Increasing awareness of the loan and its measures may contribute to higher levels of take-up than seen between 2015 and 2017.
Apprentices are making use of other federal government supports, such as the Apprenticeship Grant and Employment Insurance. Only 4% use the Canada Apprenticeship Loan on its own.
The program is still in developmental stages and a majority of the apprentices are still in training. This made assessing debt levels and repaying the loan in this evaluation formative in nature. A more comprehensive conclusion about these elements can be reported:
- once the apprentices are no longer in training, and
- the program has identified benchmarks related to take-up and repayment timelines
Recommendation
The program should focus on increasing awareness of the loans among underrepresented groups. Both in terms of promoting the program and in terms of providing clarity about its principal features so more apprentices that are in need can benefit.
Consideration
The Canada Apprenticeship Loan is only one part of a broader suite of federal support measures for apprenticeships. The department should consider how the loan links into a broader Apprenticeship Strategy.
Management response and action plan
Recommendation #1
The program should focus on increasing awareness of the loans among underrepresented groups. Both in terms of promotion of the program and in terms of providing clarity about its principal features so more apprentices that are in need can benefit.
Management response and action plan
The program agrees that increasing CAL awareness and promotion to those individuals that would benefit from the apprenticeship loan. It will improve the uptake and provide the required supports needed to underrepresented groups.
Actions Planned: The department will include the Canada Apprentice Loan as part of the ongoing development of the Apprenticeship Strategy. It could include raising awareness of ESDC’s apprenticeship supports.
Anticipated Completion Date: Continuous.
Consideration #1
As the Canada Apprenticeship Loan is only one part of a broader suite of federal support measures for apprenticeships. The Department should consider how the loan links into a broader Apprenticeship Strategy.
Management response and action plan
The department agrees and supports the need to include the Canadian Apprenticeship Loan as part of a broader Apprenticeship Strategy.
Actions Planned: the department acknowledges this consideration.
Anticipated Completion Date: continuous.
Annex A: Evaluation questions and lines of evidence
For accessibility reasons, the information is presented in text format. Consult the PDF version for the table.
Evaluation question #1
Whether there is a need for the Canada Apprentice Loan, given existing apprentice support measures, the cost of technical training, and overall apprenticeship program costs.
- To what extent do apprentices continue to be paid by their employer during their technical training?
- To what extent do loans meet the needs of the different sub-populations of apprentices?
- Are there other ways of providing support to apprentices during the technical training period that would better meet the needs of apprentices?
Lines of evidence
Linked Canada Apprentice Loan, Apprenticeship Grants and Employment Insurance administrative data, Surveys.
Evaluation questions #2
The extent to which the Canada Apprentice Loan participation and the take-up matched expectations.
What is the Canada Apprentice Loan participation and take-up rate by jurisdiction, gender, trade, year of program, etc.?
Lines of evidence
Linked Canada Apprentice Loan, Apprenticeship Grants and Employment Insurance administrative data.
Evaluation question #3
The timing for loans application as well as the number of applications by apprentices over their apprenticeship program.
Lines of evidence
Linked Canada Apprentice Loan, Apprenticeship Grants and Employment Insurance administrative data, Surveys and Linked Registered Apprenticeship Information System with Employment and Social Development Canada administrative database.
Evaluation questions #4
The extent to which the Canada Apprentice Loan loans are used to cover the cost of technical training and other related expenses such as tools, additional living expenses, etc.
Lines of evidence
Surveys.
Evaluation question #5
To what extent are Canada Apprentice Loan borrowers using Repayment Assistance Plan during the first year after being required to start repayment?
Lines of evidence
Linked Canada Apprentice Loan, Apprenticeship Grants and Employment Insurance administrative data, Surveys.
Evaluation question #6
To what extent is it possible to isolate the impact of the Canada Apprentice Loan on the number of apprentices who complete their apprenticeship training?
Lines of evidence
Linked Registered Apprenticeship Information System with Employment and Social Development Canada administrative database.
Evaluation question #7
What is the overall amount of debt of Canada Apprentice Loan borrowers by jurisdiction, gender, etc.?
Lines of evidence
Linked Canada Apprentice Loan, Apprenticeship Grants and Employment Insurance administrative data.
Evaluation question #8
To what extent are Canada Apprentice Loan loans being repaid?
- To what extent are Canada Apprentice Loan borrowers required to start repaying their loans upon completion of their apprenticeship program compared to other reason?
- How does this vary by type of apprenticeship trade?
- To what extent are Canada Apprentice Loan borrowers repaying their entire loan within one year after being required to start repayment?
Lines of evidence
Linked Canada Apprentice Loan, Apprenticeship Grants and Employment Insurance administrative data, Surveys.
Evaluation question #9
To what extent are apprentices using other financial support such as the Apprenticeship Incentive Grant, Employment Insurance benefits, and/or provincial/territorial financial assistance to cover the costs associated with technical training costs and overall apprenticeship program costs?
Lines of evidence
Linked Canada Apprentice Loan, Apprenticeship Grants and Employment Insurance administrative data, Surveys.
Evaluation question #10
The impacts of the service delivery strategy in delivering the Canada Apprentice Loan.
- To what extent are Canada Apprentice Loan recipients satisfied with the service delivery?
- Is there any barrier that prevents apprentices from applying for and receiving loans?
- To what extent are Canada Apprentice Loan loans being delivered in a timely fashion?
Lines of evidence
Surveys.
Evaluation question #11
The extent to which apprentices and stakeholders (for example, career counsellors, unions, industry associations, etc.) are aware of the Canada Apprentice Loan and its features.
Lines of evidence
Surveys.
Annex B: Evaluation approach
Limitations
- The impact study used for this evaluation suffered from an omitted variable bias. It likely overestimated the impact of the loan on the completion of an apprenticeship. For that reason, the key findings reported mention contribution of the program rather than impact
- The Canada Apprentice Loan was introduced in 2015 and is a relatively new program which has not reached maturity. In addition, given that most (74.2%) of the recipients are still in apprenticeship training, assessment of repayment and impacts on the loan are limited. Efforts to filter out those in training in the analysis were made to respond to the evaluation questions. This sometimes resulted in a low sample size
- The lack of indicators on some outcomes such as take-up rate or time to fully repay the loan make it difficult to assess whether the benchmarks were achieved or not
- The variable for Canada apprentice Loan eligibility was not available in the Registered Apprenticeship Information System (RAIS). In that case, the evaluation had to rely on several proxies. This was done to estimate the take-up rate and the impact of the loan on completion leading to less precise estimates
- Sample size for groups of apprentices such as women and Indigenous apprentices were too small to disaggregate the analysis. It also did not allow for a comprehensive Gender Based Analysis+ analysis
Lines of evidence and methodology
Administrative data analysis
The database used for this study contains and links information on apprentices from 3 sources:
- Canada Apprentice Loan (CAL) administrative data
- Apprenticeship Incentive Grant (AIG) and Apprenticeship Completion Grant (ACG) administrative
- Employment Insurance (EI) administrative data pertaining to apprentices
These 3 files contains data on apprentices between calendar year 2015 and 2017.
Surveys
The database used for this study contains information on apprentices from 2 surveys:
Random survey of Canada Apprentice Loan recipients
- Interview Method: Online and telephone
- Sample Selection: Stratified random sample
- Time of the Survey: March 18, 2019 to June 2, 2019
- Sample size: n = 968
- Approximate error rate (theoretical): + 3.1%, 19 times out of 20
Random survey of Canada Apprentice Loan eligible non-recipients
- Interview Method: Telephone and online
- Sample Selection: Stratified random sample
- Time of the Survey: March 18, 2019 to June 2, 2019
- Sample size: n = 853
- Approximate error rate (theoretical): + 3.3%, 19 times out of 20
Integrated RAIS-ESDC Data Analysis
The RAIS-ESDC database contains information on apprentices from four sources:
- Apprenticeship Incentive Grant (AIG) and Apprenticeship Completion Grant (ACG) administrative data
- Canada Apprentice Loan administrative data
- Employment Insurance administrative data on apprentices
- Registered Apprenticeship Information System (Statistics Canada)
Depending on the personal identification information available, the integration of data are done using iterations of several deterministic and probabilistic record linkage methods. A standard probit and a nearest-neighbour matching algorithm applied to an average treatment effect are estimated to assess the impact of the loan:
- on the probability of completing in an apprenticeship
- on the probability of discontinuing in an apprenticeship
To ensure the group that received Canada Apprentice Loan could be adequately compared to those not receiving the Canada Apprentice Loan, the groups were matched using the following variables:
- number of Canada Apprentice Loan used during apprenticeship training
- stage during the apprenticeship when the Canada Apprentice Loan were used
- gender
- trade groups
- an interaction term of Gender and Trade groups (for example Gender*Trade groups)
- age (at Apprenticeship registration date) in age groups
- province or territory
- Indigenous status
- number of technical levels required or program duration
- program duration proxied by the number of technical training period required
- number of technical training period completed to day
- proportion of Apprenticeship training completed to day in categories
- number of years since registration to apprenticeship
- receipt of Level 1 Apprenticeship Incentive Grant
- receipt of Level 2 Apprenticeship Incentive Grant
- receipt of Apprenticeship Completion Grant
- number of Canada Apprentice Loans received during apprenticeship training
- receipt of Employment Insurance during apprenticeship training
- number of Employment Insurance claims during apprenticeship
- individual earnings up-to 5 years prior to apprenticeship training
- family income up-to 5 years prior to apprenticeship training
- receipt of Employment Insurance benefits up-to 5 years prior to apprenticeship training
Annex C: Description of the program
Introduced in 2015, the Canada Apprentice Loan is designed to help registered Red Seal apprentices cover the costs related to their apprenticeship. The program offers interest-free loans to help registered apprentices cope with the cost of their training. The Canada Apprentice Loan assists more apprentices in completing their training and encourages more Canadians to consider a career in the skilled trades. The table below outlines the program’s objectives, delivery and activities.
Canada Apprentice Loan
Program objective
The objective of the Canada Apprenticeship Loan is to offer interest-free loans to help registered apprentices with the cost of their training. The Canada Apprentice Loan is designed to:
- assist more apprentices in completing their training
- encourage more Canadians to consider a career in the skilled trades
Delivery
The program relies on collaboration and coordination between multiple bodies.
The Canada Apprentice Loan Service Centre handles:
- the administrative responsibilities of processing loan applications
- maintaining records during the borrowing and repayment periods
Public Services and Procurement Canada handles the disbursement of Canada Apprentice Loan funds. The Canada Revenue Agency is responsible for collections when Canada Apprentice Loans are in default. Technical training providers must confirm enrolment status in technical training periods before loans can be disbursed. The relevant province/territory must confirm registration status in an apprenticeship program for an apprentice to maintain eligibility for interest-free status.
Funding
In loan year 2015 to 2016, a total of 16,429 apprentices borrowed from the Canada Apprentice Loan, leading to disbursements totaling $69.4 million.
Funding activities
The Canada Apprentice Loan was designed to assist apprentices with the costs of completing periods of technical training required by their program, including:
- educational fees
- tools
- equipment, living expenses and forgone wages
Eligible recipients
Apprentices in a designated Red Seal trade who go on technical training in a block-release are eligible. Apprentices from Quebec are not participating in block-release training so they are not eligible for the Canada Apprentice Loan.
Participants
Participants are defined as all apprentices in a designated Red Seal trade who are attending a technical training in a block release or the equivalent full-time technical training. These are defined by the applicable provincial or territorial apprenticeship authority.
Annex D: Logic model

Text description of Annex D: Logic model
Departmental Results Framework (DRF)
Core Responsibility (CR): Learning, Skills Development and Employment
CR Description:
- help Canadians access post-secondary education
- obtain the skills and training needed to participate in a changing labour market, and
- provide supports to those who are temporarily unemployed
Results Statements (RS)
- RS1: Canadians access education, training and life-long learning supports to gain the skills and work experience they need
- RS2: More students from low- and middle-income families access and participate in post-secondary education
- RS3: Clients receive high quality, timely and efficient services that meet their needs
Ultimate Outcome
Canadians have equitable access to post-secondary education, training, and life-long learning opportunities to contribute to a rapidly changing economy.
Intermediate Outcomes
- Canadians complete apprenticeship training
- Borrowers are able to meet their apprentice loan repayment obligations
Immediate Outcomes
- Eligible apprentices receive loans to help them participate in apprenticeship training
- Service standards are met
- Borrowers receive repayment assistance and loan forgiveness
Outputs
- Loans
- Repayment assistance and loan forgiveness
Activities
- Program Administration of Canada Apprentice Loans
Inputs
- Information Technology, Human and Financial Resources
Annex E: Additional figures and tables
| Variable | 2015 | 2016 | 2017 | 2018 | 2019 |
|---|---|---|---|---|---|
| Number of Canada Apprentice Loans | 16,400 | 17,800 | 15,400 | 14,500 | 13,400 |
| Number of Canada Apprentice Loan recipients | 14,800 | 15,900 | 13,800 | 13,300 | 12,400 |
| Amount of Canada Apprentice Loans (millions of dollars) | $63 | $69 | $59.5 | $56.2 | $52.1 |

Text description of Figure 19
| Trade Group | Proportion of Apprentices who had difficulty making ends meet during technical training |
|---|---|
| Construction electrician | 51.1% |
| Carpenter | 45.7% |
| Automotive service technician | 47.2% |
| Plumber | 57.1% |
| Welder | 59.4% |
| Hairstylists | 41.6% |
| Steamfitter/Pipefitter | 53.2% |
| Heavy duty equipement Technician | 35.1% |
| Cooks | 38.5% |
| Industrial mechanics (Millwrights) | 45.2% |
| Industrial electrician | 60.8% |
| Other | 45.1% |
| Multiples trades | 60.9% |
| One trade | 47.9% |
- Source: ESDC-PRA Inc. Survey of Canada Apprentice Loan recipients and eligible non-recipients 2019

Text description of Figure 20
| Importance of loan in deciding to becoming an apprentice | Total | Men | Women | Indigenous | Apprentices with a disability | Annual earnings under $25,000 | Annual earnings between $25,000 and $50,000 |
|---|---|---|---|---|---|---|---|
| 4 Important | 17.4% | 17.0% | 20.2% | 36.4% | 22.1% | 37.0% | 21.6% |
| 5 Very important | 21.6% | 21.3% | 26.8% | 28.5% | 40.4% | 22.5% | 26.4% |
- Source: ESDC-PRA Inc. Survey of Canada Apprentice Loan recipients and eligible non-recipients 2019

Text description of Figure 21
| Calendar Year for Take-up | Total Apprentices for Take-up | Newfoundland and Labrador | Prince Edward Island | Nova Scotia | New Brunswick | Ontario | Manitoba | Saskatchewan | Alberta | British Columbia | Territories |
|---|---|---|---|---|---|---|---|---|---|---|---|
| 2015 | 28.0% | 11.9% | 11.2% | 41.4% | 31.0% | 17.3% | 28.2% | 21.8% | 34.6% | 33.7% | 28.4% |
| 2016 | 35.2% | 20.4% | 28.3% | 43.4% | 34.0% | 15.0% | 32.6% | 31.0% | 52.2% | 36.3% | 55.7% |
| 2017 | 32.2% | 16.2% | 33.4% | 43.5% | 31.2% | 14.1% | 30.1% | 30.6% | 52.5% | 32.1% | 47.2% |
| Total | 31.6% | 15.6% | 23.9% | 42.8% | 32.0% | 15.6% | 30.3% | 27.3% | 44.9% | 34.0% | 25.3% |
- Source: ESDC, Linked Canada Apprentice Loan, Apprenticeship Grants and Employment Insurance administrative data
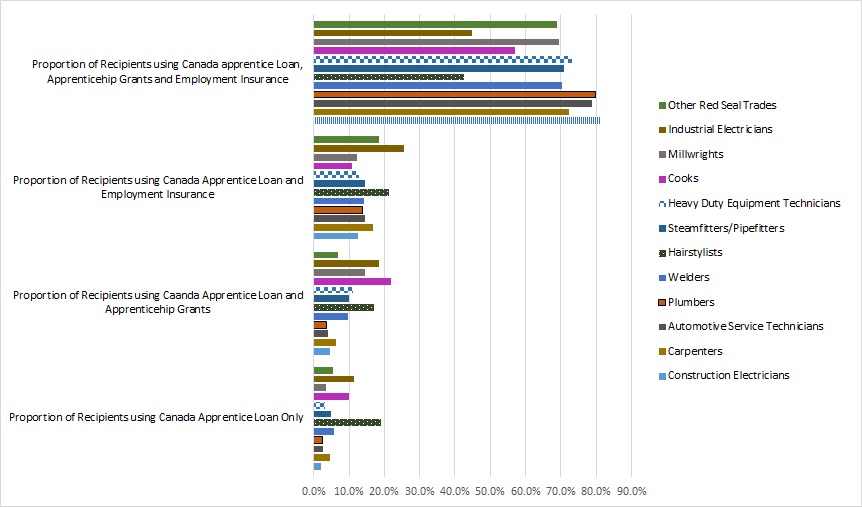
Text description of Figure 22
| Trade Group | Proportion of recipients using Canada Apprentice Loan only | Proportion of recipients using Canada Apprentice Loan and Apprenticehip Grants | Proportion of recipients using Canada Apprentice Loan and Employment Insurance | Proportion of recipients using Canada Apprentice Loan, Apprenticehip Grants and Employment Insurance |
|---|---|---|---|---|
| Construction electricians | 2% | 4.5% | 12.4% | 81.1% |
| Carpenters | 4.6% | 6.3% | 16.7% | 72.4% |
| Automotive service technicians | 2.7% | 4.1% | 14.4% | 78.8% |
| Plumbers | 2.5% | 3.7% | 13.9% | 79.9% |
| Welders | 5.8% | 9.8% | 14.1% | 70.3% |
| Hairstylists | 19.1% | 17% | 21.3% | 42.6% |
| Steamfitters/Pipefitters | 4.9% | 10% | 14.4% | 70.8% |
| Heavy duty equipment Technicians | 3.1% | 11% | 12.8% | 73.2% |
| Cooks | 10.1% | 22% | 10.8% | 57.1% |
| Millwrights | 3.5% | 14.6% | 12.2% | 69.6% |
| Industrial electricians | 11.3% | 18.4% | 25.6% | 44.7% |
| Other Red Seal trades | 5.5% | 7% | 18.5% | 69% |
- Source: ESDC, Linked Canada Apprentice Loan, Apprenticeship Grants and Employment Insurance administrative data
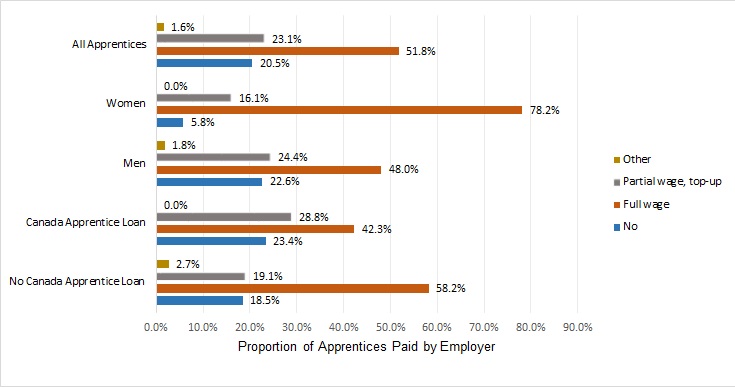
Text description of Figure 23
| Type of wage | No Canada Apprentice Loan | Canada Apprentice Loan | Men | Women | All apprentices |
|---|---|---|---|---|---|
| No | 18.5% | 23.4% | 22.6% | 5.8% | 20.5% |
| Full wage | 58.2% | 42.3% | 48% | 78.2% | 51.8% |
| Partial wage, top-up | 19.1% | 28.8% | 24.4% | 16.1% | 23.1% |
| Other | 2.7% | 0% | 1.8% | 0% | 1.6% |
- Source: ESDC-PRA Inc. Survey of Canada Apprentice Loan recipients and eligible non-recipients 2019
| Suggested additional support | Non-recipients | Canada Apprentice Loan recipients | Total |
|---|---|---|---|
| More grants/funding | 11.3% (N=91) | 12.1% (N=122) | 11.6% (N=214) |
| Reduce the costs of apprenticeships | 4.6% (N=38) | 3.7% (N=39) | 4.1% (N=75) |
| Social Issues with Employment Insurance – shorter waiting period, access | 11.8% (N=96) | 8.3% (N=84) | 9.9% (N=180) |
| Increase Employment Insurance amount | 4.7% (N=39) | 5% (N=50) | 4.9% (N=89) |
| Structural changes to apprenticeship (ratios, help finding a job, interprovincial transfer, women in trades) | 3.8% (N=31) | 2.7% (N=27) | 3.2% (N=58) |
| Employer involvement (release time / incentives / job security) | 1.8% (N=15) | 1.9% (N=19) | 1.9% (N=34) |
| School training related (better teachers, courses, course offerings, locations, timing | 5.4% (N=44) | 3.2% (N=32) | 4.2% (N=76) |
| Help for those financially vulnerable (single mom, low income family) | 2.5% (N=20) | 3.1% (N=31) | 2.8% (N=51) |
- Source: ESDC-PRA Inc. Survey of Canada Apprentice Loan recipients and eligible non-recipients 2019
| Recipients | Number of observations | Mean # of loans | Difference | P-Value | [95% Conf. | Interval |
|---|---|---|---|---|---|---|
| All apprentices | 1,113 | 1.75 | n/a | n/a | 1.68 | 1.82 |
| Women | 316 | 1.7 | -0.06 | 0.36 | 1.59 | 1.81 |
| Indigenous | 109 | 1.68 | -0.08 | 0.54 | 1.45 | 1.92 |
| Disabled | 43 | 1.83 | 0.09 | 0.72 | 1.36 | 2.31 |
| 18 to 24 Years Old | 162 | 1.64 | -0.13 | 0.17 | 1.47 | 1.82 |
| 25 to 29 Years Old | 361 | 1.77 | 0.01 | 0.84 | 1.65 | 1.88 |
| 30 to 39 Year Old | 389 | 1.76 | 0.01 | 0.94 | 1.65 | 1.87 |
| 40 years old and older | 163 | 1.85 | 0.11 | 0.29 | 1.66 | 2.03 |
| Under $25,000 annual income | 47 | 1.66 | -0.11 | 0.57 | 1.29 | 2.03 |
| $25,000 to $50,000 annual income | 239 | 1.91 | 0.18 | 0.06 | 1.73 | 2.08 |
| $50,000 to $75,000 annual income | 307 | 1.88 | 0.17 | 0.03 | 1.75 | 2.01 |
| $75,000 to $100,000 annual income | 219 | 1.64 | -0.16 | 0.03 | 1.51 | 1.76 |
| $100,000 to $150,000 annual income | 150 | 1.65 | -0.13 | 0.13 | 1.49 | 1.81 |
| Over $150,000 annual income | 49 | 1.5 | -0.28 | 0.04 | 1.23 | 1.76 |
- Source: ESDC-PRA Inc. Survey of Canada Apprentice Loan recipients and eligible non-recipients 2019
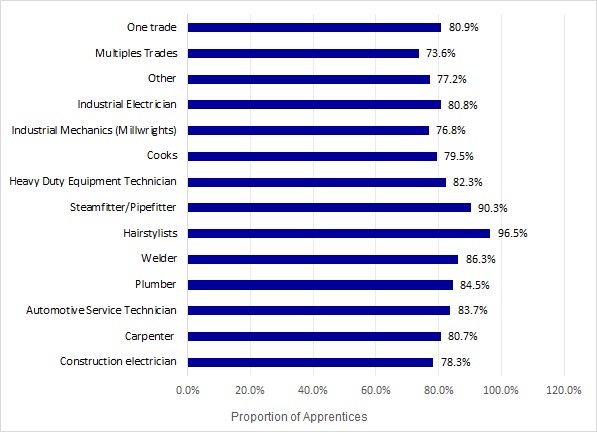
Text description of Figure 24
| Trade group | Proportion of recipients indicating that the loan was important in helping them covering the cost of the apprenticeship training |
|---|---|
| Construction electrician | 78.3% |
| Carpenter | 80.7% |
| Automotive service technician | 83.7% |
| Plumber | 84.5% |
| Welder | 86.3% |
| Hairstylists | 96.5% |
| Steamfitter/Pipefitter | 90.3% |
| Heavy duty equipment Technician | 82.3% |
| Cooks | 79.5% |
| Industrial mechanics (Millwrights) | 76.8% |
| Industrial electrician | 80.8% |
| Other | 77.2% |
| Multiples trades | 73.6% |
| One trade | 80.9% |
- Source: ESDC-PRA Inc. Survey of Canada Apprentice Loan recipients and eligible non-recipients 2019

Text description of Figure 25
| Trade Group | Make ends meet | Buy training books / computer / uniform | Buy trade-specific tools | Pay tuition and other fees |
|---|---|---|---|---|
| Construction electrician | 74.2% | 39.8% | 23.7% | 40% |
| Carpenters | 83% | 26.8% | 34.3% | 26.7% |
| Automotive service technician | 84.3% | 38.3% | 23% | 46.7% |
| Plumber | 76.4% | 56.6% | 27.5% | 48% |
| Welder | 92.9% | 49.3% | 38.2% | 46.2% |
| Hairstylist | 49.7% | 19.2% | 39.8% | 24.7% |
| Steamfitter/Pipefitter | 92.4% | 39.9% | 16.1% | 33.7% |
| Heavy duty equipment Technician | 70% | 28.2% | 16.5% | 49% |
| Cook | 23.7% | 44.3% | 49.8% | 73.1% |
| Industrial mechanic (Millwrights) | 76.2% | 41% | 31.5% | 33.7% |
| Industrial electrician | 88.4% | 65.7% | 36.7% | 72.7% |
| Other | 79.9% | 29% | 23.6% | 34% |
| One trade | 79.3% | 37% | 25.4% | 38.6% |
| Multiples trades | 83% | 60.9% | 34.2% | 59.6% |
- Source: ESDC-PRA Inc. Survey of Canada Apprentice Loan recipients and eligible non-recipients 2019

Text description of Figure 26
| Gender | Level of debt |
|---|---|
| Total | $5,533.85 |
| Women | $5,288.70 |
| Men | $5,547.92 |
- Source: ESDC, Canada Apprentice Loan administrative data
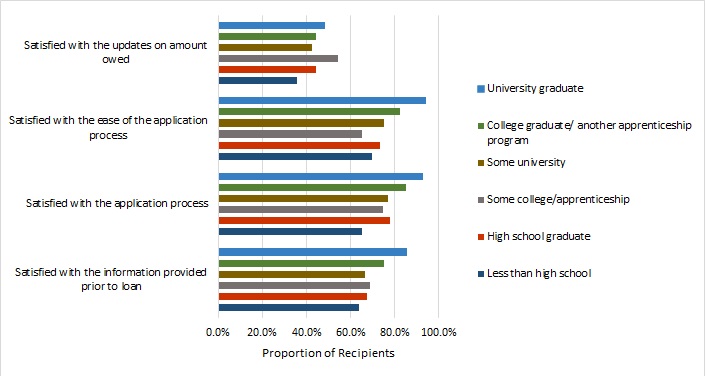
Text description of Figure 27
| Level of satisfaction of service delivery | Less than high school | High school graduate | Some college/ apprenticeship | Some university | College graduate/ another apprenticeship program | University graduate |
|---|---|---|---|---|---|---|
| Satisfied with the information provided prior to loan | 63.6% | 67.6% | 69.0% | 66.7% | 75.0% | 85.6% |
| Satisfied with the application process | 65.1% | 77.9% | 74.5% | 76.9% | 85.2% | 92.9% |
| Satisfied with the ease of the application process | 69.5% | 73.2% | 65.3% | 75.2% | 82.6% | 94.3% |
| Satisfied with the updates on amount owed | 35.5% | 44.2% | 54.5% | 42.7% | 44.1% | 48.4% |
- Source: ESDC-PRA Inc. Survey of Canada Apprentice Loan recipients and eligible non-recipients 2019

Text description of Figure 28
| Level of timeliness of loan by region | 1 Atlantic | 2 Ontario | 3 Prairies | 4 BC and Territories |
|---|---|---|---|---|
| 1 - Not at all satisfied | 1.4% | 1.7% | 1.3% | 1.3% |
| 2- Not satisfied | 2.9% | 4.1% | 3.2% | 3.4% |
| 3- Neutral | 15.0% | 17.2% | 12.6% | 9.6% |
| 4- Satisfied | 34.9% | 35.2% | 26.4% | 32.8% |
| 5- Very satisfied | 45.8% | 41.0% | 56.1% | 52.8% |
- Source: ESDC-PRA Inc. Survey of Canada Apprentice Loan recipients and eligible non-recipients 2019
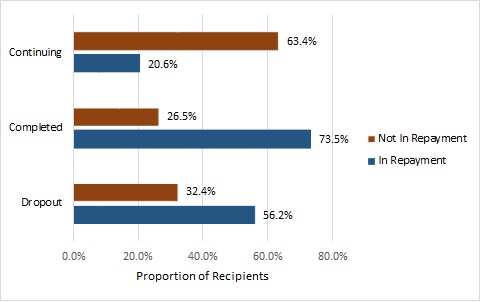
Text description of Figure 29
| Status of apprentice | In repayment | Not In repayment |
|---|---|---|
| Dropout | 56.2% | 32.4% |
| Completed | 73.5% | 26.5% |
| Continuing | 20.6% | 63.4% |
- Source: ESDC-PRA Inc. Survey of Canada Apprentice Loan recipients and eligible non-recipients 2019

Text description of Figure 30
| Stage of apprenticeship | Percentage start repaying |
|---|---|
| Before completing training | 9.5% |
| Year of completion | 33.0% |
| 1 Year after completion | 39.1% |
| More than 1 year after completion | 11.8% |
| Non-response | 6.6% |
- Source: ESDC-PRA Inc. Survey of Canada Apprentice Loan recipients and eligible non-recipients 2019

Text description of Figure 31
| Trade group | % Loan recipients using Repayment Assistance Program |
|---|---|
| Construction electricians | 1.6% |
| Carpenters | 0.3% |
| Automotive service technicians | 3.1% |
| Plumbers | 3.0% |
| Welders | 2.4% |
| Hairstylists | 30.0% |
| Steamfitters/Pipefitters | 1.2% |
| Heavy duty equipment technicians | 1.5% |
| Cooks | 6.4% |
| Millwrights | 1.4% |
| Industrial electricians | 0.0% |
| Other Red Seal trades | 1.0% |
| Total | 1.7% |
- Source: ESDC, Canada Apprentice Loan administrative data
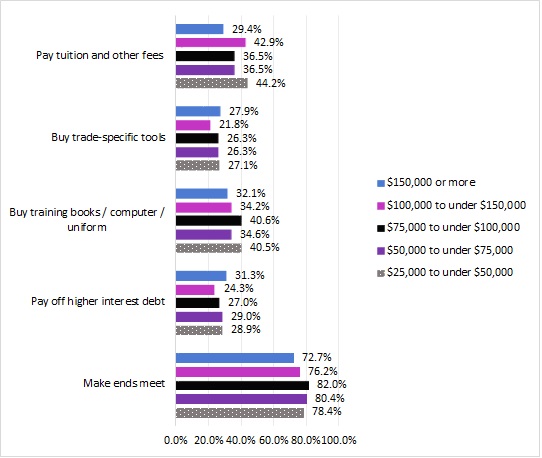
Text description of Figure 32
| Items loan was used for | $25,000 to under $50,000 | $50,000 to under $75,000 | $75,000 to under $100,000 | $100,000 to under $150,000 | $150,000 or more |
|---|---|---|---|---|---|
| Make ends meet | 78.4% | 80.4% | 82.0% | 76.2% | 72.7% |
| Pay off higher interest debt | 28.9% | 29.0% | 27.0% | 24.3% | 31.3% |
| Buy training books / computer / uniform | 40.5% | 34.6% | 40.6% | 34.2% | 32.1% |
| Buy trade-specific tools | 27.1% | 26.3% | 26.3% | 21.8% | 27.9% |
| Pay tuition and other fees | 44.2% | 36.5% | 36.5% | 42.9% | 29.4% |
- Source: ESDC-PRA Inc. Survey of Canada Apprentice Loan recipients and eligible non-recipients 2019
| Parameter | All apprentices | Men | Women |
|---|---|---|---|
| Number of apprentices | 114,685 | 100,080 | 14,711 |
| Used the Canada Apprentice Loan (any number of loans) | 0.96*** | 0.93*** | 0.5 |
| Standard Errors | -0.128 | -0.124 | -0.524 |
| Number of loans used per apprentice | (0.37***) | (0.34***) | -0.27 |
| Standard errors | -0.121 | -0.117 | -0.516 |
- Note: *** Significant at the 1% confidence level.
- Source: Registered Apprenticeship Information System, Apprenticeship Grants and Employment Insurance administrative data
| Parameter | All apprentices | Men | Women |
|---|---|---|---|
| Number of observations | 451,914 | 226,357 | 225,557 |
| Used Canada Apprentice Loan | 18.2*** | 15.7*** | 17.8*** |
| Standard errors | -0.012 | -0.041 | -0.019 |
| One loan used (percentage points) | 25.3*** | 23.5*** | 25.3*** |
| Standard Errors | -0.006 | -0.007 | -0.009 |
| Two loans used (percentage points) | 31.7*** | 37.1*** | 18.8*** |
| Standard errors | -0.023 | -0.16 | -0.064 |
| Three loans used (percentage points) | 8.7 | -10.6 | 49.0*** |
| Standard errors | -0.09 | -0.112 | -0.013 |
- Note: *** Significant at the 1% confidence level.
- Source: Registered Apprenticeship Information System, Apprenticeship Grants and Employment Insurance administrative data
Page details
- Date modified: