
Evaluation of the Canada-British Columbia Labour Market Development Agreement
Alternate formats

Evaluation of the Canada-British Columbia Labour Market Development Agreement [PDF - 1.2 MB]
Large print, braille, MP3 (audio), e-text and DAISY formats are available on demand by ordering online or calling 1 800 O-Canada (1-800-622-6232). If you use a teletypewriter (TTY), call 1-800-926-9105.
List of abbreviations
- EAS
- Employment Assistance Services
- EBSM
- Employment Benefits and Support Measures
- EI
- Employment Insurance
- ESDC
- Employment and Social Development Canada
- JCP
- Job Creation Partnerships
- LMDA
- Labour Market Development Agreement
- SA
- Social assistance
- WSWEP
- Wage Subsidy Work Experience Placement
List of charts
- Chart i. Change in probability of being employed in participants relative to non-participants (annual average)
- Chart ii. Employment earnings of participants relative to non-participants (annual average)
- Chart iii. Change in dependence on government income support (annual average)
- Chart 1. Change in probability of being employed in participants relative to non-participants (annual average)
- Chart 2. Annual employment earnings of participants relative to non-participants (annual average)
- Chart 3. Change in the use of EI benefits (annual average)
- Chart 4. Change in the use of SA benefits (annual average)
- Chart 5. Change in dependence on government income support (annual average)
- Chart 6. Average earnings for active claimant participants in Training Services-Apprentices
- Chart 7. Average earnings for former claimant participants in Training Services-Apprentices
List of tables
- Table i. Share of LMDA funding and average cost per Action Plan Equivalent per participant in British Columbia for 2010 to 2012
- Table ii. Number of years for the benefits to exceed program costs
- Table 1. Share of LMDA funding and average cost per Action Plan Equivalent per participant in British Columbia
- Table 2. Profile of active and former EI claimant participants in 2010 to 2012 in British Columbia
- Table 3. Employment and earning levels, and use of SA in the year before participation in EBSMs
- Table 4. Profile of female participants in British Columbia in 2010 to 2012
- Table 5. Incremental impacts for female participants (annual average)
- Table 6. Profile of male participants in British Columbia in 2010 to 2012
- Table 7. Incremental impacts for male participants (annual average)
- Table 8. Profile of youth participants in British Columbia in 2010 to 2012
- Table 9. Incremental impacts for youth participants (annual average)
- Table 10. Profile of older worker participants in British Columbia in 2010 to 2012
- Table 11. Incremental impacts for older worker participants in Training Services and EAS (annual average)
- Table 12. Profile of Indigenous active and former EI claimant participants in British Columbia in 2010 to 2012
- Table 13. Incremental impacts for Indigenous participants (annual average)
- Table 14. Profile of persons with disability participants in British Columbia in 2010 to 2012
- Table 15. Incremental impacts for persons with disabilities (annual average)
- Table 16. Profile of active EI claimant participants who were recent immigrants in British Columbia in 2010 to 2012
- Table 17. Incremental impacts for recent immigrants (annual average)
- Table 18. Profile of active EI claimant participants who were visible minorities in British Columbia in 2010 to 2012
- Table 19. Incremental impacts for visible minority participants (annual average)
- Table 20. Incremental impacts for Training Service participants in North Region (annual average)
- Table 21. Incremental impacts for Training Service participants in the Southern Region (annual average)
- Table 22. Incremental impacts for Training Service participants in Vancouver (annual average)
- Table 23. Incremental impacts for Training Services participants in Victoria (annual average)
- Table 24. Cost-benefit results for active and former EI claimant participants
- Table 25. Profile of participants in Training Services-Apprentices in British Columbia from 2010 to 2012
Executive summary
The Canada-British Columbia Labour Market Development Agreement (LMDA) is a bilateral agreement between Canada and British Columbia for the design and delivery of Employment Benefits and Support Measures (EBSMs).
The objective of EBSMs is to assist individuals to obtain or keep employment through various active employment programs, including training or employment assistance services. Successful delivery of EBSMs is expected to result in participants receiving needed services, a quick return to work, and savings to the Employment Insurance (EI) account.
Programs and services delivered by British Columbia must correspond to the EBSM categories defined under the EI Act. The following is a short description of the EBSMs examined in the evaluation of the Canada-British Columbia LMDA:
- Training Services help participants obtain employment skills by giving them financial assistance in order to attend classroom training
- Wage Subsidy Work Experience Placement (WSWEP) helps participants obtain on-the-job work experience by providing employers with a wage subsidy
- Self-Employment assists participants in creating employment for themselves by providing them with a range of services including assistance with business plan development, counselling, coaching and mentoring, entrepreneurial training and workshops
- Job Creation Partnerships (JCP) support projects that provide eligible participants with opportunities to gain meaningful work experience while providing community benefit
- Employment Assistance Services (EAS) support individuals as they prepare to enter or re-enter the workforce or assist them to find a better job
- services can include counselling, action planning, job search skills, job-finding clubs, job placement services, case management and follow-up, and the provision of labour market information
- Labour Market Partnerships assist employers, communities or economic sectors and regions to address their labour force adjustments and human resource needs
- Research and Innovation funds research and innovative projects to explore and assess untried and untested approaches to addressing specific labour market issues
The LMDA investment
In fiscal year 2020 to 2021, Canada transferred approximately $324 million (including nearly $15.5 million in administration funds) to British Columbia.
Table i provides an overview of the share of funding allocated to EBSMs and the average cost per participant. The average cost per participant is calculated based on the 2010 to 2012 data from the EI Monitoring and Assessment Reports. The 2010 to 2012 period corresponds with the cohort of participants selected for incremental impacts and cost-benefit analysis in the Canada-British Columbia LMDA evaluation.
| Employment Benefits and Support Measures | Share of funding | Average cost – Active claimants | Average cost – Former claimants |
|---|---|---|---|
| Training Services | 38% | $9,665 | $10,071 |
| Employment Assistance Services | 42% | $1,095 | $1,095 |
| Labour Market Partnerships | 3% | n/a | n/a |
| Self-Employment | 10% | $22,447 | $22,570 |
| Wage Subsidy Work Experience Placement | 6% | $10,270 | $9,717 |
| Job Creation Partnerships | 1% | $21,006 | $20,091 |
| Research and Innovation | 0% | n/a | n/a |
| Total | 100% | n/a | n/a |
Sources: EI Monitoring and Assessment Reports for fiscal years 2010 to 2011 to 2011 to 2012, and 2020 to 2021.
Note: Total spending do not add up to 100% due to rounding.
Compared to the 2010 to 2012 period, there was variation in the LMDA budget allocation of some programs and services in 2020 to 2021. For example, investments in EAS deceased from 42% to 17%, while those in Training Services increased from 38% to 61%.
Evaluation objectives
Building on the success of previous LMDA evaluation cycles, the aim of this evaluation is to fill in knowledge gaps about the effectiveness, efficiency, as well as design and delivery of EBSMs in British Columbia.
Evaluation methodology
The findings in this report are drawn from 8 separate evaluation studies. These studies examine issues related to program effectiveness, efficiency, and design and delivery. A mix of qualitative and quantitative methods are used, including:
- incremental impact analysis for participants who began an intervention between 2010 and 2012
- outcome analysis
- cost-benefit analysis (including savings to health care)
- key informant interviews with 33 provincial representatives, service providers, agreement holders and key stakeholders
- questionnaires completed by provincial officials
- a survey of 757 Self-Employment participants in British Columbia
- document and literature reviews
The incremental impacts are estimated for 2 types of EI claimants:
- active claimants are participants who started an EBSM intervention while collecting EI benefits
- former claimants are participants who started an EBSM intervention up to 3 years after the end of their EI benefits Footnote 3
Key findings
Nearly 78,100 active and former EI claimants began participating in Canada-British Columbia LMDA programs and services between 2010 and 2012.
Effectiveness and efficiency of EBSMs
Overall, incremental impacts demonstrate that participation in most EBSMs improves labour market attachment and reduces dependence on government income supports compared to similar non-participants.
A subgroup analysis shows Training Services, WSWEP, and EAS interventions benefit female, male, and youth participants. Where participant numbers were sufficient to enable statistically significant incremental impact analysis, these programs also improved the labour market attachment of older, Indigenous, recent immigrant, and visible minority participants.
A regional analysis of incremental impacts for Training Services found that participants in the north and south regions, as well as those in Vancouver increased their labour market attachment and reduced their dependence on government income support. Participants in Victoria increased their labour market attachment.
The social benefits of participating in EBSMs exceeds the initial investment costs over time for active claimants and for former claimants who participate in Training Services.
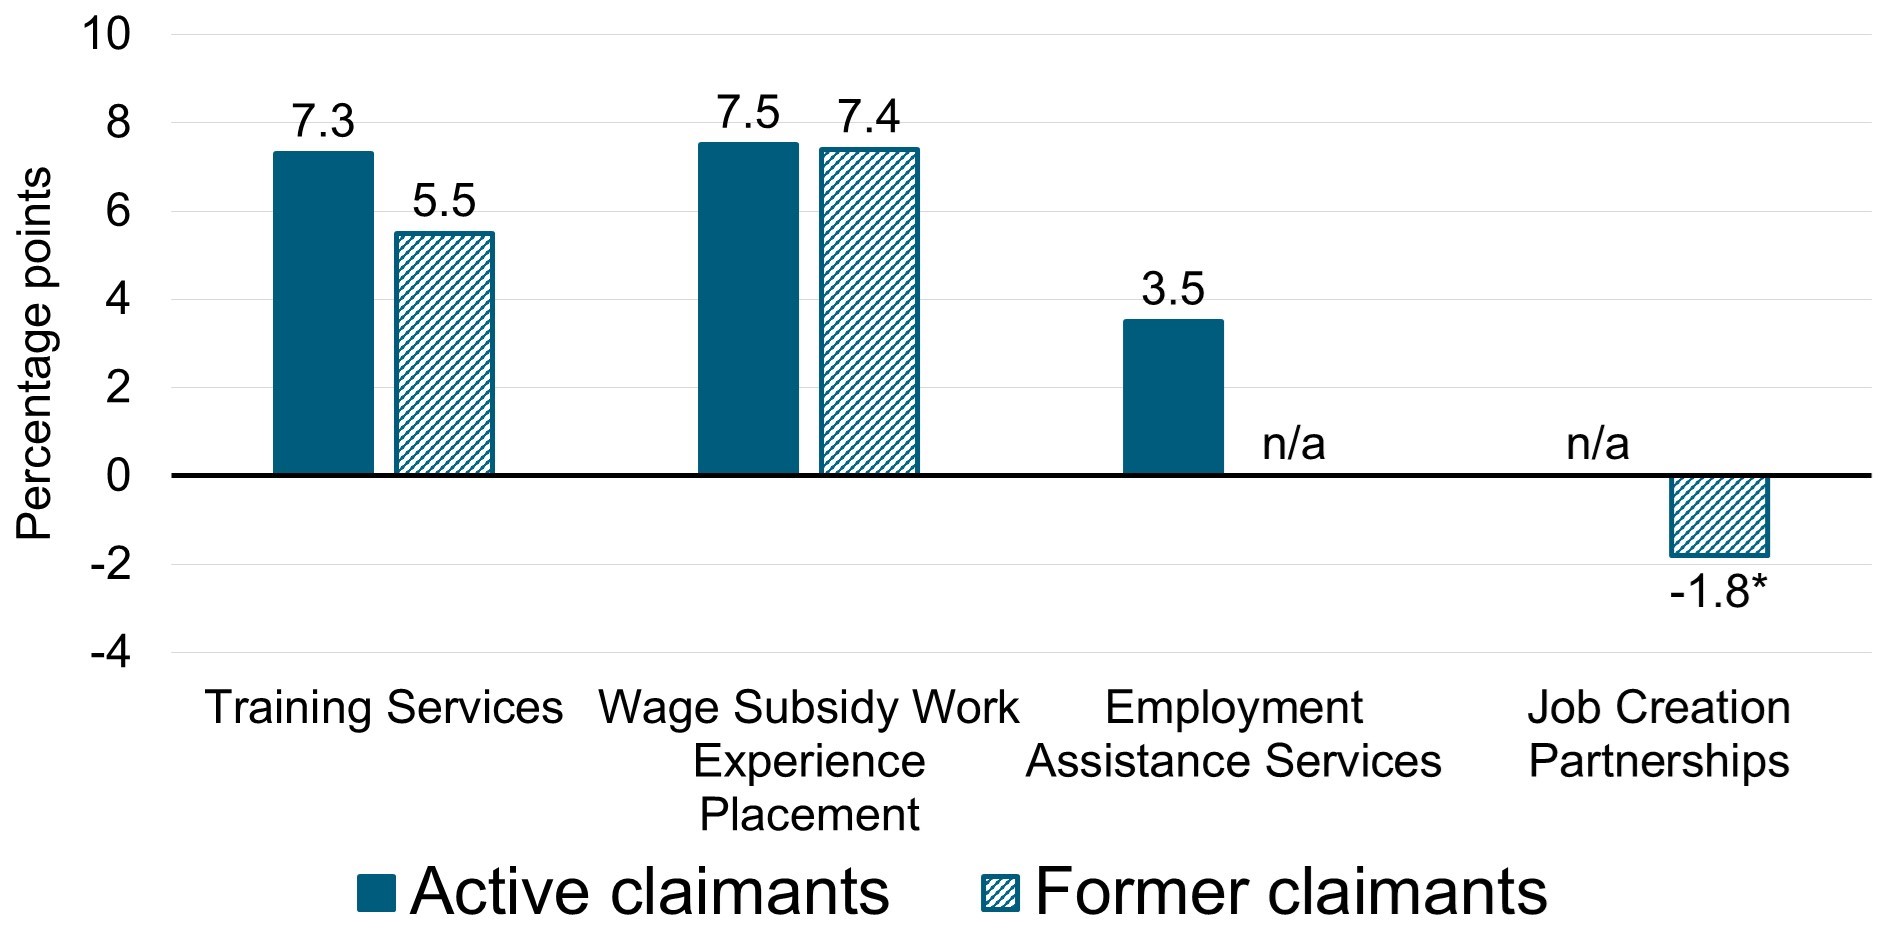
Chart i presents the incremental impacts on the incidence of employment for active and former claimants by EBSM. The estimates can be interpreted as a change in the probability of being employed following participation. For example, participation in Training Services increases the probability of being employed by 7.3 percentage points for active EI claimants relative to non-participants.
Chart i. Change in probability of being employed in participants relative to non-participants (annual average)

Note: Impacts are estimated over 4 post-program years (or 5 years in the case of EAS).
* The annual average impact is not statistically significant.
Chart i text description
| Program name | Incidence of employment for active claimants (percentage points) |
Incidence of employment for former claimants (percentage points) |
|---|---|---|
| Training Services | 7.3 | 5.5 |
| Wage Subsidy Work Experience Placement | 7.5 | 7.4 |
| Employment Assistance Services | 3.5 | n/a |
| Job Creation Partnerships | n/a | -1.8* |
Note: Impacts are estimated over 4 post-program years (or 5 years in the case of EAS).
* The annual average impact is not statistically significant.
Chart ii presents the annual average increase in employment earnings for active and former claimants over the post-participation period. For example, active EI claimants who participated in Training Services earned, on average, $5,345 more than similar non-participants.
Chart ii. Employment earnings of participants relative to non-participants (annual average)

Note: Impacts are estimated over 4 post-program years (or 5 years in the case of EAS).
* The annual average impact is not statistically significant.
Chart ii text description
| Program name | Employment earnings of active claimants | Employment earnings of former claimants |
|---|---|---|
| Training Services | $5,345 | $3,990 |
| Wage Subsidy Work Experience Placement | $4,678 | $4,400 |
| Employment Assistance Services | $1,474 | n/a |
| Job Creation Partnerships | n/a | $111* |
Note: Impacts are estimated over 4 post-program years (or 5 years in the case of EAS).
* The annual average impact is not statistically significant.
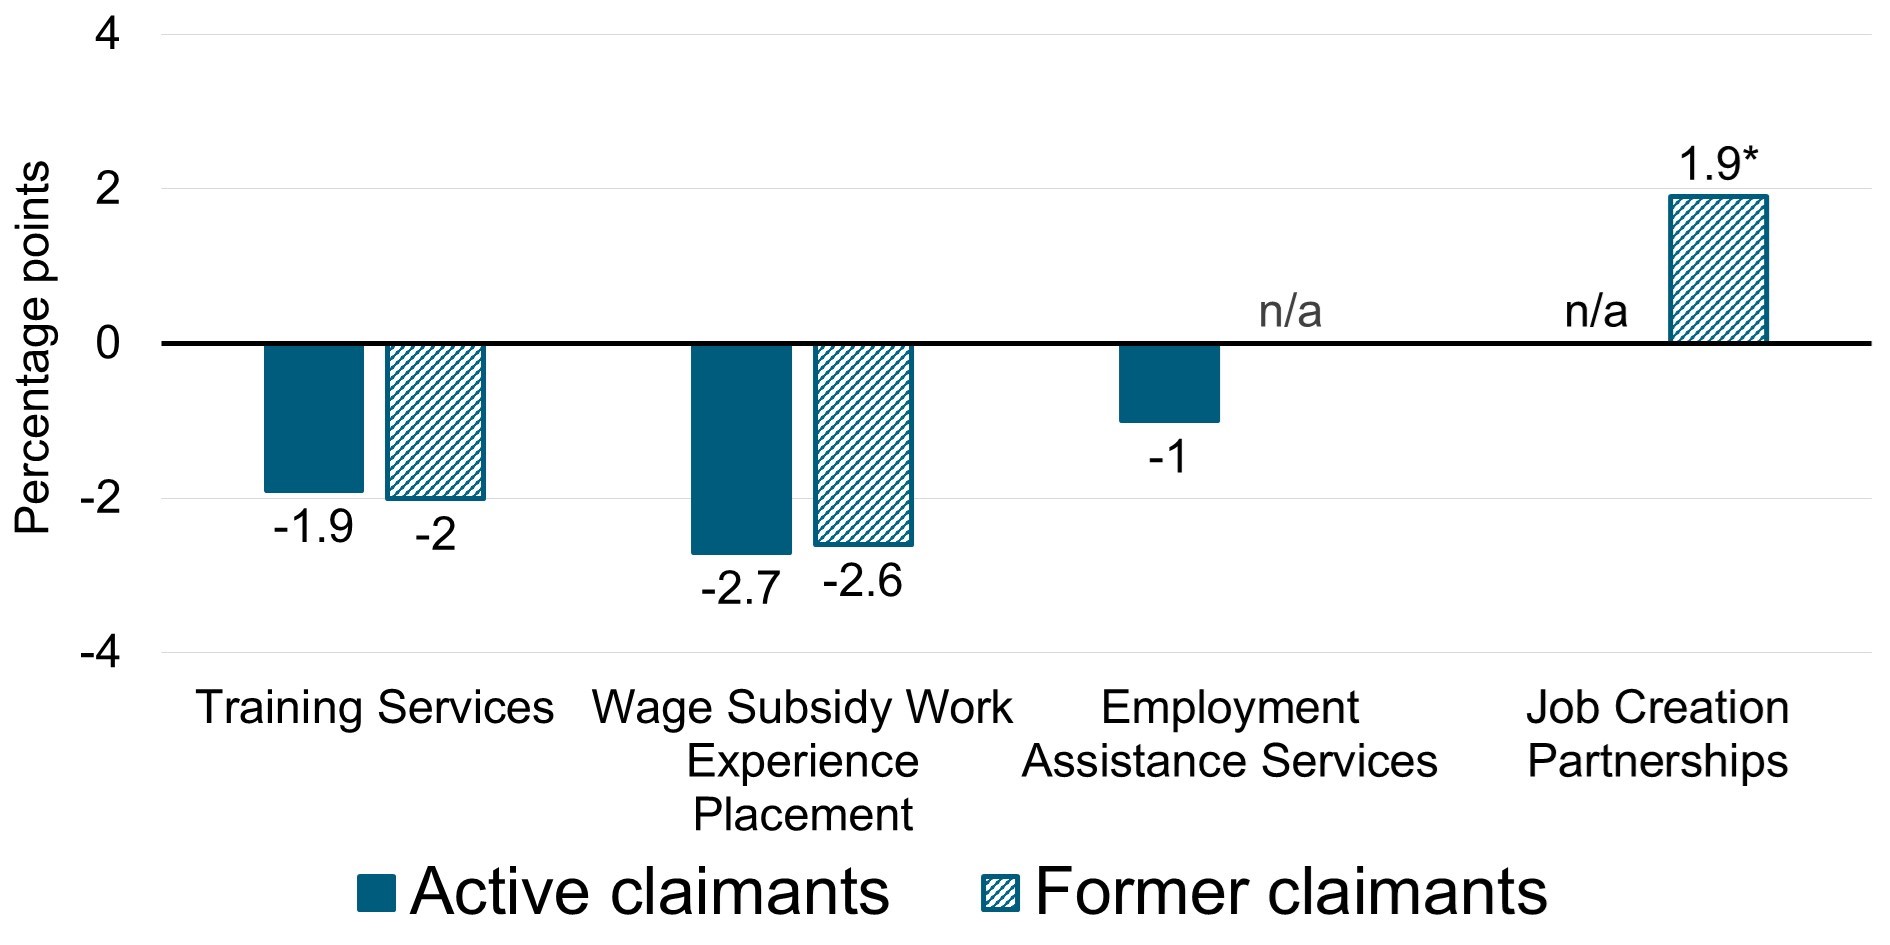
Chart iii presents the change in dependence on government income supports for active and former claimants over the post-participation period. With the exception of JCP, active and former claimants reduced their dependence on government income supports.
Chart iii. Change in dependence on government income support (annual average)Footnote 4

Note: Impacts are estimated over 4 post-program years (or 5 years in the case of EAS).
* The annual average impact is not statistically significant.
Chart iii text description
| Program name | Dependence on government income support for active claimants (percentage points) |
Dependence on government income support for former claimants (percentage points) |
|---|---|---|
| Training Services | -1.9 | -2 |
| Wage Subsidy Work Experience Placement | -2.7 | -2.6 |
| Employment Assistance Services | -1 | n/a |
| Job Creation Partnerships | n/a | 1.9* |
Note: Impacts are estimated over 4 post-program years (or 5 years in the case of EAS).
* The annual average impact is not statistically significant.
Table ii presents the number of years required for the social benefits to exceed program costs. Social benefits to participation exceed initial investment costs over a period ranging from less than a year to 3.9 years after participation.
| Indicator | Training Services Active claimants (10 years post-program) | WSWEP Active claimants (5 years post-program) | EAS Active claimants (5 years post-program) | Training Services Former claimants (10 years post-program) | WSWEP Former claimants (5 years post-program) | JCP Former claimants (5 years post-program) |
|---|---|---|---|---|---|---|
| Payback period (years after end of participation) | 3.9 | 1.9 | 3.4 | 3.7 | < 1 1 | n/a 2 |
1 Paid back within the program start year.
2 Benefits may never recover the costs.
Supplemental studies
A series of supplemental studies address information gaps previously identified in LMDA evaluations regarding the design and delivery, challenges and lessons learned for Self-Employment, JCP, Labour Market Partnerships, and Research and Innovation.
Most of these interventions are not suitable for incremental impact analysis. For example, Labour Market Partnerships and Research and Innovation do not collect participant information. As a results, a mix of qualitative and quantitative methods are used to examine these EBSMs in detail. When relevant, key considerations are included to help guide future program and policy discussions.
Self-Employment study
The Self-Employment program aims to assist participants in creating employment for themselves by providing them with a range of services including:
- assistance with business plan development
- counselling, coaching and mentoring
- entrepreneurial training and workshops
Based on a survey of 757 participants in British Columbia, it was found that 2 to 4 years after program participation:
- participants increased their employment level by 16 percentage points from 60% in the year before participating to 76% at the time of survey (that is 2 to 4 years after program participation); the increase is mainly due to an increase in the percentage of self-employed participants
- 45% of survey respondents launched a self-employment business that was still in operation in winter 2020
- half of self-employment businesses were launched in professional, scientific and technical services; other services Footnote 5, retail trade; and construction
- 74% of respondents said that they were financially about the same or better off after the program
- 70% of respondents said that their household net worth was about the same or higher after the program
The survey examined the contribution of the program to the success of self-employment businesses. At least 81% of survey respondents who launched a self-employment business rated the services and training they received as very or somewhat important to the business launch, operation and success. The most highly ranked services were:
- training on budgeting and financial management
- living allowance during participation
- training on marketing
Job Creation Partnership study
The design and delivery of JCP allows British Columbia to address a variety of barriers to employment experienced by its residents (such as lack of work experience). JCP can also be used to address labour market needs by targeting sub-groups of individuals, economic sectors in demand and communities.
In addition to gaining valuable work experience, key informants identified a variety of other benefits that can be expected from JCP projects. By participating in a project, individuals are expected to gain networking opportunities, enhance soft-skills and improve their personal well-being.
Project holders can benefit from JCP through increased capacity, completing their projects and increasing the awareness of their organisations. At the community level, JCP projects can support economic development, provide tangible assets and foster community collaboration.
Labour Market Partnerships study
The Labour Market Partnerships programs aim to assist employers, communities or economic sectors and regions to address their labour force adjustments and human resource needs. Generally, funded projects target labour market issues associated with:
- projected or actual industry growth
- lack of capacity for human resource planning resulting in employee attraction and retention challenges
- shortages of sector or jurisdiction specific labour market information
- barriers to employment experienced by a target population
These projects also targeted specific unemployed populations (for example, women, youth, Indigenous peoples, newcomers and persons with disabilities).
Program officials in British Columbia carried out activities to support the formation and maintenance of partnerships. Provincial departments and key informants stated that partners’ expertise is essential to project implementation and success.
Research and Innovation study
Research and Innovation provides funding for research and demonstration projects. These projects aim to:
- address specific labour market issues
- help unemployed individuals to join the labour force
- inform the development of policies, programs, or industry practices and their integration in the WorkBC employment services
The document review reveals that Research and Innovation projects encompassed a variety of activities including:
- development and/or testing of new approaches to improve employment outcomes for persons with disabilities and at-risk youth
- strengthening and improving service provision
A provincial questionnaire revealed factors contributing to successful testing and identification of innovative approaches, including:
- engaging in continuous Research and Innovation project application intake to address on-going and emerging labour market issues
- maintaining flexible Research and Innovation project criteria to encourage organisations to address labour market issues affecting marginalised populations
- having practices in place to enable the government to better monitor projects, such as:
- project holder reporting on specific targets and milestones
- clear and regular communication with project holders
- ensuring that project holders have:
- the organizational and financial reporting capacity to undertake and complete projects
- a strong commitment from project partners
- a detailed cost-estimate for the project
Training Services-Apprentices study
The objective of the program is to help apprentices become skilled tradespeople and to increase their labour market attachment. Program participants have generally chosen a career and are already attached to the labour market. The apprenticeship process involves on-the-job learning and technical training in a classroom setting.
The evaluation found that active EI claimants increased their average earnings from $20,085 in the fifth year pre-program to $56,254 in the fifth year after the program start. Former claimants increased their average earnings from $22,981 in the fifth year pre-program to $57,472 in the fifth year after the program start year. After participating in the program, both active and former claimants also decreased their dependence on government income supports.
Recommendations
Since 2012, 15 qualitative and quantitative studies addressed issues and questions related to EBSM design, delivery and effectiveness. The quantitative studies successfully assessed the effectiveness and efficiency of EBSMs by producing incremental impacts and cost-benefit analysis. The qualitative studies identified specific challenges, lessons learned, and best practices associated with the design and delivery of EBSMs. Each study included key considerations for program and policy development or recommendations.
In addition, the recently completed evaluation of the Workforce Development Agreements complements the LMDA qualitative studies. This evaluation was also supported by literature reviews and provided unique insights into challenges and lessons learned to assist persons with disabilities, immigrants and those further removed from the labour market.
Most results from this evaluation stem from the conduct of advance causal analysis whereby impacts found could be attributed to a specific EBSM. These analyses are predicated on having access to high quality administrative records, thereby confirming the importance of the capacity to leverage and integrate relevant administrative data.
From these main findings, 2 key recommendations emerge:
Recommendation #1: British Columbia is encouraged to share and discuss lessons learned, best practices and challenges associated with the design and delivery of programs and services. Discussions are encouraged with ESDC, at the bilateral or multilateral levels as well as with service delivery network if necessary.
Recommendation #2: British Columbia is encouraged to pursue efforts to maintain and strengthen data collection provisions in support of reporting, performance measurement and data-driven evaluations at the national and provincial levels.
Management response
Introduction
The Synthesis Report and its recommendations have been reviewed and approved by the Ministry of Social Development and Poverty Reduction (the Ministry). The findings and recommendations were well received as the Ministry actively supports continuous improvement through the collection, analysis, and sharing of information with stakeholders.
British Columbia has already taken action related to recommendations in the Evaluation of the Canada-British Columbia LMDA as prepared by the Evaluation Directorate, Strategic and Service Policy Branch of ESDC and are detailed below. These examples are intended to demonstrate British Columbia’s shared priorities with ESDC and the province’s focus on ongoing program improvement.
Two recommendations for British Columbia
- British Columbia is encouraged to share and discuss lessons learned, best practices and challenges associated with the design and delivery of programs and services. Discussions are encouraged with ESDC, at the bilateral or multilateral levels as well as with service delivery network if necessary.
British Columbia acknowledges the value in building and maintaining an effective and constructive network with all partners and stakeholders, including ESDC, to share and discuss ways to improve employment programs and service delivery on an ongoing basis.
- Service Providers: British Columbia consulted with WorkBC service providers throughout the COVID-19 pandemic and the subsequent economic recovery period to ensure services were continuously accessible, safe, and available to meet clients’ evolving needs. As a result, British Columbia shifted many programs and services from eligibility based on client type to eligibility based on client need
- Service Providers: British Columbia hosts discussion forums for WorkBC Service Providers to share best practices in service delivery to clients, including under-represented populations
- Sectors and Employers: British Columbia engaged with over 100 large, provincial-footprint employers, and associations, to facilitate connections with WorkBC Centres to increase employment opportunities for WorkBC clients
- Sectors and Employers: British Columbia hosted multiple roundtable discussions between sector-specific employers and/or employer associations and WorkBC service providers to identify labour market challenges and brainstorm solutions for productive recruitment and retention
- Communities: British Columbia consulted with la Fédération des francophones de la Colombie-Britannique to inform the development of the WorkBC App in both official languages as well as on the enhancement of the Online Employment Services, virtual intake tool, which allows "Broadcast Messaging" to inform multiple francophone clients about available services and supports in both French and English
- Communities: British Columbia consulted with over 30 disability focused organizations to identify gaps in services and supports for People with Disabilities during the pandemic. This work was the impetus for other strategic initiatives and conditional grants that will test innovative service delivery models to inform future program development
- Communities: British Columbia is working with specialized service providers to pilot innovative service delivery models for at-risk-youth and those with multiple barriers to employment. The results of these pilots will be used to inform future program development
- Indigenous Communities: British Columbia regularly engages with Indigenous Skills Employment Training service providers to inform program and policy development, and to support the referral of Indigenous clients to employment and skills training programs and services
- Indigenous Communities: British Columbia is in exploratory discussions with the First Nations Leadership Council and the Government of Canada to establish a First Nations Skills Training and Employment Committee to support self-determination of First Nations labour market priorities
- Cross-government and Jurisdictions: British Columbia was one of the first provinces to adopt the Targeting, Referral and Feedback initiative in cooperation with ESDC. An evaluation of the launch was conducted and results proactively shared with ESDC and other jurisdictions to assist with the national roll-out of the initiative and learn from British Columbia’s experience
- Cross-government and Jurisdictions: British Columbia is working collaboratively across social sector Ministries to support the Care Economy through coordinated HR planning to address labour and skills shortages in the social and health care sectors; and to advance workforce development and address skills and labour shortages through the development of a Provincial Future Ready Skills Plan
- Cross-government and Jurisdictions: British Columbia is an active participant in all aspects of the Forum of Labour Market Ministers Committee and its sub-working groups which serve as platforms for sharing of best practices, challenges, and solutions to labour market issues with Federal, Provincial and Territorial colleagues (such as, skills and labour shortages, serving under-represented client groups)
- Cross-government and Jurisdictions: British Columbia recently engaged a third-party research firm to examine service delivery models and best practices in the delivery of employment services, with an eye towards digitization. The results of this research will be used to inform the future design of employment programs in British Columbia
- Cross-government and Jurisdictions: British Columbia contributed program information to LMDA evaluations of the Job Creation Partnership, Labour Market Partnership, and Research and Innovation in 2018, 2020, and 2021, respectively
- British Columbia is encouraged to pursue efforts to maintain and strengthen data collection provisions in support of reporting, performance measurement and data-driven evaluations at the national and provincial levels.
British Columbia agrees with the importance of data collection to support an evidence-based approach to program development and has already made several improvements over the last few years as highlighted below. British Columbia is committed to the endorsed Performance Measurement Strategy to collect relevant data in support of performance measurement and evaluation.
- British Columbia has proposed reciprocal data sharing with Canada to improve program intelligence and facilitate pro-active program response, while easing administrative requirements for service providers
- British Columbia has adopted Behavioral Insights to engage unemployed British Columbians connecting with employment services and supports and inform continuous improvements. Behavioral Insights methodology is used to optimize outreach messaging for Targeting, Referral, and Feedback, Online Employment Services, and the WorkBC App
- British Columbia delivered the first public sector behaviorally informed experiment on EI client enrolment in Canada during COVID-19 to help recently unemployed British Columbians connect with employment services, resulting in increased client enrolments to WorkBC. The client experience data being collected through this experiment enriched the Ministry’s understanding of client engagement in each demographic and helped improve Targeting Referral, and Feedback performance
- British Columbia was the first province to successfully implement EI Application Programming interface technology, establishing a modern digital ecosystem to better support integrated EI application digital processes between British Columbia and Canada
- British Columbia participates in FLMM sub working groups and expects to contribute ideas and solutions that will continue to improve performance measurement for the LMDA
- British Columbia is actively participating in National Information Exchange Model to support Human Service Domain information sharing and promote interoperability between and across social service providers at the federal and local level. The output of having a common data vocabulary will increase efficiency and agility for data exchange process between ESDC and the province. It provides a foundation of common understanding around data and supports the evolving of performance measurements
- British Columbia adopted a new approach to gathering client feedback with an automated WorkBC Client Survey facility to collect feedback at different points in their journey towards employment. Survey results are helping to collect consistent feedback on client experience and satisfaction, which summarize client needs, expectation, understandings of the services, and lead to continuous program improvement
- British Columbia is dedicated to leading development and implementation of modern technologies to improve data analysis. The province is sharing the actions, successes and challenges to help others accelerate their progress towards a prosperous and stable future in delivering employment services to the diverse needs of job seekers
Introduction
Employment and Social Development Canada (ESDC) worked jointly with British Columbia and 11 other provinces and territories to complete the third evaluation cycle (2018 to 2023) of the Canada-British Columbia Labour Market Development Agreement (LMDA).
The first evaluation cycle of the LMDA was carried out from 1998 to 2012. It involved the conduct of separate formative and summative evaluations under the guidance of a bilateral Joint Evaluation Committee.
Building on lessons learned and best practices from the first cycle, the second evaluation cycle of the LMDA was undertaken between 2012 and 2017. The second cycle was designed and implemented under the guidance of a federal-provincial/territorial LMDA Evaluation Steering Committee. The work was supported by bilateral discussions at the Joint Evaluation Committee.
The third LMDA evaluation cycle builds on the success of the second cycle. The aim is to fill in knowledge gaps about the effectiveness, efficiency, and design and delivery of LMDA-funded Employment Benefits and Support Measures (EBSMs). The evaluation cycle was designed and implemented under the guidance of a federal-provincial/territorial LMDA Evaluation Steering Committee composed of ESDC and 12 participating provinces and territories.
For British Columbia, this report presents a summary of findings from 8 separate studies.
Canada-British Columbia Labour Market Development Agreement
The LMDAs are bilateral agreements between Canada and each province and territory for the design and delivery of EBSM programs and services. They were established under Part II of the 1996 Employment Insurance (EI) Act.
In fiscal year 2020 to 2021, Canada transferred approximately $324 million to British Columbia. Under the agreement, British Columbia is responsible for the design and delivery of LMDA-funded programs and services aimed at assisting individuals to prepare for, obtain, and maintain employment.
LMDA programs and services are classified under 2 categories:
- Employment benefits Footnote 6, Footnote 7 fall into 4 sub-categories:
- Training Services
- Wage Subsidy Work Experience Placement
- Job Creation Partnerships
- Self-Employment
- Support measures fall into 3 subcategories:
- Employment Assistance Services Footnote 8
- Labour Market Partnerships
- Research and Innovation
British Columbia has the flexibility to adapt EBSMs to its provincial context as long as they are consistent with Part II of the EI Act Footnote 9.
The objective of EBSMs is to assist individuals to obtain or keep employment through various active employment programs, including training or employment assistance services. Successful delivery of EBSMs is expected to result in participants receiving needed services, a quick return to work, and savings to the EI account.
Programs and services examined in this study include employment benefits and support measures.
Employment benefits
Employment benefits programs and services examined in this study include:
Training Services help participants obtain employment skills by giving them financial assistance in order to attend classroom training. It can include adult-based education, literacy and essential skills, language training, short-term training and occupational training leading to certification from an accredited institution.
Wage Subsidy Work Experience Placement (WSWEP) helps participants obtain on-the-job work experience by providing employers with a wage subsidy. The average duration of a subsidy is 44 weeks for EI active claimants, and 35 weeks for former claimants.
Job Creation Partnerships (JCP) support projects that provide eligible participants with opportunities to gain meaningful work experience while providing community benefit.
Self-Employment assists participants in creating employment for themselves by providing them with a range of services including assistance with business plan development, counselling, coaching and mentoring, entrepreneurial training and workshops.
Support measures
Support measures programs and services examined in this study include:
Employment Assistance Services (EAS) support individuals as they prepare to enter or re-enter the workforce or assist them to find a better job. Services can include individual counselling, action planning, help with job search skills, job-finding clubs, job placement services, case management and follow-up, and the provision of labour market information. These services are light touch interventions due to their very short duration and can be provided on a one-on-one basis or in a group setting. A typical intervention lasts less than 1 day, but a participant may receive multiple short interventions over a few weeks. These services are generally provided in combination with more intensive interventions.
Labour Market Partnerships assist employers, communities or economic sectors and regions to address their labour force adjustments and human resource needs. They include a wide range of funded activities, such as:
- engagement
- labour market and human resource research
- development, piloting, and evaluation of workforce strategies
- labour force adjustment including skills development of workers facing a loss of employment
- building awareness about the labour market
- sharing labour market and human resource information
Research and Innovation funds research and innovative projects to examine untried and untested solutions to:
- address specific labour market issues
- help unemployed individuals to join the labour force
- inform development of policies, programs or industry practices and their integration in the WorkBC employment services
Eligible participants covered in this study
The incremental impacts are estimated for active and former EI claimants:
- active claimants are participants who started an EBSM intervention while collecting EI benefits
- former claimants are participants who started an EBSM intervention up to 3 years after the end of their EI benefits Footnote 10
Average EBSM share of funding and cost per Action Plan Equivalent
Table 1 provides an overview of the share of funding allocated to EBSMs and the average cost per participant. It is noted that the average cost per participant is calculated based on the 2010 to 2012 data from the EI Monitoring and Assessment Reports. The 2010 to 2012 period corresponds with the cohort of participants selected for incremental impacts and cost-benefit analysis in the LMDA evaluation.
From the 2010 to 2012 time period to the 2020 to 2021 fiscal year, investments in EAS decreased by 25 percentage points, and those in Self-Employment decreased by 5 percentage points. The largest increase in investments went to Training Services, which saw its share of funding increase by 23 percentage points.
| Employment Benefits and Support Measures | Share of funding (2010 to 2012 years) | Share of funding (year 2020 to 2021) | Average cost – Active claimants (2010 to 2012) |
Average cost – Former claimants (2010 to 2012) |
|---|---|---|---|---|
| Training Services | 38% | 61% | $9,665 | $10,071 |
| Employment Assistance Services | 42% | 17% | $1,095 | $1,095 |
| Labour Market Partnerships | 3% | 4% | n/a | n/a |
| Self-Employment | 10% | 5% | $22,447 | $22,570 |
| Wage Subsidy Work Experience Placement | 6% | 8% | $10,270 | $9,717 |
| Job Creation Partnerships | 1% | 3% | $21,006 | $20,091 |
| Research and Innovation | 0% | 2% | n/a | n/a |
| Total | 100% | 100% | n/a | n/a |
Sources: EI Monitoring and Assessment Reports for fiscal years 2010 to 2011, 2011 to 2012, and 2020 to 2021.
Methodology
This section presents key aspects of the quantitative analyses carried out as part of the LMDA studies.
All quantitative analyses are based on administrative data from the EI Part I (EI claim data) and Part II (EBSM participation data). The EI Part I and II data are then linked to the T1 and T4 taxation files from the Canada Revenue Agency. Incremental impact and cost-benefit analyses are based on up to 100% of participants in British Columbia who began their EBSM participation in 2010 to 2012.
The 2010 to 2012 timeframe was selected in order to assess the impacts of EBSMs in the years following participation. Impacts were assessed over a period of at least 4 years after program completion up to the 2017 calendar year (most recent available information at the time of this evaluation).
Incremental impacts analysis Footnote 13
Program effectiveness is assessed by estimating the incremental impacts from EBSM participation on participants’ labour market experience. That is, earnings from employment and self-employment, incidence of employment, use of EI, use of social assistance (SA), and dependence on government income supports after participation.
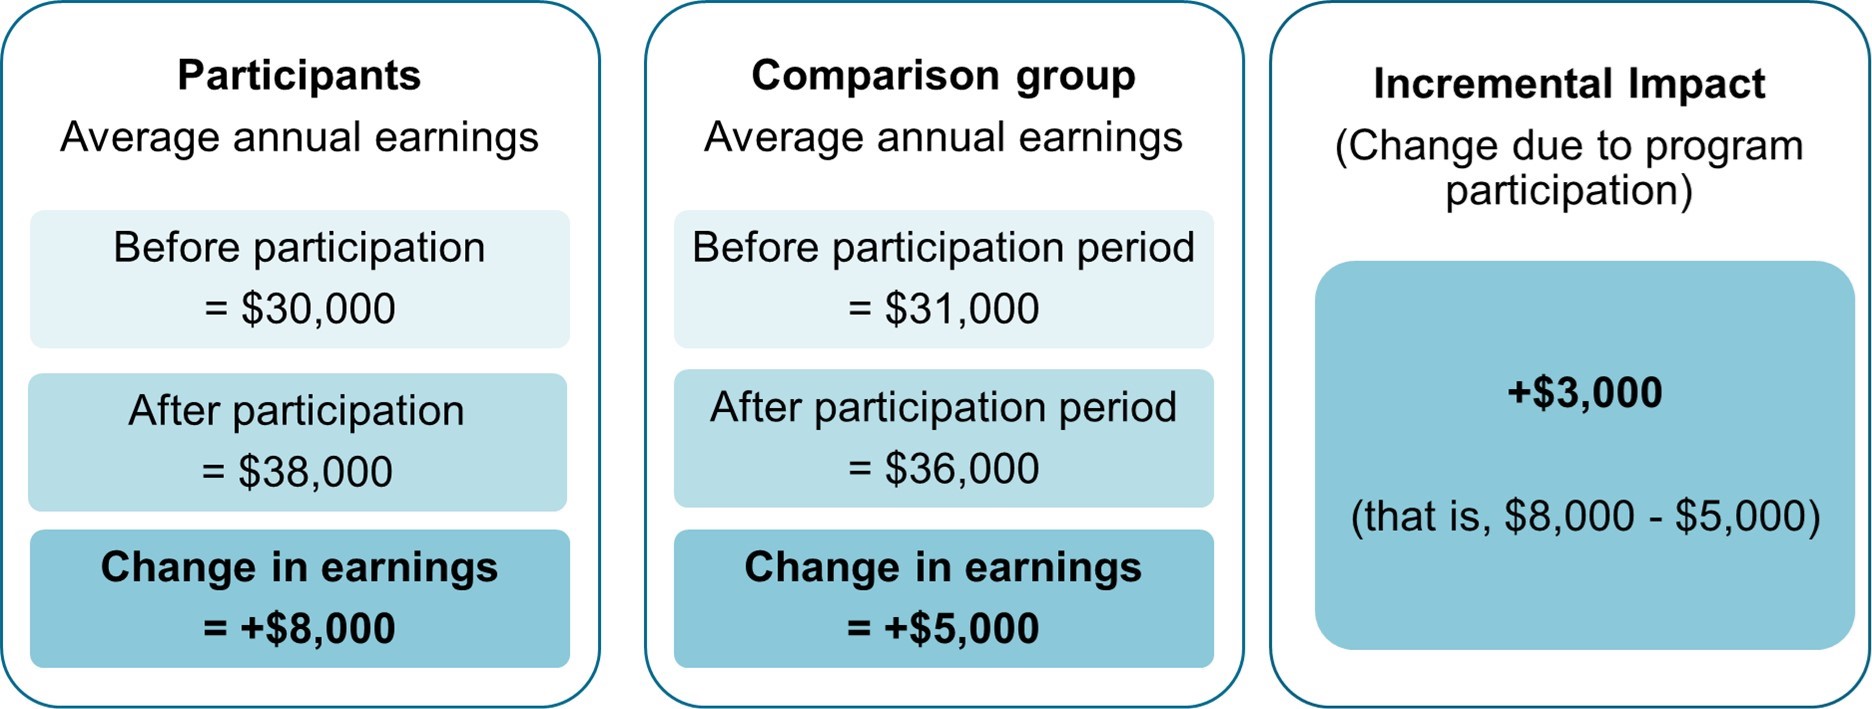
The role of the incremental impact analysis is to isolate the effects of participation from other factors. In order to achieve this, the incremental impact analysis compares the labour market experience of participants before and after their participation with that of similar non-participants. Figure 1 presents an example of incremental impact calculation.
Figure 1. Example of the incremental impact calculation
Text description – Figure 1
Incremental impacts are the difference in the pre-post participation outcomes between participants and similar non-participants.
For example:
- if the average annual earnings of participants are $30,000 before participation and $38,000 after participation, the change in earning for participants is an increase of $8,000
- if the average annual earnings in the comparison group are $31,000 before participation and $36,000 after participation, the change in earnings for the comparison group is an increase of $5,000
- the incremental impact, that is the change attributed to program participation, is $8,000 minus $5,000, which equals an increase of $3,000
The main estimator used is propensity score kernel matching technique combined with difference-in-differences estimator. Moreover, 3 different state-of-the-art estimation techniques (Inverse Probability Weighting, Nearest Neighbour and Cross-sectional Matching) were carried out separately for each type of EBSMs and EI claimants in order to validate the impact estimates.
As for previous LMDA evaluation studies, the Action Plan Equivalent is the unit of analysis used. Action Plan Equivalents regroup all EBSMs received by an individual within less than 6 months between the end of one EBSM and the start of the next. Action Plan Equivalents are categorized based on the longest EBSM they contain, except for EAS-only Action Plan Equivalents which include only EAS interventions.
The matching of participants and comparison group members used up to 75 socio-demographic and labour market variables observed over 5 years before participation. Two different comparison groups were used to measure impacts for active and former EI claimants.
For active claimants, incremental impacts were measured relative to a comparison group of active EI claimants who were eligible to, but did not, participate in LMDA-funded EBSMs during the reference period.
For former claimants, the comparison group was created using individuals who participated in EAS only during the reference period Footnote 14. In other words, the experience of former claimants in Training Services, WSWEP, and JCP interventions is compared to the experience of former claimants who only received EAS. This is a conservative approach given the fact that participation in EAS-only interventions can lead to limited effects on labour market outcomes.
Due to this difference in measurement, incremental impacts estimated for active claimant participants should not be directly compared to those of former claimant participants.
Impacts are generated over 4 years for Training Services, JCP and WSWEP, while a fifth year is estimated for participants in EAS Footnote 15.
Factors accounted for in the cost-benefit analysis Footnote 16, Footnote 17
Building on the results of the incremental impacts, program efficiency is assessed through a cost-benefit analysis. The analysis compares the participants’ cost of participating and the government’s cost of delivering the program to the benefits associated with program. Overall, this analysis provides insights on the extent to which the program is efficient for the society (that is, for both participants and the government).
Sources of data and information
The analysis takes into account all the quantifiable costs and benefits directly related to EBSM delivery and participation that can be measured given the data available. The analysis is comprehensive in that it accounts for the vast majority of possible direct costs and benefits. However, the analysis does not account for all costs and benefits. For example, there are factors that can lead to an understatement of the benefits (for example, positive spillovers to other family members) and other factors that can lead to an overstatement of the benefits (for example, effects on skill prices or displacement).
This study relied on integrated data from the EI Part I and II Databank and Income Tax records from the Canada Revenue Agency. Information about earnings, use of EI, and use of SA was taken from the study of incremental impacts Footnote 18. The program costs were calculated using information available in the EI Monitoring and Assessment Reports.
Relative to the previous cycle of evaluation, the methodology has been extended to incorporate one of the indirect health benefits associated with increased labour market attachment. In particular, the methodology includes an estimate of the change in public health care cost due to the decline in health care utilization resulting from program participation.
Data on average public healthcare costs by income quintile are taken from the report Lifetime Distributional Effects of Publicly Financed Health Care in Canada (2013) by the Canadian Institute for Health Information.
Program costs are measured using information on LMDA expenditures and new interventions reported in the EI Monitoring and Assessment Report. Other costs and benefits are assessed using integrated administrative data from the EI Part I and II databank and the Canada Revenue Agency.
Incremental impacts measured over the second year of participation and up to 5 post-program years are discounted by 3% to bring them to a common base with the program cost and benefits incurred in the program start year. This 3% rate accounts for the interest the government could have collected if the funds used to pay for the program had been invested. Incremental impacts are estimated using 2010 constant dollars and this accounts for inflation.
The costs and benefits accounted for in the calculations
Program cost: cost incurred by the government for delivering the program (that is, administration and direct program costs calculated from data reported in the EI Monitoring and Assessment Reports).
Marginal social cost of public funds: loss incurred by society when raising additional revenues such as taxes to fund government spending. The value is estimated at 20% the program cost, sales taxes, income taxes, impacts on EI and impacts on SA paid or collected by the government.
Foregone earnings: estimated net impacts on participants’ earnings during the participation period. During labour market program participation, some individuals have lower earnings than what they would have received if they had not participated.
Employment earnings: incremental impacts on participants’ earnings during and after participation. In-program earnings represent the foregone earnings for participants.
Fringe benefits: the employer-paid health and life insurance as well as pension contributions. They are estimated at 15% of the incremental impacts on earnings.
Federal and provincial income taxes: incremental impacts on federal, provincial taxes paid by participants.
Sales taxes: the sales taxes paid by participants estimated as incremental impacts on earnings multiplied by the propensity to consume (97%), the proportion of household spending on taxable goods and services (52%) and the total average federal and provincial sales tax rate (11%).
Social assistance and Employment Insurance benefits collected: incremental impacts on SA and EI benefits use by participants following participation.
Canada Pension Plan contribution and Employment Insurance premiums: these contributions and premiums were identified from the Canada Revenue Agency data and then, the incremental impacts on Canada Pension Plan contributions and EI premiums were estimated.
Public health care costs savings: estimated impact of participation in EBSMs on public health care costs shown as an average change per participant over the post-program period examined.
Strengths and limitations of the studies
One of the key strengths from the studies is that all quantitative analyses are based on administrative data rather than survey responses. Compared to survey data, administrative data are not subject to recall errors or response bias.
The propensity score models used to match participants and non-participants for the incremental impact analyses are judged to be robust. In part this is because they were based on 5 years of pre-participation data. Moreover, these models are based on a vast array of variables including sociodemographic characteristics, location, skill level related to last occupation, and indicators of labour market attachment.
However, the matching process can be further refined for specific subgroups if the following information is available in the future:
- persons with disabilities: the type and severity of the disability, and the capacity/willingness to work full-time
- recent immigrants: the country of origin, the proficiency in English or French, and the relevance of credentials and work experience
- visible minorities: place of birth; individuals who are born outside of Canada face different challenges compared to those born in Canada
Refining the matching process for population subgroups could broaden the scope for greater Gender-based Analysis Plus.
Sensitivity analysis and the use of alternative estimation methods have increased confidence in the incremental impact estimates. However, 1 limitation with the propensity score matching techniques is that no one can be fully sure the impacts are not influenced by factors not captured in the data.
The cost-benefit analysis accounted for all quantifiable costs and benefits directly attributable to the EBSMs and could be estimated with the available administrative data. It is furthered strengthened by incorporating one of the indirect benefits, which is the change in public health care expenditures associated with program participation. However, the analysis did not account for non-quantifiable factors that can lead to an understatement of the benefits (for example, positive spillovers to other family members) and factors that can lead to an overstatement of the benefits (for example, effects on skill prices or displacement).
In some studies that use qualitative data collection methods, the number of key informants interviewed is relatively small. Responses provided by key informants reflect their own experience and their own region and may not be fully representative of the entire province.
Overview of the studies summarized in this report
The findings in this report are drawn from 8 separate studies:
- Examination of the medium-term outcomes from 2010 to 2017
- Estimation of the medium-terms incremental impacts from 2010 to 2017
- Cost-Benefit Analysis of Employment Benefits and Support Measures in British Columbia
- Cost-Benefit Analysis of Employment Benefits and Support Measures in British Columbia: Incorporating Public Health Care Costs Savings in the Context of the Labour Market Programs Evaluation
- Design and delivery of the Job Creation Partnerships program in British Columbia
- Design and delivery of the Self-Employment Services in British Columbia
- Design and delivery of the Labour Market Partnerships program in British Columbia
- Design and delivery of the Research and Innovation Support measure in British Columbia
Using a mix of qualitative and quantitative methods, these studies examine issues related to program effectiveness, efficiency, and design and delivery. Appendix A presents an overview of each study.
Evaluation findings
Profile of participants
Between 2010 and 2012, nearly 78,100 EI active and former claimants participated in LMDA-funded programs and services in British Columbia.
The profile of participants is presented in Table 2. It includes their gender, age, sociodemographic group, and marital status, educational attainment, occupation and industry. Information about their educational attainment, occupation and industry is based on the last job they held prior to applying for EI benefits. Information about sociodemographic groups is self-reported.
| Categories | Active claimants | Former claimants |
|---|---|---|
| Number of participants | 45,706 | 32,356 |
| Gender: Female | 61% | 56% |
| Gender: Male | 39% | 44% |
| Age: 30 and under | 25% | 28% |
| Age: 31 to 54 | 61% | 59% |
| Age: 55 and over | 14% | 13% |
| Sociodemographic group: Indigenous people | 8% | 13% |
| Sociodemographic group: Persons with disabilities | 11% | 16% |
| Sociodemographic group: Visible minorities | 11% | 12% |
| Sociodemographic group: Recent immigrants | 5% | 4% |
| Marital status: Single | 42% | 47% |
| Marital status: Married or common-law | 40% | 32% |
| Marital status: Widow / divorced / separated | 14% | 14% |
| Education or skills level: High school or occupational training | 38% | 36% |
| Education or skills level: On-the-job training | 20% | 26% |
| Education or skills level: College, vocational education or apprenticeship training | 30% | 28% |
| Education or skills level: University degree | 5% | 4% |
Note: Values may not equal 100% due to rounding or missing information.
Top 3 occupational groups for EBSMs participants Footnote 19
Active claimants:
- intermediate sales and service personnel; semi-skilled manual workers = 13% each
- other manual workers; clerical personnel = 12% each
- other sales and service personnel; skilled crafts and trades workers = 9% each
Former claimants:
- other manual workers = 14%
- intermediate sales and service personnel; semi-skilled manual workers = 13% each
- other sales and service personnel = 11%
Top 3 industries for EBSMs participants Footnote 20
Active claimants:
- retail trade = 12%
- construction = 11%
- manufacturing = 10%
Former claimants:
- construction = 13%
- retail trade = 12%
- accommodation and food services; manufacturing = 11% each
As presented in Table 3, in the year before program participation, former claimants had lower levels of employment and annual earnings than active claimants. Former claimants also had a higher dependence on SA.
| Pre-EBSM participation employment characteristics | Active claimants | Former claimants |
|---|---|---|
| Average employment earnings | $26,713 | $11,916 |
| Percentage employed | 99% | 80% |
| Percentage on SA | 5% | 20% |
Incremental impacts for active and former EI claimants Footnote 21
Main findings
Overall, incremental impacts demonstrate that participation in most EBSMs improves labour market attachment and reduces dependence on government income supports compared to similar non-participants.
A subgroup analysis shows Training Services, WSWEP, and EAS improve the labour market attachment and reduced the dependence on income support for female, male, and youth participants. Where participant numbers were sufficient to enable statistically significant incremental impact analysis, these programs also improved the labour market outcomes of older, Indigenous, recent immigrant, and visible minority participants.
A regional analysis of incremental impacts for Training Services found that participants in the north and south regions, as well as those in Vancouver increased their labour market attachment and reduced their dependence on government income support. Participants in Victoria increased their labour market attachment.
The social benefits of participating in EBSMs exceeds the costs of investments over time for active claimants and for former claimants who participate in Training Services.
Incidence of employment
Chart 1 presents the incremental impacts on the incidence of employment for active and former claimants by type of program Footnote 22. The estimates can be interpreted as a change in the probability of being employed following participation.
Active claimant participants in Training Services, WSWEP, and EAS increased their incidence of employment relative to similar non-participants. Former claimant participants in Training Services, WSWEP increased their incidence of employment relative to similar participants who only received EAS.
Chart 1. Change in probability of being employed in participants relative to non-participants (annual average)
Note: Impacts are estimated over 4 post-program years (or 5 years in the case of EAS).
* The annual average impact is not statistically significant.
Chart 1 text description
| Program name | Incidence of employment for active claimants (percentage points) |
Incidence of employment for former claimants (percentage points) |
|---|---|---|
| Training Services | 7.3 | 5.5 |
| Wage Subsidy Work Experience Placement | 7.5 | 7.4 |
| Employment Assistance Services | 3.5 | n/a |
| Job Creation Partnerships | n/a | -1.8* |
Note: Impacts are estimated over 4 post-program years (or 5 years in the case of EAS).
* The annual average impact is not statistically significant.
Employment earnings
Chart 2 presents the average annual change in employment earnings for active and former EI claimants over the 4 years post-participation.
Active EI claimant participants in Training Services, WSWEP, and EAS increased their employment earnings compared to similar non-participants. Former EI claimant participants in Training Services and WSWEP have higher earnings relative to similar participants who only received EAS.
Chart 2. Annual employment earnings of participants relative to non-participants (annual average)

Note: Impacts are estimated over 4 post-program years (or 5 years in the case of EAS).
* The annual average impact is not statistically significant.
Chart 2 text description
| Program name | Employment earnings of active claimants | Employment earnings of former claimants |
|---|---|---|
| Training Services | $5,345 | $3,990 |
| Wage Subsidy Work Experience Placement | $4,678 | $4,400 |
| Employment Assistance Services | $1,474 | n/a |
| Job Creation Partnerships | n/a | $111* |
Note: Impacts are estimated over 4 post-program years (or 5 years in the case of EAS).
* The annual average impact is not statistically significant.
Use of EI benefits
As shown in Chart 3, Former claimant participants in Training Services and WSWEP increased their use of EI compared to similar participants who only received EAS. The increased use of EI among participants in these 2 programs is consistent with previous evaluations and is not necessarily a negative impact given the increase in their incidence of employment and annual earnings. Following participation, former claimants are likely to requalify for EI benefits due to their stronger labour market attachment demonstrated by increases in their incidence of employment and annual earnings.
Chart 3. Change in the use of EI benefits (annual average)

Note: Impacts are estimated over 4 post-program years (or 5 years in the case of EAS).
1 The annual average impact is not statistically significant. However, active EI claimants in Training Services had a statistically significant decrease in the use of EI benefits of $175 in year 1 post-program participation followed by an increase of $159 in the year 2 post-program participation.
Chart 3 text description
| Program name | Use of EI benefits for active claimants | Use of EI benefits for former claimants |
|---|---|---|
| Training Services | $201 | $220 |
| Wage Subsidy Work Experience Placement | -$34 | $211 |
| Employment Assistance Services | -$187 | n/a |
| Job Creation Partnerships | n/a | $734 |
Note: Impacts are estimated over 4 post-program years (or 5 years in the case of EAS).
1 The annual average impact is not statistically significant. However, active EI claimants in Training Services had a statistically significant decrease in the use of EI benefits of $175 in year 1 post-program participation followed by an increase of $159 in the year 2 post-program participation.
Use of SA benefits
As shown in Chart 4, active and former EI claimant participants in Training Services and WSWEP decreased their use of SA benefits in the post-program period.
Chart 4. Change in the use of SA benefits (annual average)

Note: Impacts are estimated over 4 post-program years (or 5 years in the case of EAS).
* The annual average impacts are not statistically significant.
Chart 4 text description
| Program name | Use of SA benefits for active claimants | Use of SA benefits for former claimants |
|---|---|---|
| Training Services | -$92 | -$288 |
| Wage Subsidy Work Experience Placement | -$196 | -$365 |
| Employment Assistance Services | $5* | n/a |
| Job Creation Partnerships | n/a | -$55* |
Note: Impacts are estimated over 4 post-program years (or 5 years in the case of EAS).
* The annual average impacts are not statistically significant.
Dependence on income support
As shown in Chart 5, active claimant participants in Training Services, WSWEP, and EAS reduced their dependence on government income supports. Former claimant participants in Training Services and WSWEP also reduced their dependence on government income supports compared to participants who only received EAS. The estimates can be interpreted as a change in the probability of receiving EI or SA benefits following participation.
Chart 5. Change in dependence on government income support (annual average)
Note: Impacts are estimated over 4 post-program years (or 5 years in the case of EAS).
* The annual average impact is not statistically significant.
Chart 5 text description
| Program name | Dependence on government income support for active claimants (percentage points) |
Dependence on government income support for former claimants (percentage points) |
|---|---|---|
| Training Services | -1.9 | -2 |
| Wage Subsidy Work Experience Placement | -2.7 | -2.6 |
| Employment Assistance Services | -1 | n/a |
| Job Creation Partnerships | n/a | 1.9* |
Note: Impacts are estimated over 4 post-program years (or 5 years in the case of EAS).
* The annual average impact is not statistically significant.
Incremental impacts by subgroups of participants
Female participants
Main findings
- Female active and former EI claimant participants in Training Services and WSWEP, as well as active claimant participants in EAS, improved their labour market attachment by increasing in their average incidence of employment and annual earnings
- With the exception of female former claimant participants in WSWEP, participants also decreased their dependence on government income support
Between 2010 and 2012, nearly 45,800 of participants in British Columbia were female, representing nearly 59% of participants.
The profile of female participants is presented in Table 4. It includes their age, sociodemographic group, and marital status, educational attainment, occupation and industry. Information about their educational attainment, occupation and industry is based on the last job they held prior to applying for EI benefits. Information about sociodemographic groups is self-reported.
| Categories | Active claimants | Former claimants |
|---|---|---|
| Number of participants | 27,666 | 18,109 |
| Age: 30 and under | 24% | 29% |
| Age: 31 to 54 | 62% | 59% |
| Age: 55 and over | 14% | 12% |
| Sociodemographic group: Indigenous people | 7% | 11% |
| Sociodemographic group: Persons with disabilities | 9% | 14% |
| Sociodemographic group: Visible minorities | 12% | 14% |
| Sociodemographic group: Recent immigrants | 5% | 5% |
| Marital status: Single | 39% | 42% |
| Marital status: Married or common-law | 41% | 36% |
| Marital status: Widow / divorced / separated | 17% | 17% |
| Education or skills level: High school or occupational training | 41% | 42% |
| Education or skills level: On-the-job training | 17% | 22% |
| Education or skills level: College, vocational education or apprenticeship training | 27% | 24% |
| Education or skills level: University degree | 5% | 5% |
Note: Values may not equal 100% due to rounding or missing information.
Top 3 occupational groups for EBSMs participants Footnote 23
Active claimants:
- intermediate sales and service personnel = 17%
- clerical personnel = 16%
- other sales and service professionals = 10%
Former claimants:
- intermediate sales and service personnel = 19%
- clerical personnel; other sales and service professionals = 14% each
- other manual workers = 9%
Top 3 industries for EBSMs participants Footnote 24
Active claimants:
- retail trade = 13%
- accommodation and food services = 10%
- health care and social assistance = 9%
Former claimants:
- retail trade; accommodation and food services = 14% each
- health care and social assistance = 9%
- administrative and support, waste management and remediation services, manufacturing = 8%
Table 5 presents detailed incremental impacts for female participants.
For example, the results reveal that relative to similar female non-participants, active claimants who participated in Training Services had higher annual average earnings (+ $5,006 per year) and incidence of employment (+ 6.8 percentage points). They also depended less on government income support (- 2.6 percentage points), mostly by decreasing their use SA benefits (- $151 per year).
Compared to similar participants who only received EAS, former EI claimants who participated in WSWEP had higher annual average earnings (+ $3,323 per year) and incidence of employment (+ 6.5 percentage points). Their use of EI benefits increased (+ $307 per year), while their use of SA benefits decreased (- $297 per year). Overall, the estimates for dependence on government income support were not statistically significant.
| Indicator | Training Services Active claimants | Training Services Former claimants | WSWEP Active claimants | WSWEP Former claimants | EAS Active claimants |
|---|---|---|---|---|---|
| Incidence of employment (percentage points) | 6.8*** | 6.9*** | 7.6*** | 6.5*** | 4.7*** |
| Employment earnings ($) | 5,006*** | 3,161*** | 4,416*** | 3,323*** | 2,176*** |
| EI benefits ($) | -40 | 1501 | -64 | 307*** | -149*** |
| SA benefits ($) | -151*** | -350*** | -129** | -297*** | -10 |
| Dependence on income support (percentage points) | -2.6*** | -2.8*** | -2*** | -1.3 | -0.9*** |
| n= | 3,083 | 1,363 | 1,167 | 941 | 23,281 |
Statistical significance level *** 1%; ** 5%; * 10%, other values are not statistically significant.
Note: Impacts are estimated over 4 post-program years (or 5 years in the case of EAS).
1 The annual average impact is not statistically significant. However, former EI claimants in Training Services had statistically significant increases in their use of EI benefits of $245 and $287 in years 1 and 4 respectively post-program participation.
Male participants
Main findings
- Incremental impacts reveal that male active and former claimant participants in Training Services, WSWEP, as well as active claimant participants in EAS improved their labour market attachment by increasing their average incidence of employment and annual earnings
- They also decreased their dependence on government income supports
Between 2010 and 2012, nearly 32,300 participants in British Columbia were male, representing about 41% of participants.
The profile of male participants is presented in Table 6. It includes their age, sociodemographic group, marital status, educational attainment, occupation and industry. Information about their educational attainment, occupation and industry is based on the last job they held prior to applying for EI benefits. Information about sociodemographic groups is self-reported.
| Categories | Active claimants | Former claimants |
|---|---|---|
| Number of participants | 18,040 | 14,247 |
| Age: 30 and under | 26% | 28% |
| Age: 31 to 54 | 60% | 58% |
| Age: 55 and over | 14% | 14% |
| Sociodemographic group: Indigenous people | 10% | 15% |
| Sociodemographic group: Persons with disabilities | 12% | 18% |
| Sociodemographic group: Visible minorities | 9% | 9% |
| Sociodemographic group: Recent immigrants | 4% | 3% |
| Marital status: Single | 46% | 54% |
| Marital status: Married or common-law | 39% | 27% |
| Marital status: Widow / divorced / separated | 10% | 10% |
| Education or skills level: High school or occupational training | 32% | 30% |
| Education or skills level: On-the-job training | 25% | 30% |
| Education or skills level: College, vocational education or apprenticeship training | 33% | 33% |
| Education or skills level: University degree | 4% | 3% |
Note: Values may not equal 100% due to rounding or missing information.
Top 3 occupational groups for EBSMs participants
Active claimants:
- semi-skilled manual workers = 21%
- other manual workers = 18%
- skilled crafts and trades = 16%
Former claimants:
- other manual workers = 22%
- semi-skilled manual workers = 20%
- skilled crafts and trades workers = 18%
Top 3 industries for EBSMs participants Footnote 26
Active claimants:
- construction = 19%
- manufacturing = 13%
- retail trade = 9%
Former claimants:
- construction = 21%
- manufacturing = 13%
- administrative and support, waste management and remediation services; retail trade = 9% each
Table 7 presents detailed incremental impacts for male participants.
For example, the results reveal that relative to similar male non-participants, active EI claimants who participated in Training Services had higher annual average earnings (+ $7,625 per year) and incidence of employment (+ 7.2 percentage points). They also depended less on governmental income support (- 2.3 percentage points).
Compared to similar participants who only received EAS, male former claimant participants in WSWEP had higher annual average earnings (+ $5,312 per year) and incidence of employment (+ 6.7 percentage points). They also depended less on governmental income support (- 2.3 percentage points), by decreasing their use of SA benefits (- $238 per year).
| Indicator | Training Services Active claimants | Training Services Former claimants | WSWEP Active claimants | WSWEP Former claimants | EAS Active claimants |
|---|---|---|---|---|---|
| Incidence of employment (percentage points) | 7.2*** | 6*** | 9*** | 6.7*** | 1.7*** |
| Employment earnings ($) | 7,625*** | 5,496*** | 5,072*** | 5,312*** | 920*** |
| EI benefits ($) | 12 | 223* | -48 | 72 | -256*** |
| SA benefits ($) | -54 | -368*** | -155** | -238** | 13 |
| Dependence on income support (percentage points) | -2.3*** | -3.1*** | -3.4*** | -2.3** | -1.1*** |
| n= | 2,343 | 1,106 | 851 | 791 | 14,664 |
Statistical significance level *** 1%; ** 5%; * 10%, other values are not statistically significant.
Note: Impacts are estimated over 4 post-program years (or 5 years in the case of EAS).
Youth participants
Main findings
- Incremental impacts reveal that youth active and former claimants who participated in Training Services and WSWEP, as well as active claimant participants in EAS, improved their labour market attachment by increasing their annual average earnings and incidence of employment
- They also decreased their dependence on government income supports
Between 2010 and 2012, nearly 20,600 participants in British Columbia were 30 years of age or younger at the start of their participation, representing about 26% of participants.
The profile of youth participants is presented in Table 8. It includes their gender, sociodemographic group, marital status, educational attainment, occupation and industry. Information about their educational attainment, occupation and industry is based on the last job they held prior to applying for EI benefits. Information about sociodemographic groups is self-reported.
| Categories | Active claimants | Former claimants |
|---|---|---|
| Number of participants | 11,402 | 9,157 |
| Gender: Female | 58% | 57% |
| Gender: Male | 42% | 43% |
| Sociodemographic group: Indigenous people | 9% | 15% |
| Sociodemographic group: Persons with disabilities | 7% | 11% |
| Sociodemographic group: Visible minorities | 6% | 7% |
| Sociodemographic group: Recent immigrants | 4% | 3% |
| Marital status: Single | 70% | 69% |
| Marital status: Married or common-law | 23% | 21% |
| Marital status: Widow / divorced / separated | 4% | 5% |
| Education or skills level: High school or occupational training | 36% | 36% |
| Education or skills level: On-the-job training | 27% | 32% |
| Education or skills level: College, vocational education or apprenticeship training | 28% | 26% |
| Education or skills level: University degree | 3% | 3% |
Note: Values may not equal 100% due to rounding or missing information.
Top 3 occupational groups for EBSMs participants Footnote 28
Active claimants:
- other manual workers = 17%
- intermediate sales and service personnel; semi-skilled manual workers = 13% each
- clerical personnel = 11%
Former claimants:
- other manual workers = 18%
- intermediate sales and service personnel = 15%
- other sales and service professionals = 13%
Top 3 industries for EBSMs participants Footnote 29
Active claimants:
- construction = 15%
- retail trade = 12%
- accommodation and food services = 10%
Former claimants:
- retail trade; accommodation and food services; construction = 14% each
- manufacturing = 9%
- administrative and support, waste management and remediation services = 8%
Table 9 presents the detailed incremental impacts for youth participants.
For example, the results reveal that relative to similar youth non-participants, youth active EI claimants who participated in Training Services improved their labour market attachment by increasing their annual average earning (+ $6,462) and incidence of employment (+ 5.3 percentage points). They also depended less on income support (- 3.2 percentage points) by decreasing their use of SA benefits (- $187).
Compared to similar youth former EI claimants who only participated in EAS, youth former claimants who participated in WSWEP improved their labour market attachment by increasing their annual average earnings (+ $4,962) and incidence of employment (+ 4.6 percentage points). They also depended less on income support (- 2.7 percentage points) by decreasing use of SA benefits (- $330 per year).
| Indicator | Training Services Active claimants | Training Services Former claimants | WSWEP Active claimants | WSWEP Former claimants | EAS Active claimants |
|---|---|---|---|---|---|
| Incidence of employment (percentage points) | 5.3*** | 5.4*** | 7.3*** | 4.6** | 3.5*** |
| Employment earnings ($) | 6,462*** | 4,879*** | 4,345*** | 4,962*** | 2,493*** |
| EI benefits ($) | 9 | 140 | 139 | 103 | -146*** |
| SA benefits ($) | -187*** | -458*** | -169* | -330*** | -39* |
| Dependence on income support (percentage points) | -3.2*** | -3.2*** | -1.9* | -2.7** | -0.9*** |
| n= | 1,538 | 686 | 514 | 492 | 9,218 |
Statistical significance level *** 1%; ** 5%; * 10%, other values are not statistically significant.
Note: Impacts are estimated over 4 post-program years (or 5 years in the case of EAS).
Older worker participants
Main findings
- Incremental impacts revealed that older workers who were active EI claimants and who participated in Training Services and EAS improved their labour market attachment by increasing their annual average employment earnings and incidence of employment
Between 2010 and 2012, nearly 10,600 participants in British Columbia were 55 years of age or older when they began their participation, representing nearly 14% of participants.
The profile of youth participants is presented in Table 10. It includes their gender, sociodemographic group, marital status, educational attainment, occupation and industry. Information about their educational attainment, occupation and industry is based on the last job they held prior to applying for EI benefits. Information about sociodemographic groups is self-reported.
| Categories | Active claimants | Former claimants |
|---|---|---|
| Number of participants | 6,451 | 4,110 |
| Gender: Female | 61% | 53% |
| Gender: Male | 39% | 47% |
| Sociodemographic group: Indigenous people | 5% | 8% |
| Sociodemographic group: Persons with disabilities | 13% | 20% |
| Sociodemographic group: Visible minorities | 13% | 13% |
| Sociodemographic group: Recent immigrants | 3% | 2% |
| Marital status: Single | 22% | 30% |
| Marital status: Married or common-law | 50% | 38% |
| Marital status: Widow / divorced / separated | 25% | 26% |
| Education or skills level: High school or occupational training | 41% | 38% |
| Education or skills level: On-the-job training | 19% | 23% |
| Education or skills level: College, vocational education or apprenticeship training | 27% | 27% |
| Education or skills level: University degree | 5% | 4% |
Note: Values may not equal 100% due to rounding or missing information.
Top 3 occupational groups for EBSMs participants Footnote 31
Active claimants:
- semi-skilled manual workers = 16%
- intermediate sales and service personnel = 14%
- clerical personnel = 12%
Former claimants:
- semi-skilled manual workers = 15%
- intermediate sales and service personnel; other sales and service personnel = 13% each
- clerical personnel; other manual workers; skilled crafts and trades workers = 10% each
Top 3 industries for EBSMs participants Footnote 32
Active claimants:
- retail trade = 13%
- manufacturing = 10%
- construction; administrative and support, waste management and remediation services; health care and social assistance = 8% each
Former claimants:
- manufacturing; construction; retail trade = 11% each
- administrative and support, waste management and remediation services = 10%
- accommodation and food services = 8%
Table 11 presents the detailed incremental impacts for older worker participants.
For example, the results reveal that relative to similar non-participants, older worker active EI claimant participants in Training Services had higher annual average earnings (+ $6,210) and incidence of employment (+ 14.6 percentage points). However, they increased their use of SA following program participation (+ $161 per year).
Relative to similar older worker non-participants, active EI claimants in EAS increased their average annual earnings (+ $2,078) and incidence of employment (+ 8 percentage points). The annual average estimate for dependence on income support was not statistically significant.
| Indicator | Training Services Active claimants | EAS Active claimants |
|---|---|---|
| Incidence of employment (percentage points) | 14.6*** | 8*** |
| Employment earnings ($) | 6,210*** | 2,078*** |
| EI benefits ($) | 128 | 181 |
| SA benefits ($) | 161* | 23 |
| Dependence on income support (percentage points) | 0.8 | -0.3 |
| n= | 494 | 5,623 |
Statistical significance level *** 1%; ** 5%; * 10%, other values are not statistically significant.
Note: Impacts are estimated over 4 post-program years (or 5 years in the case of EAS).
1 The annual average impact on use of EI benefits is not statistically significant over the entire post-program participation period. However, active EI claimants in EAS had a statistically significant decrease in the year 1 post-program participation (- $200) followed by an increase in the year 5 post-program participation (+$159).
Indigenous participants
Main findings
- Incremental impacts for Indigenous active and former EI claimants in Training Services revealed that they improved their labour market attachment by increasing their average incidence of employment and annual earnings
- These participants also depended less on income support
- Indigenous active EI claimant participants in EAS increased their annual average employment earnings and short-term incidence of employment
- These participants also experienced annual average increases in use of SA benefit following program participation
Between 2010 and 2012, nearly 8,000 participants in British Columbia were Indigenous, representing about 10% of participants.
The profile of Indigenous participants is presented in Table 12. It includes their age, gender, marital status, educational attainment, occupation and industry. Information about their educational attainment, occupation and industry is based on the last job they held prior to applying for EI benefits.
| Categories | Active claimants | Former claimants |
|---|---|---|
| Number of participants | 3,719 | 4,201 |
| Gender: Female | 51% | 48% |
| Gender: Male | 49% | 52% |
| Age: 30 and under | 28% | 33% |
| Age: 31 to 54 | 62% | 59% |
| Age: 55 and over | 9% | 8% |
| Marital status: Single | 53% | 58% |
| Marital status: Married or common-law | 30% | 23% |
| Marital status: Widow / divorced / separated | 12% | 11% |
| Education or skills level: High school or occupational training | 35% | 32% |
| Education or skills level: On-the-job training | 29% | 35% |
| Education or skills level: College, vocational education or apprenticeship training | 28% | 26% |
| Education or skills level: University degree | 4% | 3% |
Note: Values may not equal 100% due to rounding or missing information.
Top 3 occupational groups for EBSMs participants Footnote 35
Active claimants:
- other manual workers = 18%
- semi-skilled manual workers = 16%
- intermediate sales and service personnel; other sales and service personnel = 11% each
Former claimants:
- other manual workers = 22%
- semi-skilled manual workers = 14%
- other sales and service personnel = 12%
Top 3 industries for EBSMs participants Footnote 36
Active claimants:
- construction; public administration = 13% each
- accommodation and food services = 9%
- retail trade = 8%
Former claimants:
- construction = 14%
- public administration = 12%
- retail trade; accommodation and food services = 10% each
Table 13 presents the detailed incremental impacts for Indigenous participants.
For example, the results reveal that relative to similar non-participants, Indigenous active EI claimant participants in Training Services improved their labour market attachment by increasing their annual average employment earnings (+ $7,816 per year) and incidence of employment (+ 5.6 percentage points). They also depended less on government income supports (- 2.8 percentage points).
Compared to similar participants who only received EAS, Indigenous former EI claimants in Training Services improved their labour market attachment by increasing their average incidence of employment (+ 6.8 percentage points) and annual earnings (+ $6,123 per year). Participants also depended less on incomes supports (- 3.9 percentage points) by decreasing their use of SA benefits (- $528 per year).
| Indicator | Training Services Active claimants | Training Services Former claimants | EAS Active claimants |
|---|---|---|---|
| Incidence of employment (percentage points) | 5.6*** | 6.8*** | 1.11 |
| Employment earnings ($) | 7,816*** | 6,123*** | 1,395** |
| EI benefits ($) | 166 | 318* | -1252 |
| SA benefits ($) | -88 | -528*** | 204*** |
| Dependence on income support (percentage points) | -2.8*** | -3.9*** | 0.6 |
| n= | 690 | 649 | 2,795 |
Statistical significance level *** 1%; ** 5%; * 10%, other values are not statistically significant.
Note: Impacts are estimated over 4 post-program years (or 5 years in the case of EAS).
1 While the annual average impact on incidence of employment (+ 1.1 percentage points) is not statistically significant, active EI claimants in EAS increased their incidence of employment, with statistically significant results found in year 1 post-program participation (+ 3.3 percentage points).
Persons with disabilities
Main findings
- Persons with disabilities who were former EI claimants and who participated in Training Services improved their labour market attachment by increasing their average incidence of employment and annual earnings
- They also decreased their dependence on government income supports
Between 2010 and 2012, approximately 10,000 of participants in British Columbia self-identified as persons with disabilities, representing nearly 13% of participants.
The profile of persons with disability participants is presented in Table 14. It includes their age, gender, marital status, educational attainment, occupation and industry. Information about their educational attainment, occupation and industry is based on the last job they held prior to applying for EI benefits.
| Categories | Active claimants | Former claimants |
|---|---|---|
| Number of participants | 4,801 | 5,207 |
| Gender: Female | 54% | 50% |
| Gender: Male | 46% | 50% |
| Age: 30 and under | 17% | 20% |
| Age: 31 to 54 | 66% | 64% |
| Age: 55 and over | 17% | 16% |
| Marital status: Single | 49% | 55% |
| Marital status: Married or common-law | 28% | 20% |
| Marital status: Widow / divorced / separated | 18% | 18% |
| Education or skills level: High school or occupational training | 40% | 37% |
| Education or skills level: On-the-job training | 23% | 28% |
| Education or skills level: College, vocational education or apprenticeship training | 28% | 27% |
| Education or skills level: University degree | 3% | 3% |
Note: Values may not equal 100% due to rounding or missing information.
Top 3 occupational groups for EBSMs participants Footnote 38
Active claimants:
- intermediate sales and service personnel; semi-skilled manual workers = 14% each
- other sales and service personnel; clerical personnel = 12% each
- other manual workers = 11%
Former claimants:
- intermediate sales and service personnel; other sales and service personnel = 15% each
- semi-skilled manual workers = 14%
- other manual workers = 13%
Top 3 industries for EBSMs participants Footnote 39
Active claimants:
- retail trade = 13%
- construction; accommodation and food services = 10% each
- manufacturing = 9%
Former claimants:
- retail trade = 14%
- construction; accommodation and food services = 11% each
- administrative and support, waste management and remediation services = 10%
Table 15 presents the detailed incremental impacts for participants with disabilities.
For example, the results reveal that compared to similar participants who only received EAS, persons with disabilities who were former EI claimant participants in Training Services improved their labour market attachment by increasing their average incidence of employment (+ 10.9 percentage points) and annual earnings (+ $4,550). They also depended less on incomes supports (- 4.5 percentage points) due to their decreased use of SA benefits (- $571 per year).
The estimates for person with disabilities who were active EI claimant participants in Training Services were mixed and not statistically significant.
| Indicator | Training Services Active claimants | Training Services Former claimants |
|---|---|---|
| Incidence of employment (percentage points) | 2.2 | 10.9*** |
| Employment earnings ($) | -959 | 4,550*** |
| EI benefits ($) | -139 | 368** |
| SA benefits ($) | 172 | -571** |
| Dependence on income support (percentage points) | -0.2 | -4.5** |
| n= | 630 | 427 |
Statistical significance level *** 1%; ** 5%; * 10%, other values are not statistically significant.
Note: Impacts are estimated over 4 post-program years (or 5 years in the case of EAS).
Recent interviews with 40 service providers working with persons with disabilities reveal that a significant proportion of persons with disability participants are looking or only capable of working on a part-time basis. In fact, the outcome trends reveal that at between 39% and 64% of persons with disabilities earn less than $10,000 per year in the 4 post-program years. Footnote 42
Recent immigrants Footnote 43
Main findings
- Recent immigrants who were active EI claimant participants in EAS improved their labour market attachment by increasing their average incidence of employment and annual earnings
Between 2010 and 2012, nearly 2,200 of the EI active claimant participants in British Columbia were recent immigrants, representing about 3% of active EI claimant participants.
The profile of recent immigrant participants is presented in Table 16. It includes their gender, age, marital status, educational attainment, occupation and industry. Information about their educational attainment, occupation and industry is based on the last job they held prior to applying for EI benefits.
| Categories | Active claimants |
|---|---|
| Number of participants | 2,191 |
| Gender: Female | 65% |
| Gender: Male | 35% |
| Age: 30 and under | 19% |
| Age: 31 to 54 | 72% |
| Age: 55 and over | 9% |
| Marital status: Single | 15% |
| Marital status: Married or common-law | 73% |
| Marital status: Widow / divorced / separated | 11% |
| Education or skills level: High school or occupational training | 37% |
| Education or skills level: On-the-job training | 25% |
| Education or skills level: College, vocational education or apprenticeship training | 24% |
| Education or skills level: University degree | 8% |
Note: Values may not equal 100% due to rounding or missing information.
Top 3 occupational groups for EBSMs participants Footnote 44
Active claimants:
- semi-skilled manual workers = 16%
- other sales and service personnel = 14%
- intermediate sales and service personnel = 11%
Top 3 industries for EBSMs participants Footnote 45
Active claimants:
- manufacturing = 11%
- accommodation and food services; administrative and support, waste management and remediation services = 10% each
- retail trade = 9%
Table 17 presents the detailed incremental impacts for recent immigrant participants.
For example, the results reveal that relative to similar non-participants who were recent immigrants, active EI claimants who participated in EAS improved their labour market attachment by increasing their average incidence of employment (+ 14 percentage points) and annual employment earnings (+ $3,022). Non-statistically significant results were found for the annual average receipt of EI and SA benefits, and dependence on government income supports.
| Indicator | EAS Active claimants |
|---|---|
| Incidence of employment (percentage points) | 14*** |
| Employment earnings ($) | 3,022*** |
| EI benefits ($) | -51 |
| SA benefits ($) | -8 |
| Dependence on income support (percentage points) | 0.3 |
| n= | 1,766 |
Statistical significance level *** 1%; ** 5%; * 10%, other values are not statistically significant.
Note: Impacts are estimated over 4 post-program years (or 5 years in the case of EAS).
Visible minorities
Main findings
- Compared to similar non-participants, visible minority active EI claimant participants in Training Services improved their labour market attachment by increasing their average incidence of employment and annual earnings
Between 2010 and 2012, nearly 5,000 of participants in British Columbia self-identified as visible minorities, representing about 6% of active EI claimant participants.
The profile of visible minority participants is presented in Table 18. It includes their gender, age, marital status, educational attainment, occupation and industry. Information about their educational attainment, occupation and industry is based on the last job they held prior to applying for EI benefits.
| Categories | Active claimants |
|---|---|
| Number of participants | 4,922 |
| Gender: Female | 67% |
| Gender: Male | 33% |
| Age: 30 and under | 15% |
| Age: 31 to 54 | 68% |
| Age: 55 and over | 17% |
| Marital status: Single | 22% |
| Marital status: Married or common-law | 62% |
| Marital status: Widow / divorced / separated | 13% |
| Education or skills level: High school or occupational training | 40% |
| Education or skills level: On-the-job training | 25% |
| Education or skills level: College, vocational education or apprenticeship training | 24% |
| Education or skills level: University degree | 5% |
Note: Values may not equal 100% due to rounding or missing information.
Top 3 occupational groups for EBSMs participants Footnote 47
Active claimants:
- semi-skilled manual workers = 19%
- other sales and service personnel = 14%
- other manual workers; clerical personnel = 11% each
Top 3 industries for EBSMs participants Footnote 48
Active claimants:
- manufacturing = 15%
- accommodation and food services; retail trade; administrative and support, waste management and remediation services = 10% each
- agriculture, forestry, fishing, and hunting = 8%
Table 19 presents the detailed incremental impacts for visible minority participants.
For example, the results found that relative to similar non-participants who were visible minorities, active EI claimant participants in Training Services improved their labour market attachment by increasing their average incidence of employment (+ 13.2 percentage points) and annual earnings (+ $6,673).
| Indicator | Training Services Active claimants |
|---|---|
| Incidence of employment (percentage points) | 13.2*** |
| Employment earnings ($) | 6,673*** |
| EI benefits ($) | 102 |
| SA benefits ($) | -90 |
| Dependence on income support (percentage points) | -0.7 |
| n= | 313 |
Statistical significance level *** 1%; ** 5%; * 10%, other values are not statistically significant.
Note: Impacts are estimated over 4 post-program years (or 5 years in the case of EAS).
Incremental impacts for Training Services by region
Training Service participants in north region of British Columbia Footnote 51
Main findings
- Incremental impacts reveal that active and former EI claimant participants in Training Services in the north region increased their labour market attachment by increasing their annual average earnings and incidence of employment
- Participants also depended less on government income support
Between 2010 and 2012, nearly 1,670 of the participants in Canada-British Columbia LMDA-funded Training Services were located in the north region of the province. Table 20 presents the detailed incremental impacts for participants in this region.
For example, the results reveal that compared to similar non-participants located in the north region of British Columbia, active EI claimant participants in Training Services increased their labour market attachment by increasing their incidence of employment (+ 4.1 percentage points) and annual employment earnings (+ $5,395 per year). They also depended less on government income supports (- 2.5 percentage points).
Relative to similar participants who only received EAS, former EI claimant participants in Training Services in this region improved their labour market attachment by increasing their incidence of employment (+ 5.2 percentage points) and annual employment earning (+ $3,355). They also depended less on government income supports (- 2 percentage points).
| Indicator | Training Services Active claimants | Training Services Former claimants |
|---|---|---|
| Incidence of employment (percentage points) | 4.1*** | 5.2*** |
| Employment earnings ($) | 5,395*** | 3,355*** |
| EI benefits ($) | -127 | 377*** |
| SA benefits ($) | -133** | -238*** |
| Dependence on income support (percentage points) | -2.5*** | -2.0* |
| n= | 1,076 | 592 |
Statistical significance level *** 1%; ** 5%; * 10%, other values are not statistically significant.
Training Service participants in south region of British Columbia Footnote 52
Main findings
- Incremental impacts reveal that active and former EI claimant participants in Training Services in the southern region increased their labour market attachment by increasing their annual average earnings and incidence of employment
- Participants also depended less on government income support
Between 2010 and 2012, nearly 1,410 of the participants in Canada-British Columbia LMDA-funded Training Services were located in the south region of the province. Table 21 presents the detailed incremental impacts for participants in this region.
For example, the results reveal that compared to similar non-participants in the south region of British Columbia, active EI claimant participants in Training Services increased their labour market attachment by increasing their incidence of employment (+ 8 percentage points) and annual employment earnings (+ $6,618 per year). They also depended less on government income supports (- 2.3 percentage points).
Compared to similar participants in the south region of British Columbia who only received EAS, former EI claimant participants in Training Services in this region improved their labour market attachment by increasing their incidence of employment (+ 7 percentage points) and annual employment earnings (+$5,786). They also depended less on government income supports (- 3.8 percentage points).
| Indicator | Training Services Active claimants | Training Services Former claimants |
|---|---|---|
| Incidence of employment (percentage points) | 8*** | 7*** |
| Employment earnings ($) | 6,618*** | 5,786*** |
| EI benefits ($) | 20 | 222 |
| SA benefits ($) | -129** | -469*** |
| Dependence on income support (percentage points) | -2.3*** | -3.8*** |
| n= | 1,027 | 380 |
Statistical significance level *** 1%; ** 5%; * 10%, other values are not statistically significant.
Training Services participants in Vancouver
Main findings
- Incremental impacts reveal that active and former EI claimant participants in Training Services in Vancouver increased their labour market attachment by increasing their annual average earnings and incidence of employment
- Participants also depended less on government income support
Between 2010 and 2012, approximately 1,750 of participants in British Columbia were located in Vancouver. Table 22 presents the detailed incremental impacts for these participants.
For example, the results reveal that compared to similar non-participants in Vancouver, active EI claimants participating in Training Services in the city increased their labour market attachment by increasing their incidence of employment (+ 9.4 percentage points) and annual employment earnings (+ $2,772). They also depended less on government income supports (- 1.6 percentage points).
Relative to similar participants who only received EAS, former EI claimants in the city who participated in Training Services improved their labour market by increasing their incidence of employment (+ 4.4 percentage points) and annual employment earnings (+ $2,096). They also depended less on government income supports (- 2.5 percentage points).
| Indicator | Training Services Active claimants | Training Services Former claimants |
|---|---|---|
| Incidence of employment (percentage points) | 9.4*** | 4.4*** |
| Employment earnings ($) | 2,772*** | 2,096** |
| EI benefits ($) | 51 | 92 |
| SA benefits ($) | -50 | -278*** |
| Dependence on income support (percentage points) | -1.6** | -2.5** |
| n= | 1,092 | 658 |
Statistical significance level *** 1%; ** 5%; * 10%, other values are not statistically significant.
Training Services participants in Victoria Footnote 53
Main findings
- Incremental impacts reveal that active EI claimant participants in Training Services in Victoria increased their labour market attachment by increasing their annual average earnings and incidence of employment
Between 2010 and 2012, nearly 420 of the EI active claimant participants in Training Services in British Columbia were located in Victoria. Table 22 presents the detailed incremental impacts for participants in this city.
For example, the results reveal that compared to similar non-participants, active EI claimants who participated in Training Services in Victoria improved their labour market attachment by increasing their incidence of employment (+ 7.6 percentage points) and annual employment earnings (+ $3,647 per year). The estimates for EI and SA benefits receipt, and dependence on income support were not statistically significant.
| Indicator | Training Services Active claimants |
|---|---|
| Incidence of employment (percentage points) | 7.6*** |
| Employment earnings ($) | 3,647*** |
| EI benefits ($) | 176 |
| SA benefits ($) | -6 |
| Dependence on income support (percentage points) | -1 |
| n= | 417 |
Statistical significance level *** 1%; ** 5%; * 10%, other values are not statistically significant.
Cost-benefit analysis
This analysis is based on the EBSM medium-term incremental impacts previously described in this report. Costs and benefits are examined over the participation period of 1 or 2 years and 5, or 10 years after the end of participation. Footnote 54
The cost-benefit analysis addresses the following questions:
- Are the benefits from EBSMs exceeding the costs within 5 years (for WSWEP, JCP or EAS), or 10 years (for Training Services) after the end of participation?
- How much is the benefit for the government and society if the government spends $1 in EI part II funding?
- How many years does it take the benefits to recover the costs?
The following results are presented from the social perspective, that is, the government and individual perspectives combined. This allows for a sound assessment of program effectiveness in achieving its objectives of helping unemployed individuals to obtain and maintain employment and to generate EI savings.
Table 24 presents the cost-benefit results for active and former EI claimant participants.
| Indicator | Training Services Active claimants (10 years post-program) | WSWEP Active claimants (5 years post-program) | EAS Active claimants (5 years post-program) | Training Services Former claimants (10 years post-program) | WSWEP Former claimants (5 years post-program) | JCP Former claimants (5 years post-program) |
|---|---|---|---|---|---|---|
| Net present value | $34,808 | $15,334 | $3,062 | $27,190 | $19,715 | -$33,763 |
| Benefit cost ratio | $4.60 | $2.49 | $3.80 | $3.70 | $3.03 | -$0.68 |
| Payback period (years after end of participation) | 3.9 | 1.9 | 3.4 | 3.7 | < 11 | n/a2 |
| Social return | 360% | 149% | 280% | 270% | 203% | -168% |
| Savings to public health care | $393 | $273 | $61 | $282 | $252 | -$74 |
* If the benefit-cost ratio is greater than 1, the benefits outweigh the costs. If the ratio is less than 1, the costs outweigh the benefits.
1 Paid back within the program start year.
2 Benefits may never recover the costs.
The information below provides examples of the net present value, the benefit-cost ratio, the payback period, the social rate of return and savings to health care costs.
Training Services Footnote 56
During the 2010 to 2012 period, Training Services represented 38% of EBSM expenditures under the LMDA in British Columbia. The average duration of a Training Services Action Plan Equivalent is 59 weeks for active claimants and 57 weeks for former claimants.
Table 24 includes the cost-benefit analysis results for active and former EI claimant participants in Training Services. For example, over the 10 year post-program period, for active EI claimant participants the benefits exceeded the cost by $34,808, yielding a social return on investment of 360%. This means that if the government spends $1 on Training Services for active EI claimants, it generates $4.60 of benefit to society. It takes 3.9 years post-participation for the benefits to recover the costs of programming. Overall, there is a saving to health care costs of $393 per participant.
Wage Subsidy Work Experience Placement
During the 2010 to 2012 period, WSWEP represents 6% of total LMDA-funded EBSM expenditures In British Columbia. The average duration of a WSWEP Action Plan Equivalent is 44 weeks for active claimants and 35 weeks for former claimants.
Table 24 includes the cost-benefit analysis results for active and former EI claimant participants in WSWEP. For example, over the 5 year post-program period, for former EI claimant participants, the benefits exceeded the cost by $19,715, yielding a social return on investment of 203%. This means that if the government spends $1 on WSWEP for former EI claimant participants, it generates $3.03 of benefit to society. The costs of programming are recovered within the program start year. Overall, there is a saving to health care costs of $252 per participant.
Job Creation Partnerships Footnote 57
During the 2010 to 2012 period, JCP represented 1% of the total EBSM expenditures In British Columbia. For former EI claimant participants, the average duration of a JCP Action Plan Equivalent for is 45 weeks.
In addition to helping participants obtain work experience in the funded projects, JCP also benefits the communities where the projects are implemented. However, community impacts are not accounted for in this cost-benefit analysis since they are not captured in the administrative data and are difficult to quantify. Accordingly, the benefits from the social perspective are likely underestimated.
Table 24 includes the cost-benefit analysis results for former EI claimant participants in JCP. For example, over the 5 year post-program period, for former EI claimant participants, the cost was $33,763 higher than the benefit, yielding a social return on investment of -168%. This means that if the government spends $1 on JCP for former EI claimants, it generates a loss of -$0.68 for society.Footnote 58 The benefits of the program may never recover the costs, and no savings to health care are generated.
Employment Assistance Services Footnote 59
EAS includes a variety of services such as computer access for job search services, group sessions to prepare for an interview, career counselling, and action plan development. The administrative data, however, do not allow to identify what proportion of EAS interventions belong to each category or the intensity of services offered to participants.
While EAS are often provided with other EBSMs, this analysis examined only participants who received 1 or more EAS without participating in other EBSMs. EAS represented about 42% of total EBSM expenditures between 2010 and 2012. The average length of an EAS-only Action Plan Equivalent is 18 weeks compared to between 44 to 59 weeks for active EI claimant participants in other EBSMs.
As shown in Table 24, over the 5 year post-program period the benefits for active claimants in EAS is $3,062 higher than the costs, yielding a social return on investment of 280%. This means that if the government spends $1 on EAS for active EI claimant participants, it generates $3.80 of benefit to society. The costs of programming are recovered 3.4 years post-participation. Overall, there is a saving to health care costs of $61 per participant.
Overall, the goal of EAS is not to help participants acquire more skills, therefore, increasing participants’ earnings after participation is not necessarily expected. Conducting a cost-benefit analysis for EAS is a challenge as it is not possible to attribute a dollar figure to the return to employment. However, including earnings in the cost-benefit calculation is still very relevant since it captures partially the positive impact of the quicker return to work.
Supplemental studies
Self-EmploymentFootnote 60
Program design and delivery
The Self-Employment program aims to assist participants in creating employment for themselves by providing them with a range of services including:
- assistance with business plan development
- counselling, coaching, and mentoring
- entrepreneurial training and workshops
In addition to being EI-eligible, potential participants must:
- demonstrate that they are unable to obtain sustainable employment in the local labour market
- have an Action Plan which identifies Self-Employment as necessary and the most appropriate intervention to support the participant in achieving labour market self-sufficiency
- demonstrate that they lack entrepreneurial skills, training and/or experience, while having entrepreneurial aptitude, sufficient product/service knowledge, and required business start-up contribution
- have experience related to their business concept, so that they are more likely be able to become self-employed and independent
- have a business concept that is viable in the local labour market, and will not negatively impact the community
British Columbia has the flexibility to design and deliver the program to meet its labour market needs. In fall 2018, the program was delivered directly by WorkBC Employment Services and by third party service providers that specialize in entrepreneurship.
British Columbia allocated between 4% and 5% of its LMDA funding to the self-employment program in 5 fiscal years from 2013 to 2019. While spending on Self-Employment program tends to decrease in Canada, it remains stable in British Columbia.
The application process is structured and aims to ensure that participants are suited for self-employment, have a viable business idea and the financial resources to launch a business.
Participants’ employment outcomes
The following is a summary of labour market outcomes and satisfaction rates from a survey of Self-Employment participants in British Columbia completed in winter 2020. Footnote 61 A total of 841 individuals responded, resulting in a 35% response rate. Footnote 62
Self-Employment participants increased their employment level by 16 percentage points from 60% in the year before participating to 76% at the time of survey (that is 2 to 4 years after program participation). The increase is mainly due to an increase in the percentage of self-employed participants.
Type of businesses created, survival rates and success factors
Forty-five percent (45%) of survey respondents launched a self-employment business and it was still in operation in winter 2020 (2 to 4 years following program participation).
- Among the 488 respondents who started a business, 70% of them were still operating their business at 2 to 4 years post-program
- Another 4% sold their business, but it was still operational
- 23% of respondents were unable to maintain the operation of the business they started as part of the program
Half of self-employment businesses were launched in: professional, scientific and technical services; other services; retail trade; and construction.
Factors influencing the success or failure of self-employment businesses
- Participants who started a business and were still in operation at the time of survey attributed their business success to:
- dedication and hard work
- high demand for their product or service
- the quality of service provided
- the Self-Employment program
- their own abilities, experience and knowledge
- their network and business contacts
- Participants who started a business but were forced to close it attributed the closure to:
- the lack of business
- lack of customers
- finding a better opportunity or a job
- lack of financing
- high competition
- Participants who did not launch a business attributed this to:
- insufficient funding
- the risk and lack of stability
- the level of responsibility and stress
- the low level of profit
- finding alternative employment
- family obligations and considerations
Earning outcomes and reliance on income support
Survey respondents were not comfortable answering questions that related to their earnings. This situation made it difficult to compare the pre- and post-earnings of Self-Employment participants.
Overall, there appears to be an increase in the number of participants reporting less than $10,000 in earnings annually. However, survey respondents, who were able to maintain the operation of their business, were more likely than respondents whose business had closed to report earning more or the same as before participating in the program.
As a complement to the earning questions, survey respondents were asked to provide an assessment of their financial well-being. When taking their entire financial situation into consideration:
- 74% of respondents said they were financially about the same or better off after the program when compared to before they started the Self-Employment program
- 70% of respondents said that their household net worth was about the same or higher when compared to before they started the program
In line with survey findings, service providers stated that immediate increases in earnings are not necessarily an expected outcome of the program.
With respect to reliance on government income support, participants reduced their use of EI and SA following program participation.
Satisfaction with services received and current employment
A high percentage of respondents who started a self-employment business report that they are equally or more satisfied with their job situation after program participation. Those who are able to maintain the operation of their business are 33 percentage points more likely to report being more satisfied, compared to those whose business closed (76% compared to 43%).
The survey examined the contribution of the program to the success of self-employment businesses. At least 81% of survey respondents who launched a self-employment business rated the services and training they received as very or somewhat important to the business launch, operation and success. The most highly ranked services were:
- training on budgeting and financial management
- living allowance during participation
- training on marketing
Challenges and lessons learned related to program design and delivery
Key informants identify the following challenges related to program design and delivery, including:
- restrictive eligibility requirements for program participants
- low levels of program marketing and awareness
- restrictive contract provisions for service providers
Best practices related to program design and delivery included:
- using local and specialized organizations to deliver the program
- conducting in-depth assessment of candidates
- tailoring supports to specific needs of participants
- using specialists to deliver tailored training
- providing participants with opportunity to network
- facilitating their knowledge of and access to funding
Key considerations for the Self-Employment program and policy development
The following considerations emerged as part of the study.
Consideration #1: Self-Employment can benefit from an updated objective specifying that it is dedicated to eligible participants who have a viable business idea, the financial or in-kind resources to launch a business, and the required level of dedication
Consideration #2: The data collection process should include only participants who have been deemed suitable for self-employment and accepted into the program. This will require excluding candidates who attended information sessions alone or those deemed not suited for self-employment. The latter participants can be reported under EAS.
Consideration #3: Indicators of program success can include: increase in employment and/or self-employment levels; medium-term increase in earnings; business survival rate similar to the local economy and/or the sector; improvement in job satisfaction; and acquisition of transferable skills.
Rationale
The Self-Employment program aims to assist participants in creating employment for themselves. The participant’s application process is structured and aimed to ensure that they are suited for self-employment, have a viable business idea, and the financial resources to launch a business. However, the survey revealed that:
- more than a third (36%) of participants in British Columbia did not launch a business
- 84 survey respondents from British Columbia confirmed that they did not participate in the program
- nearly one quarter (23%) of participants were unable to maintain the operation of the business they had started as part of the program
Participants who started a business but were forced to close it attributed closure to the lack of business, lack of customers, finding a better opportunity or a job, lack of financing, and high competition. With the exception of the participant obtaining employment, these factors may indicate the need for improvements in training on analysing the target market and obtaining better financing.
Finally, participants who did not launch a business during program participation attributed this to: the lack of funding; the level of uncertainty and risk involved; workload, work-life balance; and underestimating the required commitment. These factors may indicate the need for setting the right expectations for the participants and applicants.
The survey confirmed that participants acquire transferable skills through training and workshops, they experience increase in employment and medium-term earnings, and they create additional jobs. Moreover, business survival rates mirror those observed for small business in the economy. These indicators are useful in measuring and reporting program success as well as managing contribution agreements with service providers.
Job Creation Partnerships Footnote 64
Program objective
The JCP program is designed to support projects that provide unemployed EI-eligible clients with opportunities to gain meaningful work experience while providing community benefits. While project activities are required to be of benefit to both the participant and the community, the primary focus must be on helping the participant to maintain or enhance their employability skills.
JCP is delivered through the provision of funds to organizations that implement a community-benefiting project while providing work experience to participants.
Participants receive benefits from EI Part I or II. Footnote 65 Benefits to participants follow the prevailing wage rate, up to the maximum EI weekly benefit rate. Participants may receive an additional wage top up from the sponsor/employer.
Program delivery
The design and delivery of JCP allows British Columbia to address a variety of barriers to employment experienced by its residents (For example, lack of work experience). JCP can also be used to address labour market needs by targeting sub-groups of individuals, economic sectors in demand and communities.
Program managers reported that the funding allocated to JCP is influenced by the Government of British Columbia’s priorities, labour market needs, budget availability, community interest and projections from WorkBC staff.
In addition to gaining valuable work experience, key informants identified a variety of other benefits that can be expected from JCP projects. By participating in a project, individuals are expected to gain networking opportunities, enhance soft-skills and improve their personal well-being.
Project holders can benefit from JCP through increased capacity, completing their projects and increasing the awareness of their organisations. At the community level, JCP projects can support economic development, provide tangible assets and foster community collaboration.
Challenges and lessons learned
Key informants identify challenges related to:
- the recruitment of participants and project holders
- approval of JCP projects
- project monitoring and administration
- addressing participants’ barriers to employment
Key informants identify the following elements as contributing factors to participants’ success:
- important considerations for implementation include ensuring that provincial government priorities, community activities and emerging labour market challenges drive the annual marketing strategy and strategic investment plan, as well as the selection of project applications
- as of April 1, 2019, a centralized ministry-held budget was established to pay participant financial supports on JCP projects
- leveraging the marketing activities of stakeholders, positioning staff across the province to develop an understanding of regional labour markets and collaboration between Contract and Partnership Agents and WorkBC contractors were identified as important in supporting the effective recruitment of project holders
- in terms of supporting organizations during the application process, one-on-one support from Contract and Partnership Agents throughout the process is important
- regarding monitoring, it is important that expectations are clearly articulated in the Shared Cost agreement and that communication is open between project holders, WorkBC staff and participants. On-site monitoring is also an important consideration
- participants who benefit the most from JCP are those with multiple barriers, those looking to transition into a new field and those in need of support re-entering the labour force
- organizations with high administrative capacity and experience implementing a previous JCP project make for successful JCP project holders. Non-profit organizations are the most likely to succeed as project holders
- projects that focus on community interests, support government priorities and develop skills that are transferable and in-demand are well-suited to the JCP program
Key consideration for JCP program and policy development
The following consideration emerged as part of the JCP study.
Consideration: Aside from improving the labour market attachment of participants, JCP participation has various benefits to participants, communities, and project holders. These benefits are not currently reflected in the program description in British Columbia. As well, given the increase in the use of EI following JCP participation, the province may wish to clarify its JCP program objectives and expectations for active and former EI claimants.
Studies conducted as part of both the second and third cycles of the Evaluation of the Canada-British Columbia LMDA found that JCP participants increase their use of EI following participation. Specifically:
- relative to similar non-participants, active EI claimants who started their JCP participation between 2002 and 2005 increased their use of EI benefits in the years following participation Footnote 66, Footnote 67
- relative to similar participants who only received EAS, former EI claimants who started their JCP participation between 2002 and 2005, and between 2010 and 2012 increased their use of EI benefits in the years following participation
The qualitative evidence gathered documented in this study revealed that the increase in EI use among active EI claimants after participation could be explained by the following:
- participants are potentially earning EI-insurable income if they are also working at a part-time job during JCP participation
- the participation of seasonal workers in JCP during their off-season, who then return to EI following a period of seasonal work
- multi-barriered individuals who build their capacity through a JCP work experience and acquire a job in the short-term following participation, thereby regaining EI eligibility
Key informants indicated that JCP might be well suited for participants with multiple barriers to employment and it can be used as the first step to receiving additional interventions that can prepare participants for long-term employment.
Labour Market Partnerships Footnote 68
The Labour Market Partnerships programs aim to assist employers, communities or economic sectors and regions to address their labour force adjustments and human resource needs. They include a wide range of funded activities, such as:
- engagement
- labour market and human resource research
- development, piloting, and evaluation of workforce strategies
- labour force adjustment including skills development of workers facing a loss of employment
- building awareness about the labour market information
- sharing labour market and human resource information
With $8.8 million in 2019 to 2020, Labour Market Partnerships programs represents nearly 4% of total expenditure under the Canada-British Columbia LMDA.
Funded organizations
Funded organizations include:
- sector associations and sector councils
- non-profit organisations
- businesses
- public and private educational institutions
- municipal governments
Targeted labour market issues
Labour Market Partnerships projects targeted current and/or forecasted skills and/or labour shortages. These projects also targeted specific unemployed populations (for example, women, youth, Indigenous peoples, newcomers and persons with disabilities).
Generally, funded projects target labour market issues associated with:
- projected or actual industry growth
- lack of capacity for human resource planning resulting in employee attraction and retention challenges
- shortages of sector or jurisdiction specific labour market information
- barriers to employment experienced by a target population
All projects reviewed aligned with their respective program objectives and eligible activities.
Partnerships
In British Columbia, 2 separate provincial ministries are involved in Labour Market Partnership projects: the Ministry of Advanced Education and Skills Training, and the Ministry of Social Development and Poverty Reduction. In terms of ministry program officials supporting project holders to establish partnerships, the 2 ministries differ in their roles:
- the Ministry of Advanced Education and Skills Training confirmed that program officials support project holders to establish partnerships
- the Ministry of Social Development and Poverty Reduction explained that building and maintaining partnerships was the responsibility of the prospective project holders and that program officials would verify the existence of partners during the application process
British Columbia and key informants stated that partners’ expertise is essential to project implementation and success.
The document review of 17 projects confirmed that:
- partnerships were established to support the delivery of all projects
- partners made financial and in-kind contributions. The most common forms of in-kind contribution were expertise, as well as staff time on project steering committees, office/event space and logistical assistance
- project activities delivered with the support of partners included labour market and human resource research, workforce strategy/plan development and implementation, engagement, awareness of labour market information, and sharing labour market and human resource information
Challenges and lessons learned
Through questionnaires to the province and key informant interviews the following challenges related to project holder recruitment and setting up Labour Market Partnerships projects were identified:
- lack of organisational/community capacity to formulate a project and fulfil contractual obligations
- application process is costly in terms of required time and expertise
- staff turnover which resulted in a loss of corporate knowledge and limited capacity to develop new agreements
- minimal Employer Sponsored Training applications in the 2 fiscal years from April 2018 to March 2020 as a result of marketing and public awareness challenges
Actions of program officials and project characteristics that are conducive to the success of the program included:
- solid project foundation (a good understanding of the labour market issue the project is intended to address with supportive labour market data)
- clearly defined project objectives and outcomes
- ensuring that project holders have the capacity to deliver the project
- community or sector support for the project
- development of an expedited application process in response to urgent situations allowed Labour Market Partnership projects to be responsive to the needs of communities
- effectively fostering community and cross-ministry relationships
- ensuring the selection of appropriate partners and the diversity of their perspectives and expertise
- flexibility of eligible Labour Market Partnerships activities has been instrumental in supporting communities in transition and target specific demographics (for example, marginalized and/or diverse client inclusion groups)
Key considerations for the Labour Market Partnership program and policy development
The following considerations emerged as part of the Labour Market Partnerships study.
Consideration #1: Considering that the current performance indicators do not reflect the diversity of activities funded under Labour Market Partnerships programs, it is important for ESDC and British Columbia to discuss current funded activities in order to make recommendations on how best to report on results.
Consideration #2: It is essential to share lessons learned about successful Labour Market Partnerships projects. Particularly, for projects targeted to employers (such as workplace or employer-sponsored training), and those assisting communities and economic sectors dealing with labour market adjustment issues (contraction or expansion).
Research and Innovation
Research and Innovation provides funding for research and demonstration projects. These projects aim to:
- address specific labour market issues
- help unemployed individuals to join the labour force
- inform the development of policies, programs, or industry practices and their integration in the WorkBC employment services
Program officials report that the amount allocated to Research and Innovation is influenced by:
- historical expenditures
- government priorities
- labour market issues
Between 2014 and 2020, British Columbia used the program annually. Research and Innovation spending varied between 2% ($7.2 million) to 6% ($18.4 million) of annual LMDA expenditures in the province.
Funded organizations
Funded organizations include:
- non-profit organizations (including public health authorities, independent certification bodies, and research institutions)
- Indigenous governments
Funded Research and Innovation activities
Research and Innovation projects encompassed a variety of activities including:
- development and/or testing of new approaches to improve employment outcomes for persons with disabilities and at-risk youth
- strengthening and improving service provision
Innovation definition and criteria
In British Columbia, Research and Innovation projects must meet the following criteria:
- have clearly identified target population and labour market objectives
- have objectives aligned with those of the Research and Innovation, such as:
- testing and exploring new approaches to improving labour market outcomes
- strengthening the understanding of the labour market
- exploring ways to improve the delivery of employment services
- have a clearly described research methodology that adheres to Research and Innovation funding stream principles, including respect for Indigenous values, culture, and protocol
- can be reasonably expected to address a labour market issue
Dissemination and adoption of innovative approaches
In British Columbia, the responsibility to disseminate research results rest with project holders. As part of their contract deliverables, project holders agree to communicate results, including lessons learned and best practices, to a broad range of stakeholders, including:
- employment practitioners
- employers
- researchers
- communities
Project holders’ dissemination activities target multiple audiences through the use of different methods of dissemination, such as reports, presentations, and videos.
The Government of British Columbia also disseminates results within government and to other stakeholders.
Performance measurement
Once completed, funded projects are evaluated by the province to assess and identify the following:
- benefits achieved by the project
- cost-effectiveness of the project
- lessons learned and challenges in meeting project objectives
- adequacy of project planning
- suitability of project holders to undertake additional projects under the Research and Innovation funding stream
Challenges and lessons learned
Project documents and program officials identified challenges related to project implementation and completion:
- challenges with participant recruitment
- difficulty of recruiting employers as partners
- staff turnover
- underestimation of project costs
Program officials identified several factors that contribute to successful project implementation and completion:
- engaging in continuous Research and Innovation project application intake to address on-going and emerging labour market issues
- maintaining flexible Research and Innovation project criteria to encourage organisations to address labour market issues affecting marginalised populations
- having practices in place to enable the government to better monitor projects, such as:
- project holder reporting on specific targets and milestones
- clear and regular communication with project holders
- ensuring that project holders have:
- the organizational and financial reporting capacity to undertake and complete projects
- a strong commitment from project partners
- a detailed cost-estimate for the project
Training Services-Apprentices
The objective of the program is to help apprentices become skilled tradespeople and to increase their labour market attachment. Program participants have generally chosen a career and are already attached to the labour market. The apprenticeship process involves on-the-job learning and technical training in a classroom setting.
Apprentices who have worked enough hours to qualify for EI can apply to receive EI Part I benefits while on training. The program provides financial assistance to EI eligible apprentices to help them offset the costs they incur while they attend technical training. The level of funding is based on the needs of apprentices, the location of the training, and any fees paid by the apprentices. Footnote 69
The profile of program participants is presented in Table 25. It includes their gender, age, sociodemographic group, and marital status, educational attainment, occupation and industry. Information about their educational attainment, occupation and industry is based on the last job they held prior to applying for EI benefits. Information about sociodemographic groups is self-reported.
| Categories | Active claimants | Former claimants |
|---|---|---|
| Number of participants | 7,604 | 3,175 |
| Gender: Female | 7% | 10% |
| Gender: Male | 93% | 90% |
| Age: 30 and under | 77% | 72% |
| Age: 31 to 54 | 23% | 27% |
| Age: 55 and over | 0% | 1% |
| Sociodemographic group: Indigenous people | 5% | 8% |
| Sociodemographic group: Persons with disabilities | 2% | 2% |
| Sociodemographic group: Visible minorities | 7% | 7% |
| Sociodemographic group: Recent immigrants | 2% | 1% |
| Marital status: Single | 68% | 64% |
| Marital status: Married or common-law | 27% | 30% |
| Marital status: Widow / divorced / separated | 3% | 3% |
| Education or skills level: High school or occupational training | 5% | 9% |
| Education or skills level: On-the-job training | 8% | 14% |
| Education or skills level: College, vocational education or apprenticeship training | 86% | 75% |
| Education or skills level: University degree | 0% | 0% |
Note: Values may not equal 100% due to rounding or missing information.
Top 3 occupational groups for EBSMs participants
Active claimants:
- skilled crafts and trades workers = 79%
- other manual workers = 7%
- semi-skilled manual workers = 4%
Former claimants:
- skilled crafts and trades workers = 66%
- other manual workers = 12%
- skilled sales and service personnel = 5%
Top 3 industries for EBSMs participants Footnote 70
Active claimants:
- construction = 59%
- manufacturing = 9%
- other services (excluding public administration) = 7%
Former claimants:
- construction = 45%
- manufacturing = 14%
- retail trade; other services (excluding public administration) = 7% each
Labour market outcomes
The labour market outcomes are based on individuals who began their participation during the 2010 to 2012 period. Statistics focus on 5 years before program participation and 5 years after the program start year.
Active claimants
As shown in Chart 6, program participants increased their average earnings from $20,085 in the fifth year pre-program to $56,254 in the fifth year after the program start year.
Chart 6. Average earnings for active claimant participants in Training Services-Apprentices

Chart 6 text description
| Year pre-post participation | Employment earnings for active claimants |
|---|---|
| 5 years pre-program | $20,085 |
| 4 years pre-program | $22,095 |
| 3 years pre-program | $23,153 |
| 2 years pre-program | $25,181 |
| 1 year pre-program | $31,250 |
| Program start year | $31,232 |
| 1 year post-program | $39,697 |
| 2 years post-program | $46,784 |
| 3 years post-program | $51,918 |
| 4 years post-program | $54,907 |
| 5 years post-program | $56,254 |
The proportion of employed participants declines by 1 percentage point annually after the program start year but remains around 96%. The proportion of participants on EI Part I decreases from 99% in the program start year to 22% 5 years later. Participants decrease their dependence on income support from 23% in the program start year to 3% in the fifth year after participation.
Former claimants
As shown in Chart 7, program participants increased their average earnings from $22,981 in the fifth year pre-program to $57,472 in the fifth year after the program start year.
Chart 7. Average earnings for former claimant participants in Training Services-Apprentices

Chart 7 text description
| Year pre-post participation | Employment earnings for active claimants |
|---|---|
| 5 years pre-program | $22,981 |
| 4 years pre-program | $26,089 |
| 3 years pre-program | $27,081 |
| 2 years pre-program | $28,491 |
| 1 year pre-program | $31,066 |
| Program start year | $37,608 |
| 1 year post-program | $45,089 |
| 2 years post-program | $50,261 |
| 3 years post-program | $54,505 |
| 4 years post-program | $56,205 |
| 5 years post-program | $57,472 |
The proportion of employed participants declined from 96% in the program start year to an average of 94% post participation. The proportion of participants on EI Part I decreased from 61% in the program start year to 18% 5 years later. Participants decreased their dependence on income support from 12% in the program start year to 4% in the fifth year after participation.
Conclusions and recommendations
The Canada-British Columbia LMDA is the largest annual investment in active labour market programs and services in the province. Based on the findings presented in this report, the EBSMs are meeting the objective of assisting individuals to obtain or keep employment through various active employment programs, including training or EAS.
Summary of findings
Overall, incremental impacts demonstrate that participation in most EBSMs improves labour market attachment and reduces dependence on government income supports compared to similar non-participants.
A subgroup analysis shows that Training Services, WSWEP, and EAS improved the labour market attachment and reduced the dependence on income support for female, male, and youth participants. Where participant numbers were sufficient to enable statistically significant incremental impact analysis, these programs also improved the labour market outcomes of older, Indigenous, recent immigrant, and visible minority participants.
Moreover, the social benefits of participating in EBSMs exceeds the costs of investments for most interventions over time.
A series of supplemental studies address information gaps previously identified in LMDA evaluations for Self-Employment, JCP, Labour Market Partnerships, Research and Innovation, and Training Services-apprentices. Each study identified lessons learned, best practices and challenges, and issued when relevant considerations for policy design and development. Overall, the studies found that:
- participants in the Self-Employment program increased their level of employment, and reduced their dependence on governmental income supports
- British Columbia uses JCP to:
- address a variety of barriers to employment experience by their citizens
- address the various labour market needs of subgroups of individuals, professions, economic sectors, and communities
- British Columbia uses Labour Market Partnerships programs to assist employers, communities and/or industries to address their labour force adjustment and human resource needs
- the province uses the Research and Innovation support measure to fund labour market research and demonstration projects
- after participating in Training Services, apprentices increased their employment earnings and decreased their dependence on government income supports
Recommendations
Since 2012, 15 qualitative and quantitative studies addressed issues and questions related to EBSM design, delivery and effectiveness. The quantitative studies successfully assessed the effectiveness and efficiency of EBSMs by producing incremental impacts and cost-benefit analysis. The qualitative studies identified specific challenges, lessons learned, and best practices associated with the design and delivery of EBSMs. Each study included key considerations for program and policy development or recommendations.
The recently completed evaluation of the Workforce Development Agreements complements the LMDA qualitative studies. This evaluation was also supported by literature reviews and provided unique insights into challenges and lessons learned to assist persons with disabilities, immigrants and those further removed from the labour market.
Most results from this evaluation stem from the conduct of advance causal analysis whereby impacts found could be attributed to a specific EBSM. These analyses are predicated on having access to high quality administrative records, thereby confirming the importance of the capacity to leverage and integrate relevant administrative data.
From these main findings, 2 key recommendations emerge:
Recommendation #1: British Columbia is encouraged to share and discuss lessons learned, best practices and challenges associated with the design and delivery of programs and services. Discussions are encouraged with ESDC, at the bilateral or multilateral levels as well as with service delivery network if necessary.
Recommendation #2: British Columbia is encouraged to pursue efforts to maintain and strengthen data collection provisions in support of reporting, performance measurement and data-driven evaluations at the national and provincial levels.
References
- Allin, S., Corscadden, L., Gapanenko, K., and Grignon, M. Lifetime Distributional Effects of Publicly Financed Health Care in Canada. CIHI, 2013.
- Employment and Social Development Canada. Cycle II of the Evaluation of the Labour Market Development Agreements: Cost-Benefit Analysis of Employment Benefits and Support Measures Delivered in British Columbia. Internal document, 2016.
- Employment and Social Development Canada. Design and delivery of the Job Creation Partnerships program in British Columbia. Internal report, 2019.
- Employment and Social Development Canada. Employment Insurance Monitoring and Assessment Reports. 2011 to 2022.
- Employment and Social Development Canada. Evaluation of the Canada-British Columbia Labour Market Development Agreements – Cycle III: Examination of the medium-term outcomes from 2010 to 2017. Internal report, 2021.
- Employment and Social Development Canada. Evaluation of the Canada-British Columbia Labour Market Development Agreements – Cycle III: Estimation of medium-term incremental impacts from 2010 to 2017. Internal report, 2021.
- Employment and Social Development Canada. Evaluation of the Canada-British Columbia Labour Market Development Agreements, 2017.
- Employment and Social Development Canada. Evaluation of the Labour Market Development Agreements, Design and delivery of the Self-Employment Services in British Columbia. Internal report, 2021.
- Employment and Social Development Canada. Horizontal evaluation of the Labour Market Development Agreements, Design and delivery of the Labour Market Partnerships program in British Columbia. Internal document, 2021.
- Employment and Social Development Canada. Labour Market Development Agreements Process for Determination of Similarity. Internal document, 2012.
- Employment and Social Development Canada. Third Cycle for the Horizontal Evaluation of the Labour Market Development Agreements: Cost-Benefit Analysis of Employment Benefits and Support Measures in British Columbia: Incorporating Public Health Care Costs Savings in the Context of the Labour Market Programs Evaluation. Internal document, 2022.
- Employment and Social Development Canada. Third Cycle for the Horizontal Evaluation of the Labour Market Development Agreements: Quantitative Methodology Report. Internal document, 2019. Available upon request.
Appendix A. List of 8 studies included in this national synthesis report
Overview of studies included in this synthesis report
- Study 1: Examination of medium-term outcomes from 2010 to 2017
- Evidence generated: profile of active and former EI claimants in British Columbia; outcomes by claimant type and by subgroup.
- Methods: before and after results of program participation.
- Reference period: 2010 to 2012 participants
- Observation period: up to 12 years (5 years before participation, 1 to 2 years of participation, and 5 years after participation)
- Study 2: Estimation of medium-term incremental impacts from 2010 to 2017
- Evidence generated: incremental impacts for active and former EI claimants in British Columbia; incremental impacts by subgroup; profile and socio-demographic characteristics of participants
- Methods: non-experimental method using propensity score matching in combination with difference-in-differences; statistical profiling
- Reference period: 2010 to 2012 participants
- Observation period: up to 7 years (1 to 2 years in program, and up to 5 years after participation)
- Study 3: Cost-Benefit Analysis of Employment Benefits and Support Measures in British Columbia
- Evidence generated: cost-benefit analysis
- Methods: non-experimental method using propensity score matching in combination with Difference-in-Differences; cost-benefit analysis
- Reference period: 2010 to 2012 participants
- Observation period: 5 years post-program for WSWEP, JCP and EAS; 10 years post-program for Training Services and Training Services youth
- Study 4: Incorporating Public Health Care Costs Savings in the Context of the Labour Market Programs Evaluation
- Evidence generated: cost-benefit analysis
- Methods: estimation of adjusted annualized healthcare costs
- Reference period: 2010 to 2012 participants
- Observation period: 5 years post-program for WSWEP, JCP and EAS; 10 years post-program for Training Services and Training Services youth
- Study 5: Design and delivery of the Job Creation Partnerships program in British Columbia
- Evidence generated: program design and delivery; challenges and lessons learned
- Methods: non-experimental approach (from cycle II); statistical analysis; document review; 14 semi-structured telephone interviews with 18 key informants
- Reference period: 2015 to 2017 participants
- Observation period: 2015 to 2019
- Study 6: Design and delivery of the Self-Employment Services in British Columbia
- Evidence generated: program design, delivery and success; define outcomes attributed to the program; fill in knowledge gaps; challenges and lessons learned
- Methods: document review; statistical analysis of administrative data; Canadian and British Columbia self-employment literature and statistics; 11 semi-structured telephone interviews with 11 key informants (2 provincial officials and 9 service providers); statistical analysis of administrative data; survey of 757 Self-Employment participants in British Columbia
- Reference period: 2015 to 2017 participants
- Observation period: 2015 to 2020
- Study 7: Design and delivery of the Labour Market Partnerships program in British Columbia
- Evidence generated: program design and delivery; challenges and lessons learned
- Methods: document review; questionnaire completed by the Ministry of Social Development and Poverty Reduction and Ministry of Advanced Education and Skills Training; 8 interviews with 12 key informants (7 with program officials and 5 with project holders)
- Reference period: 2018 to 2020
- Observation period: design and delivery at the time of the data collection
- Study 8: Design and delivery of the Research and Innovation Support measure in British Columbia
- Evidence generated: program design and delivery; challenges and lessons learned
- Methods: document review; questionnaire completed by provincial program officials
- Reference period: 2017 to 2020
- Observation period: design and delivery at the time of the data collection
Note: All studies are available in English only.
Page details
- Date modified: