
Focus on Employee Engagement
The Focus series is a collection of reports that present the results of the 2014 Public Service Employee Survey (PSES), broken down by theme. Focus on Employee Engagement looks at results in the area of employee engagement and examines how they relate to results for other aspects of the workplace. The information provided in this report is intended to help target efforts to improve people management practices in the public service.
Results and Comparisons Over Time
The PSES assesses employee engagement through questions that gauge employees’ job satisfaction as well as their commitment and satisfaction with their organization. The 2014 PSES contained seven questionsSee Footnote 1 relating to employee engagement. Table 1 shows the results for all seven questions.
| Question Number | Question | 2008 (%) |
2011 (%) |
2014 (%) |
|---|---|---|---|---|
Table 1 Notes
|
||||
| Q11 | I get a sense of satisfaction from my work. | 77 | 76 | 74 |
| Q14 | I am willing to put in the extra effort to get the job done. | n/aSee Table 1 – Note * | 94 | 93 |
| Q15 | I am proud of the work that I do. | n/aSee Table 1 – Note * | 89 | 88 |
| Q19 | Overall, I like my job. | 84 | 82 | 79 |
| Q58 | I would recommend my department or agency as a great place to work. | n/aSee Table 1 – Note * | 64 | 63 |
| Q59 | I am satisfied with my department or agency. | 68 | 65 | 64 |
| Q60 | I would prefer to remain with my department or agency, even if a comparable job was available elsewhere in the federal public service. | 60 | 59 | 57 |
Based on the 2014 survey results, most employees in the public service are engaged in their work and committed to their organization; they are, however, slightly less engaged than they were in the past.
The 2014 results show that 79% of employees like their job (Q19), a decrease from 2011 and 2008 (82% and 84%, respectively). Almost three quarters of employees (74%) indicated that they get a sense of satisfaction from their work (Q11), down from 2011 and 2008 (76% and 77%, respectively).
In 2014, 88% of employees agreed that they are proud of the work they do (Q15), similar to 2011 (89%). The vast majority of employees (93%) indicated that they are willing to put in the extra effort to get the job done (Q14), similar to 2011 (94%).
Nearly two thirds (64%) of employees agreed that they are satisfied with their organization (Q59), similar to 2011 (65%) but a decrease from 2008 (68%). In 2014, 63% of employees indicated that they would recommend their organization as a great place to work (Q58), which is similar to 2011 (64%). Lastly, 57% of employees felt that they would prefer to remain with their organization even if a comparable job was available elsewhere in the federal public service (Q60), a decrease from 2011 and 2008 (59% and 60%, respectively).
Demographic Findings
Occupational category
The 2014 results for indicators of employee engagement vary widely among occupational categories.See Footnote 2 Employees in the Executive category expressed the highest levels of employee engagement; employees in the Operational category expressed the lowest levels.
Differences between Executive and Operational employees were most pronounced on the matter of satisfaction with their organization, with 81% of employees in the Executive category and 49% of employees in the Operational category indicating that they are satisfied with their organization (Q59) (see Figure 1).
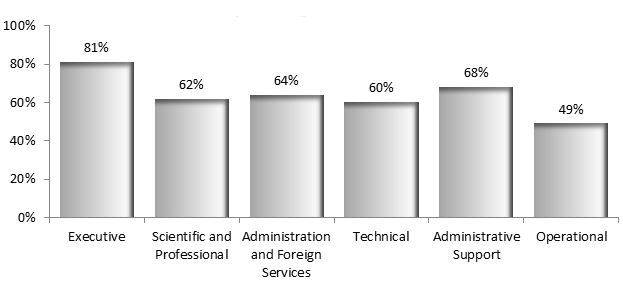
Figure 1 - Text version
Figure 1 illustrates the proportion of employees in each occupational category who responded affirmatively to Q59 (I am satisfied with my department or agency).
| Executive | Scientific and Professional | Administration and Foreign Services | Technical | Administrative Support | Operational |
|---|---|---|---|---|---|
| 81% | 62% | 64% | 60% | 68% | 49% |
Community
The 2014 PSES asked employees to indicate the community with which they most closely identify. Overall, employees who identified with the access to information and privacy community tended to express the highest levels of satisfaction with and commitment to their organization; employees who identified with the security community tended to express the lowest levels. For example, 75% of employees who identified with the access to information community indicated that they are satisfied with their organization (Q59), compared with 50% of employees who identified with the security community. Smaller differences were observed among communities in terms of job satisfaction, although employees who identified with the security community tended to report slightly lower levels of job satisfaction than employees in other communities. For example, 62% of employees in the security community indicated that they get a sense of satisfaction from their work (Q11), compared with 72% to 79% for employees in other communities.
Age
Employees aged 24 years or younger tended to report higher levels of satisfaction with their organization than did their older counterparts. For example, 83% of employees aged 24 years and younger indicated that they are satisfied with their organization (Q59), compared with 62% to 70% for employees in older age groups. Smaller differences on the basis of age were observed in terms of job satisfaction, although employees in the younger and older age groups tended to report slightly higher levels of job satisfaction than employees in the middle age groups. For example, 84% of employees aged 24 years or younger and 85% of employees aged 60 years or older indicated that they like their job (Q19), compared with 77% to 82% for employees in other age groups.
Years of service
Employees with less than one year of service in the public service and in their current organization were much more inclined than those with more years of service to indicate that they are satisfied with their organization (Q59) and that they would recommend their organization as a great place to work (Q58). Figure 2 shows the results for employees’ satisfaction with their organization (Q59) by years of service.

Figure 2 - Text version
Figure 2 illustrates the proportion of employees who responded affirmatively to Q59 (I am satisfied with my department or agency) by years of service in the public service and in their current organization.
| Years of Service | Less than 1 year | 1 to 4 years | 5 to 9 years | 10 to 14 years | 15 to 19 years | 20 to 24 years | 25 to 29 years | 30 or more years |
|---|---|---|---|---|---|---|---|---|
| In public service | 88% | 73% | 64% | 61% | 58% | 60% | 60% | 63% |
| In organization | 82% | 67% | 62% | 60% | 58% | 60% | 60% | 63% |
Organization size
Employees in smaller organizations tended to express higher levels of employee engagement than employees in larger organizations. This pattern was most pronounced on the matter of satisfaction with the organization, with 73% of employees in micro-organizations (those with fewer than 150 employees) indicating that they are satisfied with their organization (Q59), compared with 62% of employees in very large organizations (those with 10,000 employees or more).
Key Observations
Good job fit linked to job satisfaction
Employees who agreed that their job is a good fit with their interests (Q6) and with their skills (Q7) tended to report high levels of satisfaction with their job. For example, employees who felt that their job is a good fit with their interests (Q6) were more likely to indicate that, overall, they like their job (91% compared with 23%, Q19). Also, employees who reported a good fit between their job and their interests (Q6) were more likely than those who did not to indicate that they get a sense of satisfaction from their work (87% compared with 20%, Q11).
Leadership and respect linked to satisfaction with the organization
Employees who expressed positive opinions on their senior management tended to be more satisfied with their organization. For example, employees who agreed that they have confidence in the senior management of their organization (Q40) were more likely than those who disagreed to report that they are satisfied with their organization (88% compared with 23%, Q59). Employees who agreed that they have confidence in their senior management were also more likely than those who disagreed to indicate that they would recommend their organization as a great place to work (87% compared with 24%, Q58).
Respect in the workplace is also related to higher levels of satisfaction with the organization. For example, employees who agreed that, overall, their organization treats them with respect (Q57) were much more inclined than those who disagreed to be satisfied with their organization (77% compared with 7%, Q59), and to agree that they would recommend their organization as a great place to work (76% compared with 8%, Q58).
Empowerment linked to satisfaction with job and organization
Employees whose responses indicated that they feel empowered at work tended to report higher levels of satisfaction with their job and with their organization. For example, employees who agreed that they have support at work to provide a high level of service (Q18) were more likely than those who disagreed to indicate that, overall, they like their job (92% compared with 49%, Q19). Also, employees who agreed that they receive support at work to provide a high level or service were more inclined than those who disagreed to be satisfied with their organization (81% compared with 22%, Q59).
Encouragement for innovation and the opportunity to provide input into decisions that affect work were also linked to higher levels of satisfaction with job and organization. For example, employees who agreed that they are encouraged to be innovative or to take initiative in their work (Q17) were more likely than those who disagreed to indicate that overall, they like they job (91% compared with 51%, Q19).
Organizational issues linked to lower levels of satisfaction with the organization
The 2014 survey results show that organizational issues such as lack of stability, overly complicated or unnecessary business processes, shortage of resources, too many approval stages, and constantly changing priorities have a negative impact on the quality of employees’ work. In addition, the results suggest that these organizational issues are linked to lower levels of satisfaction with the organization. For example, employees who felt that the quality of their work suffers because of lack of stability in their organization (Q21b) were more likely than those who did not to indicate that they are satisfied with their organization (39% compared with 86%, Q59).
Satisfaction with job and organization linked to retention
Employees who expressed higher levels of satisfaction with their job and with their organization were less likely to indicate that they intend to leave their position in the next two years. For example, 21% of employees who agreed that they like their job (Q19) indicated that they intend to leave their position in the next two years (Q61), compared with 54% of employees who disagreed that they like their job.
The reasons provided for leaving (Q62) also differed between employees who like their job and those who do not. For example, among employees intending to leave their position, those who agreed that they like their job (Q19) were less inclined than those who disagreed to indicate that they intend to leave to pursue a position in another organization (24% compared with 43%) or outside the federal public service (6% compared with 20%), and more likely to retire (23% compared with 8%) or to pursue a position within their own organization (37% compared with 20%).
Methodological Notes
For the purposes of this report, results for the two most positive responses on the scale (e.g., “Strongly agree” and “Somewhat agree”) were added together to create a single percentage total for positive responses. Similarly, results for the two most negative responses on the scale (e.g., “Strongly disagree” and “Somewhat disagree”) were added together to create a single percentage total for negative responses. The totals used to calculate the percentages do not include the responses “Don’t know” and “Not applicable.”
The observations in this report do not necessarily indicate relationships of cause and effect, but they can provide insight into connections between different aspects of the workplace.
For additional results and for the distribution of respondents by demographic characteristics, consult the 2014 PSES website.
Appendix
| Occupational Category | Occupational Group |
|---|---|
| Executive | CI-EXC, DM, EC(CRA), EX, EXPCX, GR-EX, LC, MGT, PL, RLE |
| Scientific and Professional | AC, AG, AR, AP-AA, AP-PA, ASG-ITS-LA, AU, BI, CH, CI-SPC, DE, DS, EC, ED, EN, ES, FO, HR, LA, LP, LS, MA, MD, MT, ND, NU, OP, PC, PH, PM-MCO, PS, SE, SG, SI, SW, UT, VM |
| Administration and Foreign Services | AS, CO, CS, FI, FS, HR(CRA), IS, OM, PE, PG, PM, TR, WP |
| Technical | AI, AO, CIPTC, DD, EG, EL, EU, GT, PI, PY, RO, SO, TI |
| Administrative Support | CIASC, CM, CR, DA, OE, ST |
| Operational | CX, FB, FR, GA, GL, GS, HP, HS, IN, LI, PO-IMA, PO-TCO, PR, SC, SR |
| Other | AB, CIVIL, FT, Governor in Council, GR, IM, MDMDG, MG, NB, RE, REG, RM, SP(CRA), Student, UNI, Other |
Page details
- Date modified: