
Chief Human Resources Officer of Canada Transition Binder
On this page
- People Management in the Federal Public Sector
- The Future of Work in the Public Service
- Data Pack
- Forecasted OCHRO Budget 2022-2023 and HR overview
- OCHRO Integrated Business Plan Placemat
- Proposed 2023-2024 OCHRO Integrated Business Plan
- Driving Frameworks
People Management in the Federal Public Sector
In this section
By the Numbers: Overview of the Federal Public Sector
Public service employees impact the lives of Canadians every day through an array of services and programs. The federal government is the largest employer in Canada with total compensation cost of $79.7B (2020-21)

Figure 1 - Text version
| 2022 | |
|---|---|
| CPA | 254,309 |
| SA | 81,648 |
| RCMP | 21,678 |
| CAF | 87,632 |
| Crown Corps | 137,327 |
| Total in graph includes minister's staff (758) | 582,594 |
The Treasury Board serves as the Employer for 254, 309 employees (as of March 2022) for the 69 organizations listed in Schedules I and IV of the Financial Administration Act, constituting the Core Public Administration (CPA).
* Includes $15.3B net actuarial losses and $4.2B in interest expenses associated with personnel costs
** RCMP public service employees are included in Core Public Administration
RCMP regular and civilian members included separately (machinery change of June 2017 not included)
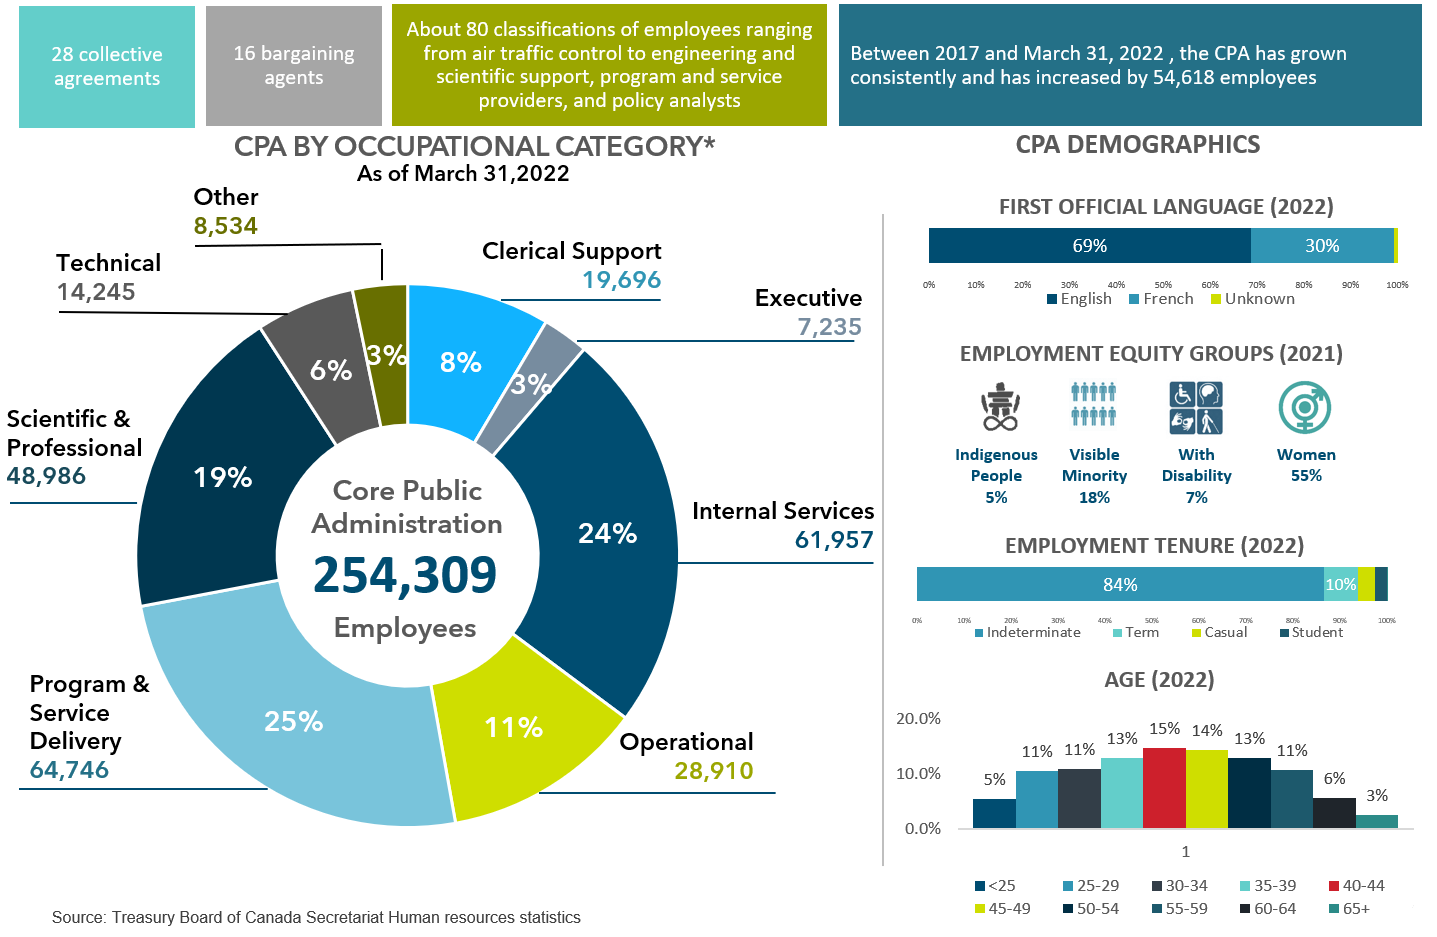
Figure 2 - Text version
Pie Chart: CPA by occupational category*
As of March 31, 2022
Core Public Administration 254,309 Employees
Other 8,534 / 3%
Executives 7,235 / 3%
Technical 14,453 / 6%
Clerical support 19,696 / 8%
Operational 28,910 / 11%
Scientific and Professional 48 ],986 / 19%
Internal Services 61,957 / 24%
Program and Service Delivery 64,746 / 25%
People Management in the CPA
Treasury Board as the employer
Established in 1867, Treasury Board (TB) is the only statutory Cabinet Committee. It has several responsibilities including being the Employer for the CPA; these responsibilities are delegated to the Chief Human Resources Officer through the Financial Administration Act
As the employer, TB has three primary duties:
- Establishing compensation and terms and conditions of employment for represented employees and executives
- Collective Agreements govern key aspects between the relationship between employer and employee (e.g,. rates of pay, leave allowances, classification)
- Pension plans that are set in legislation and not subject to bargaining
- Benefit plans (Health, Dental, and Disability Insurance) are negotiated outside the bargaining process. Plans are for both employees and retirees
- Setting policy direction for people management. The People Management Policy suite consists of two policies and 22 directives
- Policy on People Management provides Deputy Heads with support in developing and sustaining a high-performing workforce
- The Policy on the Management of Executives establishes the authorities and responsibilities of Deputy Heads and the CHRO for EX management
- Maintaining a healthy, diverse, inclusive, bilingual and safe workplace. This is achieved thorough:
- Developing innovative solutions for recruitment and talent management
- Providing guidance on how to develop and implement measures to support the Federal Public Service Mental Health Strategy
- Supporting government implementation of the Official Languages Act in federal institutions
- Providing clear expectations for behaviour and shared Values and Ethics
People Management Roles and Responsibilities
There are distributed accountabilities and roles across the Government of Canada for people management
- OCHRO
- The Office of the Chief Human Resources Officer (OCHRO) supports TB in its role as the employer by driving excellence in people management and providing guidance to support consistency across the public service
- Deputy Heads
- Hold primary responsibility for human resources management within their organizations. This includes directing the administration of financial and human resources
- PCO
- The Privy Council Office (PCO) Supports the Clerk as Head of the Public Service, including directing public service-wide people management priorities
OCHRO’s Mandate
OCHRO was established as part of Treasury Board of Canada Secretariat (TBS) in 2009. The context of people management has changed dramatically since then with heightened expectations and increasingly complex issues to address
2009
Narrow and focused mandate:
- People Management
- Total compensation
- Collective bargaining
- Classification
- Official languages
- Employment equity
- Values and ethics
- PS Data
- Mental health
Today
Broader mandate which includes the delivery of 23 Ministerial Mandate Letter commitments:
- Crisis management, managing COVID and post-pandemic planning
- Diversity and inclusion, workplace harassment, discrimination and anti-racism
- Fundamental review of people management policies, organization of work and classification models
- Future of work research and experimentation
- Expanded business owner role for HR systems and pay stabilization
- Complex bargaining environments and modernization and adaptation of total compensation model
- Collective management of heads of HR and renewal and inclusive talent management of EXs
- Support for Beyond 2020 Framework
- Expanded stakeholder management and engagement
Key partners in human resources management
There are four other key partners that work closely with OCHRO and who are responsible for the various aspects of human resources management within government
Public Service Commission
Safeguards the integrity of the staffing system and the non-partisanship of the public service and manages the tools for public service recruitment
Public Services and Procurement Canada
Acts as the central purchasing agent, real property manager, treasurer, accountant, pay and pension administrator, integrity adviser and translation services for the public service
Canada School of Public Service
Provides learning, training, and professional development opportunities to public servants and helps Deputy Heads meet the learning needs of their organizations
Shared Services Canada
Responsible for delivering information technology (IT) and network services to partner organizations to support the delivery of federal programs and services
How OCHRO delivers on its mandate
There are four key business lines within OCHRO that support the role of the Employer
- People Management Strategic Direction
- Developing and supporting policies to ensure an appropriate degree of consistency across the public service, balancing standard requirements with departmental flexibility on a range of HR issues such as official languages, executive leadership, diversity, inclusion and mental health, and telework
- Policy Planning, Research and Renewal
- Data collection and reporting related to people management including the annual Public Service Employee Survey (PSES); integrated strategic policy and planning to guide and improve outcomes on the future of work; and, research, analysis, engagement and experimentation, including innovative approaches, such as behavioral science and human-centered design
- Total Compensation Negotiations and Oversight
- Negotiating terms and conditions of employment with bargaining agents and maintaining effective relationships; leading development of pay equity plans for the CPA and RCMP; providing centralized expertise to departments on labour relations, Ministers’ offices, managing compensation and classification; and, managing the public service pension and group insurance benefit plans
- HR Systems and Processes
- Oversight for enterprise-wide HR systems, processes, standards and controls; engagement with key administrative partners including Shared Services Canada and Public Services and Procurement Canada; and, working on a set of modern tools that support a wide range of HR functions across the public service
How Government manages its workforce is changing
Putting people first is the foundation to our future success– the COVID-19 pandemic has accelerated the need to adapt and turn challenges into opportunities
The Future of Work Framework
People management
Inclusive
Talent, Skills, & Inclusion
The Public Service is skilled, diverse, inclusive, accessible, and human-centric
Agile
Flexible Work Models
A distributed, flexible, productive workforce and welcoming workplace
Equipped
Organization of Work
The Public Service classifies and compensates work to facilitate agility and drive employer competitiveness in response to the changing nature of work
Digital & Data Driven
The Public Service is digitally enabled, and leverages HR systems and data to support strategic decision-making
Culture, Change Management, Mindsets & Behaviours
A Public Service that embodies the future of work vision
Annexes
Annex A: Occupational Category Breakdown
Clerical Support
- CM - Communications
- CR - Clerical and Regulatory
- DA - Data Processing
- OE - Office Equipment
- ST - Secretarial, Stenographic and Typing
Executive
- EX - Executive
- LC - Law Management
Internal Services
- AS - Administrative Services
- FI - Financial Management
- IS - Information Services
- OM - Organization and Methods
- PE - Personnel Administration
- PG - Purchasing and Supply
- TR - Translation
Operational
- CX - Correctional Services
- FB - Border Services
- FR - Firefighters
- GL - General Labour and Trades
- GS - General Services
- HP - Heating, Power and Stationary
- Plant Operations
- HS - Hospital Services
- LI - Lightkeepers
- PO - Police Operations Support Group
- PR - Non-Supervisory Printing Services and Printing Operations (Supervisory) Group
- SC - Ships Crews
- SR - Ship Repair and Ship Repair Chargehands and Production Supervisors
Other
- AM - Audit Committee Members
- CA - Career Assignment Program
- DM - Deputy Ministers
- Federal Judges (Non-classified)
- MM - Management Trainee “Ab Initio”
- (non-employees)
- Non-classified
- OC - Governor-in-Council Appointees
- PL - Leadership Programs (LP) Group
- Student
Program & Service Delivery
- CO - Commerce
- FS - Foreign Service
- IT - Information Technology
- PM - Programme Administration
- PMMCO - Mediation and Conciliation
- WP - Welfare Programmes
Scientific and Professional
- AC - Actuarial Science
- AG - Agriculture
- AR - Architecture and Town Planning
- AU - Auditing
- BI - Biological Sciences
- CH - Chemistry
- DE - Dentistry
- DS - Defence Scientific Service
- EC - Economics and Social Science Services
- ED - Education
- EN - Engineering and Land Survey
- FO - Forestry
- HR - Historical Research
- LA - Law
- LP - Law Practitioner
- LS - Library Science
- MA - Mathematics
- MD - Medicine
- MT - Meteorology
- ND - Nutrition and Dietetics
- NU - Nursing
- OP - Occupational and Physical Therapy
- PC - Physical Sciences
- PH - Pharmacy
- PS - Psychology
- SE - Scientific Research
- SG - Scientific Regulation and Patent
- SW - Social Work
- UT - University Teaching
- VM - Veterinary Medicine
Technical
- AI - Air Traffic Control
- AO - Aircraft Operations
- DD - Drafting and Illustration
- EG - Engineering and Scientific Support
- EL - Electronics
- EU - Educational Support
- GT - General Technical
- PI - Primary Products
- PY - Photography
- RO - Radio Operations
- SO - Ships Officers
- TI - Technical Inspection
Annex B: OCHRO’s Ministerial Mandate Letter Commitments
- Ensure that Public Service workplaces are free from sexual harassment and violence, as well as racism and all forms of hate
- Support departments in implementing the plans outlined in their responses to the Call to Action on Anti-Racism, Equity and Inclusion
- Ensure the use of disaggregated data to track the Public Service's progress in implementing the plans outlined in their responses to the Call to Action on Anti-Racism, Equity and Inclusion
- Build a whole-of-government approach for the improved collection, analysis, availability and publication of disaggregated data
- Create a Diversity Fellowship to mentor and sponsor diverse groups of public servants
- Implement an action plan to increase representation in hiring, appointments and leadership development
- Create a fellowship for 1,000 students and new graduates
- Offer language training to post-secondary students to reduce barriers to public service recruitment
- Offer language programs to racialized public service employees
- Expand public service recruitment programs to international students and permanent residents
- Help community organizations support students to enter the Public Service
- Establish a mental health fund for Black public servants
- Support career advancement, training, sponsorship and educational opportunities for Black public servants
- Advance the implementation of the Pay Equity Act across the Public Service
- Bring forward a coherent and coordinated plan for the future of work within the Public Service
- Develop a long-term, government-wide Public Service Skills Strategy
- Improve government whistleblower protections and supports, including exploring possible amendments to the Public Servants Disclosure Protection Act
- Ensure that Canadians across the country can receive services from federal institutions in both official languages
- Implement measures outlined in the White Paper, English and French: Towards a Substantive Equality of Official Languages in Canada that are related to the Public Service
- Hire 5,000 new public servants with disabilities by 2025
- Require Crown corporations to implement gender and diversity reporting, starting in 2022
- Ensure vaccination across the Public Service
- Bargain in good faith with Canada's public sector unions
Annex C: Federal Governance Structure
Despite differences in governance structure, all departments, agencies and Crown corporations have a relationship with a responsible minister
All are ultimately answerable to Parliament and the public
Annex D: Federal Public Sector HR Legislative Framework
- Charter of Rights and Freedoms
- Guarantees the rights and freedoms set out in it; subject only to such reasonable limits prescribed by law as can demonstrably be justified in a free and democratic society. Courts have determined that the “freedom of association" clause confers rights of collective bargaining.
- Financial Administration Act (FAA)
- Confers HR management powers to the TB and/or Deputy Heads (Organization of Work, Classification, Discipline, Termination of Employment, Terms and Conditions of Employment, Establishment and modification of the PS benefit plan).
- Public Service Employment Act (PSEA)
- Sets out staffing rules, restrictions on political activities administered by the Public Service Commission.
- Federal Public Sector Labour Relations Act (FPSLRA)
- Governs collective bargaining and labour relations in the federal public service.
- Canadian Human Rights Act (CHRA)
- Prohibits federally regulated employers from discriminating based on the grounds listed in the Act. It also protects the right to pay equity by establishing that it is a discriminatory practice for an employer to establish differences in wages between male and female employees who perform work of equal value.
- Employment Equity Act (EEA)
- Establishes rules for employers to engage in proactive employment practices to increase the representation of four designated groups: women, people with disabilities, aboriginal peoples, and visible minorities.
- Accessible Canada Act (ACA)
- Provides for the development of accessibility standards and gives the Government the authority to work with stakeholders and persons with disabilities to create new accessibility regulations that will apply to sectors within the federal jurisdiction.
- Pay Equity Act (PEA)
- Requires Treasury Board and other federal employers to proactively review compensation and ensure that they are providing equal pay for work of equal value.
- Canada Labour Code, Part II
- Sets out the Occupational Health & Safety regime.
- Official Languages Act
- Assigns responsibilities to Treasury Board and its President, regulations and policies on communications and services to the public, language of work in federal institutions and the participation of English-speaking and French-speaking Canadians in federal institutions.
- Public Service Superannuation Act & other pension legislation
- Sets out the terms and conditions for pension benefits to current and former federal public sector employees, and their survivors and dependents.
- The Public Servants Disclosure Protection Act
- Establishes a secure and confidential process for disclosing serious wrongdoing in the workplace, as well as protection from acts of reprisal.
- The Canada School of Public Service Act
- Assigns responsibility to the Canada School of Public Service to assist deputy heads in meeting their departmental learning needs.
- The Department of Public Works and Government Services Act
- Assigns responsibility to PSPC for the administration and delivery of pay and benefits.
The Future of Work in the Public Service
Discussion Paper – June 2022
In this section
Introduction
The Public Service workplace and workforce are changing rapidly; from increased focus on both diversity and wellness to the introduction of new technology to the recent experience of widespread remote work, now – more than ever – excellence in people management needs to be at the core of any vision of the future of work in the Public Service.
This paper outlines OCHRO’s vision for what the Public Service could be and an analytical frame to help get there, inspired by a statement from the Clerk, Janice Charette, at APEX 2021:
“…so much has changed, that we cannot return to the way it was before COVID-19…we must remain agile, flexible, and receptive as we have been during the crisis…”
It is an early articulation of how the Public Service can use this moment of change to shape a future of work that focuses on excellence in people management and a people-first culture. It is meant to highlight to decision-makers what is possible and provoke discussion about how to get there.Footnote 1 The next steps will be to build consensus around this vision and develop more detailed diagnostiques to identify the work that will need to be done to achieve our shared vision for the future of the Public Service, including updating policy and legislative frameworks, and tailoring departmental plans.
Tectonic Trends
To anticipate the future of work and prepare for change, it is important to keep in mind broader trends that could affect the Public Service, such as climate change and resource scarcity; demographic and social changes; technological breakthroughs; and urbanization, to name a few. Technological change continues to accelerate. Rudimentary automation and artificial intelligence will be augmented by ever more complex learning programs that will enable machines to do a broad range of repetitive, mundane, and higher-risk tasks. Data analytics will drive decision-making, based on increasing databases of biometric and behavioural data. Industrial applications will be based on an increasing array of sophisticated sensors and nano technology. Human interactions will be transformed by virtual and augmented reality.
Social change is also happening at a rapid pace. Broader societal objectives such as environmental stewardship and management of scarce resources are gaining ever more support. Increased life expectancy will necessitate changes in healthcare and wellness management, whereby data, technology, automation, artificial intelligence, and virtual reality will combine to change how and where basic health care services are delivered. Growing urbanization will continue to change infrastructure and service requirements across the country. Finally, as the Canadian population becomes increasingly diverse, the Public Service will need to mirror this diversity.
“…a transition to full telework capacity—a situation in which all workers who can plausibly work from home would work all of their hours from home—could, through reduced commuting, lead to a reduction in annual emissions of greenhouse gases of about 8.6 megatonnes of carbon dioxide equivalent in Canada. This represents 6% of the direct greenhouse gas emissions from Canadian households in 2015, and 11% of their emissions attributable to transportation that year.”
A View into the Future of Work
“Not since the industrial revolution have companies really had to think about work design, about what tasks get done and where do those tasks get done, and when and how do you deconstruct work so that it’s done in an optimal manner.”
Source: Global Talent Trends 2022, LinkedIn
These trends, and the upheaval of traditional ways of working caused by the Covid-19 pandemic, present us with a unique opportunity. This is not a debate about whether some or all employees should return to pre-pandemic working habits; it is something much larger. We will need to make choices about how and where work will get done, which types of tasks should be automated, where to invest in needed skills, and how to develop a workforce that is inclusive, innovative, forward-looking, and flexible. The Public Service is not alone in this moment of change; across the globe, we are seeing a fundamental shift from the future of work being a concept to a it being an operational reality.
The impacts of the Covid-19 pandemic on traditional ways of working offer many insights that can help us think about the future of work. Three lessons are particularly significant for the Public Service. First, work is not a place but an activity. The gravitational pull of the office has been broken and will likely continue to erode as technology and work culture evolve. Second, management by presence or by timecard is vastly over-used and inhibits employee flexibility. Third, the impacts of new ways of working are not uniform across a diverse workforce. For example, a 2021 survey conducted by Gartner found that 51% of women who weren’t working remotely before, but have been since the pandemic, feel their level of safety has increased and that knowledge workers with a disability are more likely to feel respected in a hybrid environment (81%) than when on-site (56%). Further, the Survey of Working Arrangements and AttitudesFootnote 2 suggests being able to work shorter and more flexible hours from home could help increase labour supply by appealing to many people who would otherwise not be in the labor force such as older workers, those caring for young children or older relatives, persons with disabilities, and those living in rural areas.
“…hybrid working from home increases average productivity by about five percent. In fact, the productivity gains seem to be rising as companies and employees learn how to take advantage of remote work opportunities. In-person work helps with creativity and innovation through formal and informal meetings. It can also be good for fostering an esprit de corps.”
It is also worth noting that organizations that had already invested in the tools to support telework were best able to continue operations with minimal interruption when the pandemic response necessitated off-site work. Finding ways to maximize the flexibility of how, where, and by whom work gets done leads to nimbler operations and an improved ability to respond to unforeseen circumstances.
The recent widespread remote work experiences are a launching point towards new ways of working that, if we are intentional about embracing, offer multiple benefits to the Government of Canada such as improved services, a nationally distributed workforce that mirrors Canada’s diversity, more efficient use of government-owned assets, and a reduced environmental footprint of operations.
A Public Service Journey to the Future of Work
The future of work in the Public Service can be mapped to the three dimensions of Public Service renewal: inclusive (workforce and the employee experience), equipped (the workplace and how work is enabled), and agile (the work and how outcomes are achieved). Four key questions, set out below, will aid in exploring each of these dimensions:
- How do we attract, retain and foster talent that is inclusive, skilled, diverse, and people-first?
- How do we organize flexible work models to move towards a distributed workforce?
- How do we organize and compensate work in a way that is equitable and that drives outcomes and employer competitiveness?
- How do we leverage HR systems and data to support strategic people-related decision-making?
These questions lead us to identify four imperatives that intersect and can lead us to view and re-invent “People Management”.
With planning organized around these imperatives and supported by research, data, change management, and the right culture, the future of work will emerge.
Four imperatives for a future-enabled Public Service
The Future of Work Framework
People management
Inclusive
Talent, Skills, & Inclusion
The Public Service is skilled, diverse, inclusive, accessible, and human-centric
Agile
Flexible Work Models
A distributed, flexible, productive workforce and welcoming workplace
Equipped
Organization of Work
The Public Service classifies and compensates work to facilitate agility and drive employer competitiveness in response to the changing nature of work
Digital & Data Driven
The Public Service is digitally enabled, and leverages HR systems and data to support strategic decision-making
Culture, Change Management, Mindsets & Behaviours
A Public Service that embodies the future of work vision
Imperative 1 – Talent, Skills, and Inclusion
The Public Service is skilled, diverse, inclusive, accessible, and human-centric
Context
Skilled: The market for talent is increasingly competitive. The Public Service will need to adopt a multi-pronged strategy to invest in the growth of existing employees (“build”), get the right talent to the right place at the right time (“borrow”), and hire talent to fill short-term needs and skills gaps (“buy”). This will require increasing the tools available to managers to win the war for talent as well as ensure that public servants have opportunities to advance their skill sets.
The skills requirements for the Public Service are rapidly changing, with ever greater emphasis on data analytics, technology, media, communication, and skills such as meta-cognitive skills and emotional intelligence. Basic data literacy, once a specialized skill, will be as common as typing is today. Data will be used in essentially every function, including core people enablement functions such as managing and continuously improving performance. Other skills that the Public Service will need to further cultivate include strategic foresight, prototyping, human-centred design, experimentation, systems thinking, storytelling and visualization, among others.
Recruitment will shift to focus on a candidate’s curiosity, empathy, initiative, and ability to learn certain skillsets, rather than on specific knowledge or perishable skills. Skills can be taught much more easily than initiative, curiosity, or empathy.
To address these skills gaps, Public Service competency frameworks need to continuously evolve and inform learning strategies, recruitment, and performance criteria.
The Public Service also requires a culture of continuous learning which includes space for formal training, experimentation, mentoring, and learning-by-doing. All of these learning strategies, and others, should be incorporated into a “learning career”, where employees are expected to use a portion of their paid working hours to enhance and maintain skills. Reskilling and continuous learning are becoming increasingly relevant in other sectors as well. According to a 2020 World Economic Forum report, 94% of business leaders expect employees to pick up new skills on the job, compared to 65% in 2018, making the market for talent even more competitive.
Diverse and Inclusive: Diversity is a strength for the Public Service, just as it is for private sector enterprises, bringing diverse perspectives and richness of experience for better policy and decision-making. To be an employer of choice for all Canadians, it is imperative that the Public Service continue to advance as awareness and understanding of concepts such as unconscious bias and colonialism continue to evolve. Diversity and inclusion considerations need to be meaningfully embedded in decision-making, including through systematic integration of GBA+ principles. Further, true inclusion is needed for people to feel like they can bring their whole selves to work and contribute everything they have to offer, and to maximize the potential of what the Public Service has to offer in service to Canadians.AT&T now invests around $250 million annually in T University, which enables existing employees to develop in-demand expertise in areas such as data science and cybersecurity. It also provides anywhere from $15 million to $34 million annually in tuition aidto support employees with learning outside of the company.
“Our research has repeatedly shown that gender and ethnic diversity, inclusion, and performance go hand in hand.”
People-First: To remain relevant and responsive to the needs of Canadians, the Public Service’s approach to talent will be key to its success in the years to come. As the largest employer in Canada, the Public Service can also influence standards for employer excellence.
Employee experience is a wholistic lens that considers multiple factors and is increasingly viewed as a key indicator of organizational performance. In addition to more traditional indicators of harassment and discrimination, it includes providing an accessible environment where employees identify with the purpose of their work, are able to pursue areas of interest, and are trusted and valued for their contributions. It also has a focus on individual wellness, including physical and mental health, beyond traditional mechanisms such as leave and health benefits. Further, people-first workplaces set aside traditional assumptions about place of work, hours of work, and hierarchy.
What does a skilled, diverse, inclusive, and people-first Public Service look like in the future?
- The Public Service has a competency framework providing a common way of defining and measuring skills. It understands the skills it has and the skills it needs and works to close the gaps in order to provide services that meet Canadians’ evolving needs.
- The way we identify, recruit, develop, mobilize, incentivize, and reward leadership is centered around a life-cycle approach to talent. Expectations for senior leaders to drive an inclusive culture are embedded in key leadership competencies and leader character attributes. A mindset of leadership at all levels is instilled and valued.
- Managers can access people with the skill sets that they need in a timely manner. There are minimal barriers to moving in, out and/or across the Public Service to address government priorities and help employees gain new skills and experience.
- The Public Service manages talent and cultivates a learning culture for all public servants, including managers. Learning opportunities, both formal and informal, are made available and are a part of the employee’s regular activities.
- Performance management is continuous, multi-directional, and focuses on learning and improvement. Managers are not just supervisors but coaches providing and supporting challenging work. Performance and talent management are integrated to increase employee engagement, learning, leadership development, succession planning, and productivity, and the linkages between them, are strengthened.
- We have a language training framework that takes into account the specific needs of Employment Equity groups and includes options for distance language training.
- Technology, automation, and artificial intelligence are a source of complementary “talent” to human skills.
Leading up to 2025, on average, companies estimate that around 40% of workers will require reskilling of six months or less.
- The Public Service pro-actively re-skills employees whose positions may be affected by new technologies or approaches.
- The Public Service is accessible and represents the diversity of Canada’s people from the perspective of the Public Service as a whole, as well as organizations, functions, and levels.
- All employees have the skills to embed considerations such as GBA+, official languages, employment equity, and accessibility in their work.
- Disaggregated workforce data is collected and used to monitor impacts of change on various groups.
- The Public Service is inclusive, and employees feel their ideas are respected and valued.
- The Public Service is a model of reconciliation and works with Indigenous employees towards improving the work environment, to de-colonize the workplace, its culture, and its processes.
"Fully including Indigenous Peoplesin Canada’s Public Service will enhance Canada’s ability to identify itself as a fully inclusiveworkplace."
- The Public Service works with Black, Indigenous, and other racialized employees to develop solutions to address the barriers and disadvantages they face in Public Service workplaces and systems.
- Employees, including managers, see their work as meaningful. Public servants are curious and driven to contribute ideas, innovate, and improve outcomes. They cultivate relationships that foster psychological safety and opportunities to provide meaningful input into decision-making.
- Managers and employees alike see their jobs as being compatible with their health and psychological well-being. Disaggregated data on health and psychological well-being is regularly sought out and leveraged to adjust employee supports accordingly. Team members are engaged with each other and take steps to ensure the workplace is supporting wellness and not contributing to illness.
- People-first is the basis for designing people enablement strategies and systems and delivering HR services and services to Canadians.
- HR develops data-driven people strategies to enable future-focused business strategies.
Imperative 2 – Flexible Work Models
A distributed, flexible, productive workforce and a welcoming workplace
Context

Figure 3 - Text version
Firms that don't offer weekly work-from-home days risk losing more than 40% of their employees according to surveys of more than 10,000 Americans conducted in June and July 2021. Bar graph: If my employer announced that all employees must fully return to the worksite on August 1, 2021, I would: 57.2% comply and return, 36.4% return but look for a WFH job, 6.4% quit, even without another job.
“…people of color and highly educated women with young childrenplace especially high value on the ability to work from home part of the week. A ban on working from home risks a rush to the exitby these employees.”
The question to be addressed is not how to return to “normal” but how to create a new normal that includes a range of flexibilities around how, where, and when work is done that benefit both employees and managers. Even as some work will need to remain attached to a worksite, maximizing flexibility in work models (e.g. through compressed schedules) is an opportunity to improve broader outcomes, including:
Improved employee experience, talent attraction and retention, and productivity. Increased flexibility for how and where work is done is an important tool for improving employee experience, with positive impacts for accessibility, talent recruitment, retention, and overall productivity.
A more geographically dispersed and diverse workforce. Untying work from worksites provides the opportunity to increase regional diversity in the Public Service workforce and more evenly distribute the economic benefits of Public Service employment across the country (see figure 2). This would contribute to more representative and inclusive policies, programs, and services, and facilitate the recruitment of top talent to the Public Service.

Figure 4 - Text version
| Province | # of Federal Public Service Employees | % of Federal Public Service employees | Canadian Population | % of Canadian Population |
|---|---|---|---|---|
| Yukon | 427 | 0.1% | 40,232 | 0.1% |
| Northwest Territories | 571 | 0.2% | 41,070 | 0.1% |
| Nunavut | 334 | 0.1% | 36,858 | 0.1% |
| British Columbia | 26,464 | 8.5% | 5,000,879 | 13.5% |
| Alberta | 17,511 | 5.6% | 4,262,635 | 11.5% |
| Saskatchewan | 6,242 | 2.0% | 1,132,505 | 3.0% |
| Manitoba | 12,156 | 3.9% | 1,342,153 | 3.6% |
| Ontario (excluding NCR) | 43,503 | 14.0% | 13,088,928 | 35.4% |
| National Capital Region | 134,817 | 43.4% | 1,488,307 | 4.0% |
| Québec (excluding NCR) | 33,981 | 10.9% | 8,148,540 | 22.0% |
| New Brunswick | 10,881 | 3.5% | 775,610 | 2.1% |
| Nova Scotia | 11,806 | 3.8% | 969,383 | 2.6% |
| Prince Edward Island | 3,888 | 1.3% | 154,331 | 0.4% |
| Newfoundland and Labrador | 6,853 | 1.3% | 510,550 | 1.4% |
| Outside Canada | 1,323 | 0.4% |
Reduced real estate costs and greening operations. Adopting flexible and distributed work models is a necessary step in reducing the government’s real estate portfolio as it will allow workspace to be right sized to work that needs a work site and for supporting employee experience. Further, as recommended in the TBS Horizontal Fixed Asset Review, as the federal real property portfolio evolves it can become a strategic enabler by advancing corporate priorities including furthering Indigenous reconciliation, driving digital transformation, and supporting climate resilience and sustainable development.
“With 32,000 buildings, 23 million square meters (m2) of floor space, approximately 20,000 engineering assets, and 39 million hectares of land, the Government of Canada owns and manages the largest fixed asset portfolio in Canada. The government spends approximately $10 billion annually to administer this portfolio.”
As the benefits of a flexible and distributed workforce are realized it will be important to manage the risk of inequities in opportunities and treatment between on-site and off-site employees. This risk could have larger employment equity implications if some demographic groups are more likely to telework than others.
What does a flexible and distributed Public Service look like in the future?
GC Talent Cloud found that job posters that advertised telework received 63% more applications
- Work is tied to a worksite only when necessary. If the work can be performed off-site, the employee can work off-site and participate in their team and organization through virtual collaborative technologies if they prefer.
- For positions where all work can be performed off-site, employees can be located throughout Canada.
- Where operationally unfeasible to work off-site, employees are afforded different flexibilities in how and when work is done.
- The workplace footprint is optimized. Workspace is unassigned by default; some space is maintained and designed for specific employees where necessary. Some space is maintained for group activity such as employee training, collaboration activities, and/or other purposes altogether.
- There is seamless secure, strong, and consistent connectivity, and technology allows the distributed workforce to fully participate and collaborate, regardless of work location. Technology that becomes available in the future, over time, expands the proportion of positions that can be performed off-site.
- Regardless of work location, employees start with the same basic responsibilities and are treated equally.
- Managers have the support, resources, and training to be proficient at leading distributed teams. They maintain a healthy culture that supports equitable treatment of employees irrespective of where the work is performed, they are aware of their potential biases (in favour of on-site employees), and inclusion of off-site employees in decision-making is continuously pursued which helps to avoid unintended consequences.
- Performance assessment for both onsite and offsite employees is focused on outcomes and intricately tied to talent management. Employees are evaluated based on quality of work and outcomes achieved while still meeting learning objectives and maintaining a healthy work cadence and environment.
- The workforce promotes and maintains healthy practices. Technology is used to enhance flexibility rather than to support 24/7 availability for work.
Imperative 3 – Organization of Work
The Public Service classifies and compensates work to facilitate agility and drive employer competitiveness in response to the changing nature of work
Context
“By 2025, 85 million jobs may be displaced by a shift in the division of labour between humans and machines, while 97 million new roles may emerge that are more adapted to the new division of labour between humans, machines and algorithms.”
Technology, including AI and automation, is changing the nature of work. Automation is expected to replace many tasks currently undertaken by people. This is likely to require a mix of strategies including re-skilling and targeted recruitment. It will also require re-organizing work, by consolidating non-automated tasks, which may also have implications for organizational structures. Both automation and artificial intelligence will shift work to more complex tasks with increased reliance on cognitive human skills. In the Core Public Administration alone, approximately 42% of employees work in Administrative Services, Program Administration, or Clerical and Regulatory groups, which have traditionally been the most susceptible to changes in technology and task automation.
“Companies that rapidly allocate talentto opportunities have more than twice the likelihood of strong performance, and they also deliver better resultsper dollar spent.”
The Public Service also needs to be able to acquire the skills and capacity it needs when it needs them. The work of public servants should evolve along with the role of the Public Service. Foresight is required to identify roles that the Public Service will be called on to play in the face of continued global climate and health crises. The COVID-19 crisis proved that we can rapidly deploy resources to priorities in times of need. Drawing on this success, the Public Service could benefit from the increased use of more agile approaches to organizing work, such as teams and individuals who do not have regular files but are deployed to priorities on-demand based on their skill sets. Some examples of this model include departmental surge teams, centres of expertise, and the Free Agents program.
Agility within the workforce, in terms of the ability to move people to where they could have greater impact, could be improved through the focus on continuous learning referenced above, particularly as it relates to lateral development, broadening of skills, and re-skilling.
Agility can also be addressed through diverse employment models, as traditional Public Service employment may not be attractive to all profiles in the labour market. To remain competitive and drive outcomes, the Public Service would benefit from the ability to access niche high-demand skillsets quickly to complement its existing workforce. Temporary resources also allow the Public Service to be more flexible, responding to changing organizational mandates.
“Today’s governments are being asked to solve the problems of the 21st century with a workforce and managerial structure designed for a different era. They continue to address major challenges by creating new, permanent departments and agencies — an unsustainable model in a world of rapidly changing demands fueled by equally rapidly evolving technology.”
Currently, approximately 82% of the Public Service are indeterminate employees and there are 28 collective agreements and 74 occupational groups in the Core Public Administration. In the future, new employment models may emerge. There may be different categories of workers than exist now as work becomes more task-focused and disconnected from how we currently think of jobs and roles. The next generation of workers may not necessarily spend their entire careers in the Public Service and may opt instead to move in and out to broaden their experience. As work is re-organized, this is also likely to have implications for organizations. The future may include flatter structures, and work and workers that exist outside of individual organizations.
Consideration also needs to be given to how work is rewarded, given potential changes to categories of work and workers. For example, the Public Service could offer options within rewards packages that are tailored to employees’ individual circumstances, to increase its competitiveness as an employer. “One-size-fits-all” may not be the way of the future when it comes to organizing and rewarding work.
“Motivations for work are changing. Gains in living standards over the past 150 years are allowing us to spend less of our time working, but are raising expectations about what a job should provide.”
Finally, a people enablement strategy that is people-first should envisage work from an employee perspective: the Public Service needs to provide fulfilling work that is mission-driven and citizen-focused and make it accessible to a diverse workforce. Understanding the employee experience requires engaging employees and understanding their needs, behaviours, and experiences, which can provide rich data to help inform future strategies and initiatives to improve the public service.
How does the Public Service organize work to drive outcomes and compensate work in a way that is equitable and drives employer competitiveness in the future?
- Technology, including automation and artificial intelligence, is integrated quickly and ethically, and leveraged to improve outcomes and provide more fulfilling work.
- The Public Service is agile, quickly and easily moving human resources to where they are needed most within and between organizations.
- Organizations maintain a mix of content and functional expertise and optimally assign employees with the right type of expertise to the right priorities and challenges. Organizations regularly assess the latter through focused reviews.
- The Public Service has surge capacity that can be deployed as needed.
- When agility cannot be sufficiently achieved through surge capacity, organizations can access skills from the labour market quickly and effectively.
- The way in which work is rewarded contributes to the Public Service’s ability to compete for skilled and diverse talent by being equitable, competitive, and flexible.
- Organizations needing resources with in-demand skills have the flexibility to offer competitive compensation.
- Employees have the flexibility to choose a rewards package that is tailored to their personal goals, life stages, and individual circumstances.
- As much as possible, work arrangements are adaptable to individual needs, including time and place of work and terms and conditions of employment.
- Employees are provided with work that both contributes to organizational priorities and offers experiences that are meaningful and responsive to their development needs. The most skilled talent is assigned to the most challenging problems, which improves engagement of top talent and optimizes outcomes. Data-driven insights inform decision-making vis-à-vis aligning work with improvement of organizational outcomes.
Imperative 4 – Digital and Data Driven
The Public Service is digitally enabled, and leverages HR systems and data to support strategic decision-making
Context
“Today, workforce data from multiple sources present opportunities to manage public employees through evidence-based HR policies. Governments are thus increasingly able to recruit, deploy, train, motivate and retain their employees in a scientific and analytic way based on objective HR data.”
Data and automation will be among the most important commodities for enabling people in the future. User-centred HR systems have the potential to provide data that supports self-management, workforce management and enterprise decision-making, reducing bias and risk, increasing transparency and objectivity, and improving decisions and outcomes.
HR systems also have the potential to automate what has traditionally been manual, human-driven, HR processes and transactions, allowing managers and HR professionals alike to focus on complex tasks like interpretation, decision-making and strategizing. They can also help promote agility, and improve consistency and productivity through increased data sharing and decreased processing time and errors, in keeping with security and privacy, and help make informed decisions based on insightful data.
What does a Public Service that leverages HR systems and data to improve people enablement look like in the future?
- Users are at the centre of HR processes and systems, and the HR function is more strategic.
- HR systems provide seamless and timely support to users throughout the employee life cycle.
- HR systems enable staffing to be achieved in a matter of days, not weeks or more. Succession planning is deliberate and conducted on an enterprise-wide basis.
- A digital employee ID allows a “tell us once” approach where employees provide static HR information and supporting documents once in their career and/or in one place with opportunities to continually auto-populate and update.
- When employees move to another organization, their information is instantly and securely accessible by the new organization. If employees pursue career goals outside of the Public Service their information is retained to enable them to return with the experience and knowledge they have acquired.
- User-friendly and AI-powered systems help employees and managers to get quick answers to HR questions.
- HR systems are reliable, flexible, and adaptable to evolving needs, while maintaining enterprise coherence. They also support interoperability between HR and other enabling functions.
- HR systems easily generate integrated data to support people analytics and decision-making.
- Employees can easily access their own HR data, individual metrics, and AI-based insights (e.g., learning plan suggestions).
- Managers and organizations have access to data that supports workforce management, including real-time business intelligence and predictive data insights (e.g., skills-based data for targeted recruitment).
- Central agencies and central service providers have access to enterprise-wide HR data that supports enterprise decision-making and services, including real-time business intelligence and predictive data insights.
- Disaggregated data is regularly leveraged to understand trends and/or systemic barriers, and to drive actions towards achieving a more inclusive workplace.
- HR decisions leverage multiple sources of evidence to improve outcomes.
- Users have the skills to use HR data to inform their decision-making.
- Experimentation in people enablement is a common practice to generate evidence.
Success Factors – Culture, Change Management, Mindsets and Behaviours
Organizational culture is built on the mindsets, behaviours, and norms that are accepted and reinforced in an organization. To achieve the future of work to which we aspire, effort will be required to develop a culture that aligns with this vision. The importance of an aligned culture cuts across all four imperatives; without it, it may be difficult to reach the full potential that modernization can offer the Public Service.
While the Values and Ethics Code of the Public Service remains the core articulation of our shared values, it is important that the Public Service identify and clearly articulate additional elements of culture that could help us move towards the future of work, including:
- engaging employees regularly to understand evolving needs, gather data, and inform decision-making in order to understand the culture we have, the culture we need, and how to close the gaps.
- sustaining diversity and inclusion efforts, with considerations such as GBA+, official languages, employment equity, and accessibility embedded in every policy, program, and decision point, and to achieve a sense of belonging for all Public Service employees.
- equipping the workforce with the knowledge and skills to adapt to future needs by and incentivizing ongoing learning and professional development to help them to achieve their full potential and deliver results.
- encouraging senior leaders to drive and embody change by aligning incentives that influence culture and reinforcing their team’s culture in key moments such as onboarding, employee recognition, and promotion.
- recognizing that culture is nurtured and maintained through daily interactions and a sense of belonging and contributes to our common purpose to offer the best possible service to Canadians with sound stewardship of public funds.
Conclusion
“The next decade will be one of significant experimentation around work. There is still much to learn about which approaches will be effective. There’s also a large blank canvasfor creative new approaches. But one thing is clear: Firms that doggedly cling to old modes of thinking will struggle to stay relevant.”
The capacity of the Public Service to be more resilient to the shifting trends and emerging crises will rely on its ability to gather evidence, make strategic choices, and support employees through change. When imagining the future Public Service, it is necessary to explore all practices and structures interconnected with people enablement including, for example, digital and real-property elements, not just HR approaches. Some questions to help start thinking about what the future of work could look like include:
- What possibilities listed resonate the most with you/your community?
- What else could be explored, considered, amplified?
- What should be done first?
Wherever the Future of Work leads, implementation should be informed by research, experimentation, and the collection of data to ensure the actions we take are moving us in the direction we want to go. As we experiment with new ways of working and enabling public servants, we will be looking for partners who are interested in testing new approaches and openly sharing the results so we can all learn and move forward together.
Making change in a large organization is a complex process. Implementation of this vision will require the Public Service and its employees to adapt on many fronts including culture, diversity and inclusion, legislation, and internal processes. A dedicated change management strategy will be needed to support public servants and bring about the changes we desire.
This is a once in a generation opportunity for public administration innovation in Canada. Making the most of it will require sustained effort and the participation of all public servants. Doing so will be worth it. Meeting the opportunity with bold actions will increase the ability of the Public Service to nimbly respond to priorities, be resilient to future challenges, and provide a competitive employee experience.
Data Pack
Key information on the public service
In this section
Themes
The Data Pack provides a quick overview and key facts on the Federal Public Service to aid decision makers organized into five key themes
- Expenditures
- People
- Employees
- Executives
- Diversity & Inclusion
- Digital
- Assets and Procurement
- Greening government
- Regulations
This edition
This edition of the Data Pack includes data reflective of the impact of the COVID-19 pandemic
As a result, data presented here does not represent long-term trends but rather, reflects the significant resources mobilized since March 2020 to support the Government of Canada’s collective emergency response:
- For example, the government’s largest planned statutory expenditure in 2020-21 was $84.4B under the Public Health Events of National Concern Payments Act. This was up from the highest statutory expenditure of $42.2B for Old Age Security payments in 2019-20. In 2021-22, planned statutory expenditures resemble pre-pandemic levels with maximum planned expenditures of $47.2B for Old Age Security payments.
Key Facts
Expenditures
- Voted expenditures have generally risen over time, reaching $119.7B in 2019-20, though expenses have stayed roughly constant as a percentage of GDP (16%)
- Major transfers represent almost half of total government expenses, while other direct program expenses cover another third
- Of the $260.4B in planned 2020-21 statutory expenditures (payments made under legislation previously approved by Parliament), major transfer payments account for 83%
- Planned statutory expenditures increased in 2020-21, from 61% of government spending in 2018-19 to 68% of planned spending in 2020-21. This is largely due to an increase in transfers to persons, as part of the COVID response
People
- The Federal Public Sector is the largest employer in Canada, with 245,739 employees in the Core Public Administration and 73,862 in separate agencies
- The percentage of bilingual positions has increased from 35.7% in 2000 to 42.4% in 2020
- Overall, employment equity representation of women, Indigenous peoples and members of visible minorities across the public service has been improving, but there is much more work to be done. Significant representation gaps persist at executive levels
Digital
- Annual IT operating expenditure for 2019-20 was $7.5B
- The number of Access to Information Requests has steadily increased since 1983, due mainly to a significant increase in requests submitted to Immigration, Refugees and Citizenship Canada since 2012-13. Operational costs related to these requests are also rising
- 42% of GC services can be completed on-line from end-to-end
- In 2019-20, internal and external clients completed 425 million transactions (including border crossings) with the Government of Canada
Assets and Procurement
- In 2019-20, the net book value of the Government of Canada’s tangible capital assets was $83.6B
- On a nine-year average, the federal government has awarded $18.5B in contracts annually (over 382,000 contracts)
- As of fiscal year 2019-20, emissions from buildings and conventional fleet have been reduced by 34.6% relative to 2005-06 levels
Regulations
- 150 to 200 proposals for new or amended regulations and 200 to 300 Orders in Council are reviewed and approved annually by Treasury Board
Expenditures - EMS
Organizations in the Government of Canada
| Departments (e.g. Department of Industry) |
22 |
|---|---|
| Special Operating Agencies (e.g. Canadian Coast Guard) |
12 |
| Departmental Agencies Includes 6 Agents of Parliament (e.g. Office of the Auditor General) |
54 |
| Parliamentary Entities (e.g. House of Commons) |
7 |
| Departmental Corporations Includes 3 Service Agencies (e.g. Canada Revenue Agency) |
20 |
| Parent Crown Corporations (e.g. Canada Post Corporation) |
43 |
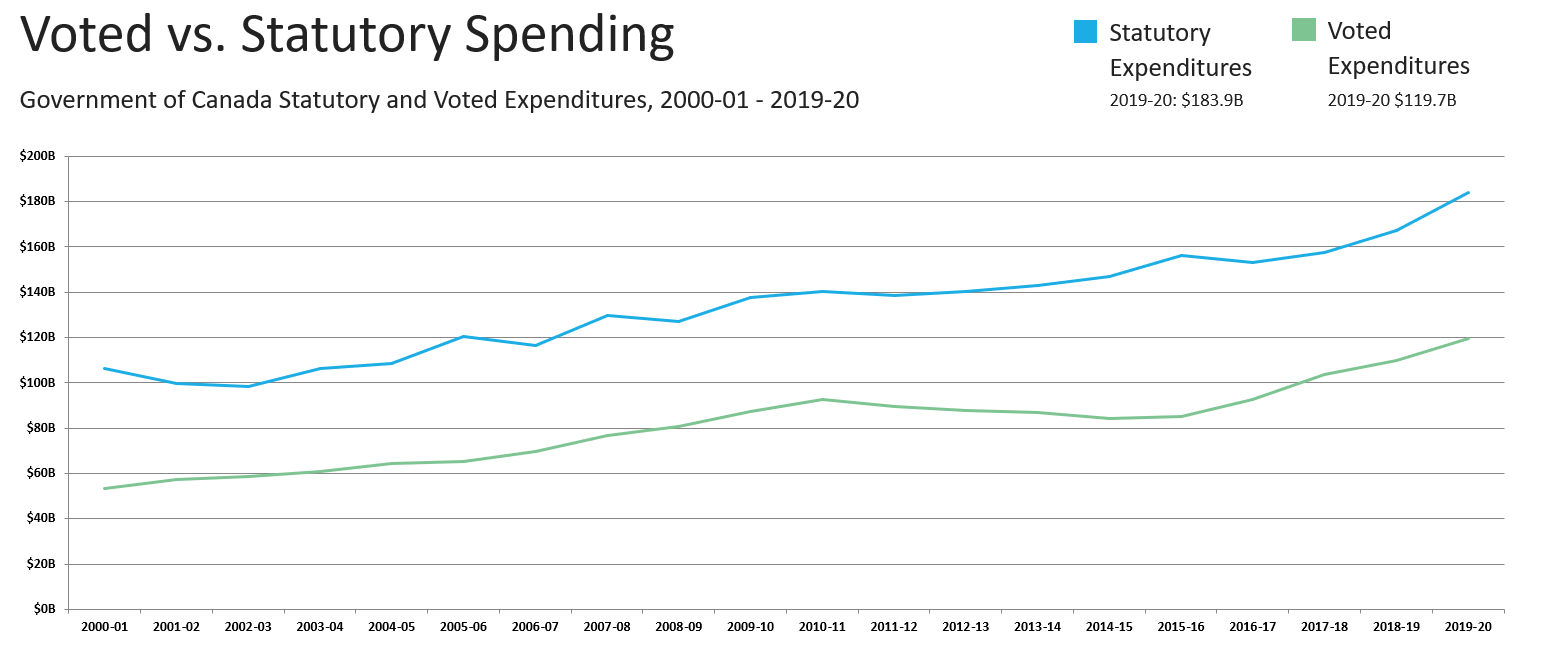
Figure 5 - Text version
Comparative line graph describing the evolution of voted expenditures and statutory expenditures from the 2000-2001 government fiscal year to the 2019-2020 government fiscal year. The X-axis shows government fiscal year, and the Y-axis shows expenditures in billions.
In 2000-2001, voted expenditures stood at 53.5 billion dollars, and statutory expenditures stood at 99.8 billion dollars.
In 2001-2002, voted expenditures stood at 57.1 billion dollars, and statutory expenditures stood at 99.8 billion dollars.
In 2002-2003, voted expenditures stood at 58.5 billion dollars, and statutory expenditures stood at 98.3 billion dollars.
In 2003-2004, voted expenditures stood at 61.0 billion dollars, and statutory expenditures stood at 106.4 billion dollars.
In 2004-2005, voted expenditures stood at 64.2 billion dollars, and statutory expenditures stood at 108.6 billion dollars.
In 2005-2006, voted expenditures stood at 65.2 billion dollars, and statutory expenditures stood at 120.3 billion dollars.
In 2006-2007, voted expenditures stood at 69.6 billion dollars, and statutory expenditures stood at 116.3 billion dollars.
In 2007-2008, voted expenditures stood at 76.6 billion dollars, and statutory expenditures stood at 129.7 billion dollars.
In 2008-2009, voted expenditures stood at 80.7 billion dollars, and statutory expenditures stood at 127.1 billion dollars.
In 2009-2010, voted expenditures stood at 87.5 billion dollars, and statutory expenditures stood at 137.5 billion dollars.
In 2010-2011, voted expenditures stood at 92.6 billion dollars, and statutory expenditures stood at 140.4 billion dollars.
In 2011-2012, voted expenditures stood at 89.7 billion dollars, and statutory expenditures stood at 138.5 billion dollars.
In 2012-2013, voted expenditures stood at 87.7 billion dollars, and statutory expenditures stood at 140.1 billion dollars.
In 2013-2014, voted expenditures stood at 86.9 billion dollars, and statutory expenditures stood at 143.1 billion dollars.
In 2014-2015, voted expenditures stood at 84.2 billion dollars, and statutory expenditures stood at 147.0 billion dollars.
In 2015-2016, voted expenditures stood at 85.2 billion dollars, and statutory expenditures stood at 156.2 billion dollars.
In 2016-2017, voted expenditures stood at 92.8 billion dollars, and statutory expenditures stood at 153.2 billion dollars.
In 2017-2018, voted expenditures stood at 103.7 billion dollars, and statutory expenditures stood at 157.7 billion dollars.
In 2018-2019, voted expenditures stood at 109.8 billion dollars, and statutory expenditures stood at 167.1 billion dollars.
In 2019-2020, voted expenditures stood at 119.7 billion dollars, and statutory expenditures stood at 183.9 billion dollars.
Statutory expenditures represent payments made under legislation previously approved by Parliament. They generally include transfers to other levels of government (e.g. Canada Health Transfer, Fiscal Equalization) and transfers to persons (e.g. Old Age Security).
Voted Expenditures require annual approval from Parliament. They generally include operating and capital requirements of departments and some transfer payment programs.
Source: TBS, December 2020
Breakdown of Statutory Authorities
Of the $217.5B in planned 2021-22 statutory expenditures, major transfer payments account for 68.5%.
Of the 250 statutory items listed as of 2021-22 Supplementary Estimates A, the 10 largest are:
| Organization | Item | Authorities |
|---|---|---|
| Department of Employment and Social Development | Old Age Security payments (Old Age Security Act) | $47.2B |
| Department of Finance | Canada Health Transfer (Part V.1 - Federal-Provincial Fiscal Arrangements Act) | $43.1B |
| Department of Finance | Fiscal Equalization (Part I - Federal-Provincial Fiscal Arrangements Act) | $20.9B |
| Department of Finance | Interest on Unmatured Debt | $16.2B |
| Department of Finance | Canada Social Transfer (Part V.1 - Federal-Provincial Fiscal Arrangements Act) | $15.5B |
| Department of Employment and Social Development | Guaranteed Income Supplement Payments (Old Age Security Act) | $14.6B |
| Department of Employment and Social Development | Payments for the Canada Recovery Benefit pursuant to the Canada Recovery Benefits Act | $12.3B |
| Canada Revenue Agency | Climate Action Incentive Payment | $5.86B |
| Department of Finance | Other Interest Costs | $5.13B |
| Office of Infrastructure of Canada | Contributions related to the Canada Community-Building Fund (Keeping Canada's Economy and Jobs Growing Act) | $4.49B |
| All Other Statutory Items | $32.2B | |
| Total | $217.5B |
Note: Other major transfers to persons included in the Budget forecast but not published in the Estimates include Employment Insurance Benefits (paid from the Employment Insurance Operating Account) and the Canada Child Tax Benefit (paid through the tax system rather than appropriations).
Source: GC InfoBase, June 2021
Breakdown of GC Expenses
GC Expenses in 2019-20, by Type of Programming
Major transfers represent half of total government expenses, while other direct program expenses cover another third.
Direct Program Expenses ($162.8B)
Non-Direct Program Expenses ($210.7B)
Note: Net actuarial losses included under ‘Other Direct Program Expenses’.
Source: Annual Financial Report of the Government of Canada, 2019-20
Net Budgetary Expenditures
Planned statutory expenditures (payments made under legislation previously approved by Parliament) as a proportion of government spending are decreasing, from 60.6% in 2019-20 to 56.7% in 2021-22. Overall government spending is increasing from $303.6B in 2019-20 to $383.4B planned for 2021-22 due to the COVID-19 response.
Parliamentary Authorities
$383.4B as of 2021-22 Supplementary Estimates A
| Voted | Statutory | |
|---|---|---|
| Transfer to Persons | $62.8B | |
| Transfer to Other Levels of Governments | $2.6B | $86.6B |
| Other Transfer Payments | $61.6B | |
| Operating and Other Budgets* | 91.3B | |
| Capital Payments | $10.3B | |
| Other Statutory Payments | $46.7B | |
| Public Debts | $21.3B | |
| Total | $165.8B (43.3%) |
$217.5B (56.7%) |
*Other Budgets include: TB central votes, payments to Crown corporations.
Source: TBS, June 2021
Parliamentary Authorities in 2020-21
$383.4B as of Supplementary Estimates A
Voted: $165.8B, 43.3%
Statutory: $217.5B, 56.7%
Composition of Actual Expenditures, 2019-20
$303.6B as at Public Accounts 2019-20
Voted: $119.7B, 39.4%
Statutory: $183.9B, 60.6%

Figure 6 - Text version
| Year | Authorities Available | Expenditures |
|---|---|---|
| 2000-2001 | $56,281,843,494 | $53,537,319,238 |
| 2001-2002 | $60,112,380,622 | $58,511,725,864 |
| 2002-2003 | $62,100,877,459 | $58,511,725,864 |
| 2003-2004 | $66,469,403,726 | $61,037,036,358 |
| 2004-2005 | $69,592,889,313 | $64,217,385,492 |
| 2005-2006 | $70,379,179,525 | $65,210,027,059 |
| 2006-2007 | $75,825,284,975 | $69,633,087,434 |
| 2007-2008 | $84,635,295,932 | $76,603,718,101 |
| 2008-2009 | $87,343,158,866 | $80,677,910,663 |
| 2009-2010 | $97,629,693,338 | $87,471,108,579 |
| 2010-2011 | $104,281,201,649 | $92,636,171,227 |
| 2011-2012 | $99,894,737,416 | $89,717,871,422 |
| 2012-2013 | $98,646,872,817 | $87,708,965,710 |
| 2013-2014 | $94,753,671,352 | $86,881,410,076 |
| 2014-2015 | $93,954,663,634 | $84,160,464,446 |
| 2015-2016 | $95,358,197,661 | $85,169,699,945 |
| 2016-2017 | $103,671,334,330 | $92,748,873,806 |
| 2017-2018 | $115,035,108,699 | $103,688,179,872 |
| 2018-2019 | $123,594,789,126 | $109,783,245,643 |
| 2019-2020 | $135,125,309,893 | $119,731,891,080 |
* Budgetary authorities and expenditures exclude non-budgetary outlays related to loans, investments and advances.
** Voted authorities and expenditures are approved through supply bills with unused authorities lapsing at the end of the year. They exclude spending that is authorized on a continuing basis through statutes such as the Federal-Provincial Fiscal Arrangements Act or the Employment Insurance Act.
Source: TBS, December 2020

Figure 7 - Text version
| Year | GDP |
|---|---|
| 2000-2001 | 15.8% |
| 2001-2002 | 15.4% |
| 2002-2003 | 15.4% |
| 2003-2004 | 15.3% |
| 2004-2005 | 15.9% |
| 2005-2006 | 14.9% |
| 2006-2007 | 15% |
| 2007-2008 | 15% |
| 2008-2009 | 14.9% |
| 2009-2010 | 17.6% |
| 2010-2011 | 16.5% |
| 2011-2012 | 15.5% |
| 2012-2013 | 15.1% |
| 2013-2014 | 14.6% |
| 2014-2015 | 14.1% |
| 2015-2016 | 14.8% |
| 2016-2017 | 15.3% |
| 2017-2018 | 15.4% |
| 2018-2019 | 15.6% |
| 2019-2020 | 16.2% |
*Expenses are recorded when incurred, as opposed to expenditures which are recorded when the cash is paid. Expenses encompass all spending by the Government of Canada, including direct program expenses, major transfers to people and other levels of government and public debt charges.
Source: Fiscal Reference Tables, 2020

Figure 8 - Text version
Line chart comparing the actual expenditures and authorities from the 2012-2013 government fiscal year to the 2020-2021 government fiscal year. The X-axis shows government fiscal year, and the Y-axis shows actual expenditures and authorities in billions.
In 2012-2013, expenditures stood at 228 billion dollars and authorities stood at 240 billion dollars.
In 2013-2014, expenditures stood at 230 billion dollars and authorities stood at 239 billion dollars.
In 2014-2015, expenditures stood at 231 billion dollars and authorities stood at 243 billion dollars.
In 2015-2016, expenditures stood at 241 billion dollars and authorities stood at 253 billion dollars.
In 2016-2017, expenditures stood at 246 billion dollars and authorities stood at 259 billion dollars.
In 2017-2018, expenditures stood at 261 billion dollars and authorities stood at 275 billion dollars.
In 2018-2019, expenditures stood at 277 billion dollars and authorities stood at 293 billion dollars.
In 2019-2020, expenditures stood at 304 billion dollars and authorities stood at 321 billion dollars.
In 2020-2021, expenditures stood at 440 billion dollars and authorities stood at 475 billion dollars.
In 2021-2022, expenditures stood at 376 billion dollars and authorities stood at 417 billion dollars.
Line chart describing the planned government spending from the 2020-2021 government fiscal year to the 2022-2022 government fiscal year. The X-axis shows government fiscal year, and the Y-axis shows planned spending in billions.
For 2020-2021, planned spending amounts to 305 billion dollars.
For 2021-2022, planned spending amounts to 307 billion dollars.
For 2022-2023, planned spending amounts to 309 billion dollars.
Net budgetary actual authorities and expenditures for all organizations are sourced from the Public Accounts of Canada.
Planned expenditures for most organizations are sourced from Departmental Plans. Where planned spending information is not available (notably for Parliamentary Entities, the Office of the Governor General's Secretary, the Canadian Security Intelligence Service, the Communication Security Establishment, the International Joint Commission (Canadian Section) and most Crown Corporations), for illustrative purposes only, the graphic presents these organizations’ 2020-21 Main Estimates figures as being constant across the three planning years.
Source: GC InfoBase, December 2020
Federal Government Compensation
$65.8 billionFootnote 3 Total Federal Government Compensation Costs (2019-20)
Salaries (52%)
Negotiated for unionized and determined by TB for non-unionized
Other Wage Costs (4%)
E.g. overtime, allowances, and premiums. Negotiated for unionized and determined by TB for non-unionized
Benefits (27%)
Includes health and dental care plan, disability and life insurance plans, sick leave, veterans' benefits and RCMP Pensioners' benefits
Pensions (12%)
Excluded from bargaining but consulted upon regularly
Employer Obligations (3%)
E.g. CPP/QPP, EI, Payroll Taxes
Consolidated Crown Corps (3%)
Total personnel costs for consolidated Crown Corporations listed in Public Accounts 2019
Source: TBS, June 2021

Figure 9 - Text version
Comparative line graph describing Government of Canada personnel expenses. The Y-axis shows the dollars in billions, and the X-axis shows the date.
In the 2010 to 2011 fiscal year, personnel expenses were $42,297,102,000 and professional and special services were an additional $7,902,900,000.
In the 2011 to 2012 fiscal year, personnel expenses were $43,837,673,000 and professional and special services were an additional $7,997,818,000.
In the 2012 to 2013 fiscal year, personnel expenses were $46,133,475,000 and professional and special services were an additional $7,513,860,000.
In the 2013 to 2014 fiscal year, personnel expenses were $44,993,653,000 and professional and special services were an additional $7,753,524,000.
In the 2014 to 2015 fiscal year, personnel expenses were $43,810,483,000 and professional and special services were an additional $8,090,232,000.
In the 2015 to 2016 fiscal year, personnel expenses were $50,170,703,000 and professional and special services were an additional $8,353,052,000.
In the 2016 to 2017 fiscal year, personnel expenses were $50,107,857,000 and professional and special services were an additional $9,701,836,000.
In the 2017 to 2018 fiscal year, personnel expenses were $60,293,462,000 and professional and special services were an additional $10,404,283,000.
In the 2018 to 2019 fiscal year, personnel expenses were $57,682,000,000 billions and professional and special services were an additional $11,036,000,000.
In the 2019 to 2020 fiscal year, personnel expenses were $65,793,806,000 and professional and special services were an additional $11,042,332,000.
From 2010-11 to 2019-20, personnel expenses averaged $48.8B. As of 2019-20, personnel expenses were $65.8B.
Personnel expenses include ‘net actuarial losses’ which, as of the 2019-20 Public Accounts, displays this amount separately. In 2019-20, personnel expenses increased to $65.8B from $57.7B in the previous year, largely attributed to higher amortization costs for benefits and pensions.
The approximate 16% average determinate workforce (term, casual, student) and other temporary service (professional and special services) provide some workforce flexibility.
*Data as of June 2021.
Source: Public Accounts of Canada
Internal Services
Internal Services form the “back office”. They are groups of related activities and resources that are administered by the department to support the needs of programs and other corporate obligations. Internal services includes areas such as communications, financial management, human resource management, and information technology.
Internal Services vs. Total Government Spending (2019-20)
The cost of internal services is small (3%) compared to total government spending and remains stable. Total government spending includes services to the public and transfers to provincial and territorial governments.
Non-Internal Services Spending ($294.6B)
Internal Services Spending ($9.0B)
Internal Services vs. Total Operating Expenditures (2019-20)
Internal Services represent approximately 13% of total operating expenditures in 2019-20. Total operating expenditures is the amount government spends on its own operations, and so is smaller than total government spending.
Operating Non-Internal Services Expenditures ($64.4B)
Operating Internal Services Expenditures ($9.4B)
Source: TBS, December 2020
People - OCHRO
Federal Public Sector Profile
Quick facts
The size of the federal public sector is unmatched by any other public or private institution in the country
The Federal Public Service (FPS) contains two distinct populations within the Federal Public Sector:
- the Core Public Administration
- Separate Agencies
Treasury Board as the Employer oversees and approves the HR policies; providing guidance to Deputy Heads in managing the CPA population
Figure 10 - Text version
| 2022 | |
|---|---|
| CPA | 254,309 |
| SA | 81,648 |
| RCMP | 21,678 |
| CAF | 87,632 |
| Crown Corps | 137,327 |
| Total in graph includes minister's staff (758) | 582,594 |
*RCMP public service employees are included in Core Public Administration
Geographic Distribution of the Federal Public Service Workforce
- Yukon
433 Employees (0.1% of total) - Northwest Territories
575 Employees (0.2% of total) - Nunavut
353 Employees (0.1% of total) - British Columbia
27,641 Employees (8.5% of total) - Alberta
18,424 Employees (5.6% of total) - Saskatchewan
6,328 Employees (1.9% of total) - Manitoba
13,065 Employees (4.0% of total) - Ontario (excluding NCR)
45,048 Employees (13.8% of total) - National Capital Region
141,747 Employees (43.3% of total) - Québec (excluding NCR)
36,298 Employees (11.1% of total) - New Brunswick
11,720 Employees (3.6% of total) - Nova Scotia
12,181 Employees (3.7% of total) - Prince Edward Island
4,010 Employees (1.2% of total) - Newfoundland and Labrador
7,745 Employees (2.4% of total) - Outside Canada
1,478 Employees (0.5% of total)
*The Federal Public Service includes the Core Public Administration and Separate Agencies.
Excludes those with missing location information (8,911 employees). Source: TBS, March 31, 2022

Figure 11 - Text version
The number of knowledge workers and EX within the core public administration has more than doubled since 2000.
Evolution of Key Core Public Administration Employee Segments between 2000 and 2022, as an Index
| 2000 | 2001 | 2002 | 2003 | 2004 | 2005 | 2006 | 2007 | 2008 | 2009 | 2010 | 2011 | 2012 | 2013 | 2014 | 2015 | 2016 | 2017 | 2018 | 2019 | 2020 | 2021 | 2022 | |
|---|---|---|---|---|---|---|---|---|---|---|---|---|---|---|---|---|---|---|---|---|---|---|---|
| EX | 100 | 107 | 118 | 128 | 131 | 133 | 137 | 142 | 150 | 157 | 165 | 169 | 168 | 157 | 151 | 150 | 152 | 154 | 160 | 170 | 179 | 194 | 208 |
| Non EX | 100 | 106 | 112 | 115 | 116 | 121 | 124 | 126 | 132 | 137 | 142 | 142 | 139 | 131 | 128 | 128 | 129 | 131 | 136 | 144 | 151 | 161 | 166 |
| knowledge workers | 100 | 110 | 123 | 133 | 138 | 141 | 145 | 150 | 156 | 164 | 170 | 176 | 174 | 167 | 164 | 165 | 167 | 171 | 181 | 196 | 210 | 228 | 241 |
Notes: The information provided is for the Core Public Administration (CPA) a subset of the Federal Public Service. It includes all employment tenures, active employees only (employees on leave without pay are excluded), and it is based on effective employment classification (acting appointments are included).
Knowledge workers include: Actuarial Science (AC), Auditing (AU), Commerce Officers (CO), Information Technology (IT), Economics and Social Science Services (EC), Financial Management (FI), Law (LP, LA, LC), Mathematics (MA) and Personnel Administration (PE).
Source: TBS, March 2022 (Pay System)
Employees
Workforce Overview
A snapshot of the Core Public Administration Bargaining Agents
| Agents | Represented Members |
|---|---|
| Public Service Alliance of Canada | 128K |
| Professional Institute of the Public Service of Canada | 44K |
| Canadian Association of Professional Employees | 22.5K |
| Union of Canadian Correctional Officers | 6.3K |
| Association of Canadian Financial Officers | 5.6K |
| Other Bargaining Agents (FGDTLC-W, FGDTLC-E, CUPE, CFPA, UNIFOR, CMCFA, FGDCA) |
2.5K |
| Association of Justice Counsel | 2.8K |
| Professional Association of Foreign Service Officers | 1.8K |
| Canadian Merchant Service Guild | 1.2K |
| International Brotherhood of Electrical Workers | 1K |
- 85% of the 254,309 active employees in the Core Public Administration (CPA) are represented by a union
- 216K unionized members represented by 16 Bargaining Agents
- 60% of unionized members represented by the Public Service Alliance of Canada
- 20% of unionized members represented by the Professional Institute of the Public Service of Canada
- 20% of unionized members represented by the other Bargaining Agents
- 28 Collective Agreements
Source: TBS, data as of March 31, 2022

Figure 12 - Text version
About 39% of employees in the CPA work in Administrative Services (AS), Program Administration (PM), or Clerical and Regulatory (CR).
Share of Key Occupations in the CPA Population, March 2018 to March 2022
| Occupational Group | 2018 | 2019 | 2020 | 2021 | 2022 |
|---|---|---|---|---|---|
| Administrative Services (AS) | 30,716 | 33,940 | 36,943 | 39,339 | 41,864 |
| Programme Administration (PM) | 24,591 | 25,592 | 28,428 | 33,939 | 37,042 |
| Clerical and Regulatory (CR) | 22,041 | 22,441 | 21,227 | 20,876 | 19,653 |
| Economics and Social Services (EC) | 15,496 | 17,290 | 18,876 | 21,081 | 23,270 |
| Information Technology (IT) | 14,209 | 15,489 | 16,686 | 17,812 | 18,442 |
| Executive (EX) | 5,296 | 5,626 | 5,922 | 6,421 | 6,870 |
| Other | 95,963 | 99,937 | 103,094 | 106,271 | 107,168 |
| CPA total | 208,312 | 220,315 | 231,176 | 245,739 | 254,309 |
Notes:
- The information provided is for the CPA. It includes all employment tenures, active employees only (i.e., employees on leave without pay are excluded), and it is based on effective employment classification (i.e., acting appointments included).
- Please note that all unknown and invalid occupational groups have been included with Other.
- ES and SI population are included with the EC population. GX population is included with the EX population.
- PM includes both PM and PMMCO.
Population by Tenure (March 2018 to March 2022)
| Tenure | 2018 | 2019 | 2020 | 2021 | 2022 | |||||
|---|---|---|---|---|---|---|---|---|---|---|
| # | % | # | % | # | % | # | % | # | % | |
| Indeterminate | 228,720 | 83.6% | 239,645 | 83.2% | 249,973 | 83.2% | 262,667 | 82.2% | 271,476 | 80.8% |
| Term | 28,969 | 10.6% | 31,145 | 10.8% | 33,010 | 11.0% | 39,505 | 12.4% | 45,877 | 13.7% |
| Casual | 8,397 | 3.1% | 8,984 | 3.1% | 8,573 | 2.9% | 9,336 | 2.9% | 9,648 | 2.9% |
| Student | 7,426 | 2.7% | 8,156 | 2.8% | 8,852 | 2.9% | 8,064 | 2.5% | 8,926 | 2.7% |
| Unknown | 59 | 0.0% | 53 | 0.0% | 42 | 0.0% | 29 | 0.0% | 30 | 0.0% |
| Total | 273,571 | 100% | 287,983 | 100% | 300,450 | 100% | 319,601 | 100% | 335,957 | 100% |
- The population of the Federal Public Service has been increasing since 2018 as a result of an upswing in hiring. It increased 23% from 273,571 employees in March 2018 to 335,957 employees in March 2022.
- From March 2018 to March 2022:
- Indeterminate employees increased by 19%;
- Term employees increased by 58%;
- Casual employees increased by 15%; and,
- Students increased by 20%.
- As of March 2022, over 80% of the Federal Public Service are indeterminate employees
Note: The information provided is for the Federal Public Service (i.e., Core Public Administration and Separate Agencies). It includes all employment tenures, active employees only (i.e., employees on leave without pay are excluded), and it is based on effective employment classification (i.e., acting appointments included).
Source: TBS (Pay System)
Federal Public Service (FPS) Employees by Age
Select Years, 2002, 2012, and 2022
Over the past twenty years, while the age range of most employees has remained between 35 to 54 years old, the percentage of employees under 35 has increased.
| Under 25 | 25-34 | 35-44 | 45-54 | 55-64 | 65+ | |
|---|---|---|---|---|---|---|
| 2022 | 5.5% | 21.5% | 27.2% | 26.7% | 16.5% | 2.6% |
| 2012 | 3.5% | 19.6% | 26.1% | 32.7% | 16.5% | 1.6% |
| 2002 | 4.6% | 17.7% | 31.1% | 35.9% | 10.0% | 0.7% |
Federal Public Service Pension Plan Members by Pensionable Years
From 2001 to 2021, there was an increase in the number of public servants with relatively fewer years of pensionable service.
| 2001 | 2011 | 2021 | |
|---|---|---|---|
| 0-4 | 47,869 | 97,666 | 109,208 |
| 5-9 | 49,615 | 66,745 | 44,487 |
| 10-14 | 37,402 | 49,894 | 69,399 |
| 15-19 | 41,777 | 26,101 | 53,357 |
| 20-24 | 39,102 | 31,598 | 30,206 |
| 25-29 | 18,851 | 24,723 | 19,414 |
| 30-34 | 6,806 | 15,607 | 12,477 |
| 35 | 648 | 3,872 | 5,229 |
| Total | 242,070 | 316,206 | 343,777 |
Notes: The information provided for the active members of the public service pension plan: Federal Public Service (i.e., Core Public Administration and Separate Agencies) and Crown Corporations.
Sources:
- TBS, Report on the Public Service Pension Plan for the Fiscal Year Ended March 31, 2001
- TBS, Report on the Public Service Pension Plan for the Fiscal Year Ended March 31, 2011
- TBS, Report on the Public Service Pension Plan for the Fiscal Year Ended March 31, 2021
- OCA, Actuarial Report on the Pension Plan of the Public Service of Canada as of March 31, 1999
- OCA, Actuarial Report on the Pension Plan of the Public Service of Canada as of March 31, 2011
- OCA, Actuarial Report on the Pension Plan of the Public Service of Canada as of March 31, 2020
CPA Recruitment by Fiscal Year
Recruitment responds directly and quickly to financial stimulus and restraint. The number of new Indeterminate employees decreased during the pandemic, after reaching a peak in the two previous years.
Core Public Administration Recruitment by Fiscal Year: New Indeterminate Hires
| Fiscal Year | 1991-92 | 1992-93 | 1993-94 | 1994-95 | 1995-96 | 1996-97 | 1997-98 | 1998-99 | 1999-00 | 2000-01 | 2001-02 | 2002-03 | 2003-04 | 2004-05 | 2005-06 | 2006-07 | 2007-08 | 2008-09 | 2009-10 | 2010-11 | 2011-12 | 2012-13 | 2013-14 | 2014-15 | 2015-16 | 2016-17 | 2017-18 | 2018-19 | 2019-20 | 2020-21 | 2021-22 |
|---|---|---|---|---|---|---|---|---|---|---|---|---|---|---|---|---|---|---|---|---|---|---|---|---|---|---|---|---|---|---|---|
| New Indeterminate Hires | 11,239 | 11,202 | 6,544 | 4,595 | 3,110 | 2,962 | 6,279 | 8,036 | 8,071 | 9,986 | 12,365 | 14,130 | 14,084 | 9,395 | 11,092 | 13,342 | 17,258 | 19,968 | 16,304 | 11,677 | 8,642 | 2,865 | 4,315 | 6,093 | 7,698 | 11,085 | 14,749 | 19,245 | 19,333 | 16,528 | 21,925 |
Source: PSC Appointment File. Figures include term to indeterminate appointments.
Mobility in the Core Public Administration
The Core Public Administration saw a peak intake of new employees in 2018-19 and 2019-20.
| Mobility in the CPA | 2017-18 | 2018-19 | 2019-20 | 2020-21 | 2021-22 |
|---|---|---|---|---|---|
| New Indeterminate Employees | 14,749 | 19,245 | 19,333 | 16,528 | 21,925 |
| Retirements and Departures | 8,960 | 8,351 | 9,060 | 7,923 | 9,968 |
| Promotions | 18,298 | 22,773 | 24,405 | 22,617 | 26,527 |
| Lateral and Downward Transfers | 16,834 | 18,165 | 19,310 | 18,353 | 19,506 |
Notes:
- The information provided is for the Core Public Administration. It includes indeterminate employees only.
- From FY 2016-17 onward, departure figures will change over time as departure records are adjusted retroactively.
Source: TBS, PSC
Executives
Ratio of executives to total population
The percentage of executives in the Federal Public Service has increased since 2002 to about 2.5%.
Percentage of Federal Public Service Employees in the Executive Group, 2002-2022
| 2002 | 2003 | 2004 | 2005 | 2006 | 2007 | 2008 | 2009 | 2010 | 2011 | 2012 | 2013 | 2014 | 2015 | 2016 | 2017 | 2018 | 2019 | 2020 | 2021 | 2022 | |
|---|---|---|---|---|---|---|---|---|---|---|---|---|---|---|---|---|---|---|---|---|---|
| CPA | 2.3% | 2.4% | 2.4% | 2.4% | 2.4% | 2.4% | 2.5% | 2.5% | 2.5% | 2.6% | 2.6% | 2.6% | 2.6% | 2.5% | 2.6% | 2.6% | 2.5% | 2.6% | 2.6% | 2.6% | 2.7% |
| FPS | 2.1% | 2.2% | 2.2% | 2.2% | 2.3% | 2.3% | 2.3% | 2.4% | 2.4% | 2.5% | 2.5% | 2.5% | 2.5% | 2.5% | 2.5% | 2.5% | 2.4% | 2.5% | 2.5% | 2.5% | 2.5% |
| Separate Agencies | 1.5% | 1.6% | 1.7% | 1.8% | 1.8% | 1.9% | 2.0% | 2.0% | 2.0% | 2.1% | 2.1% | 2.2% | 2.2% | 2.2% | 2.2% | 2.2% | 2.1% | 2.1% | 2.1% | 2.1% | 2.0% |
Notes:
- This ratio is calculated by dividing total number of executives by total population for each of the Core Public Administration, Separate Agencies and the Federal Public Service (the Core Public Administration and Separate Agencies).
- All information provided includes all employment tenures, active employees only (i.e., employees on leave without pay are excluded), and it is based on effective employment classification (i.e., acting appointments included).
Source: TBS, March 2022 (Pay System)
Federal Public Service - EX and non-EX Group Trends
Directors, Executive Directors, and Director Generals (classified from EX-01 to EX-03) make up the majority (94.1%) of the EX group within the Government of Canada. The overall number of EX has risen 15% since 2020.
| March | 1990 | 1995 | 2000 | 2005 | 2010 | 2015 | 2020 | 2022 |
|---|---|---|---|---|---|---|---|---|
| EX-01 to EX-03 | 4,574 | 3,830 | 3,872 | 5,128 | 6,352 | 5,958 | 6,906 | 8,002 |
| EX-04 to EX-05 | 358 | 292 | 278 | 355 | 436 | 402 | 470 | 504 |
| Non-Executives | 245,693 | 235,837 | 207,775 | 238,488 | 276,192 | 250,674 | 293,074 | 327,451 |
| FPS Total | 250,625 | 239,959 | 211,925 | 243,971 | 282,980 | 257,034 | 300,450 | 335,957 |
| Index Based on 1990 | 1990 | 1995 | 2000 | 2005 | 2010 | 2015 | 2020 | 2022 |
|---|---|---|---|---|---|---|---|---|
| EX-01 to EX-03 | 100 | 84 | 85 | 112 | 139 | 130 | 151 | 175 |
| EX-04 to EX-05 | 100 | 82 | 78 | 99 | 122 | 112 | 131 | 141 |
| Non-Executives | 100 | 96 | 85 | 97 | 112 | 102 | 119 | 133 |
| FPS Total | 100 | 96 | 85 | 97 | 113 | 103 | 120 | 134 |
Notes: The information provided is for the Federal Public Service (i.e., Core Public Administration and Separate Agencies). It includes all employment tenures, active employees only (i.e., employees on leave without pay are excluded), and it is based on effective employment classification (i.e., acting appointments included).
Source: TBS (Pay System)
Population of Executives in the CPA
The number of executives in the core public administration increased by 24% from 2012 to 2022. The CPA grew by 20% over this same period.
| Year | EX-01 | EX-02 | EX-03 | EX-04 | EX-05 | Total | Non-EX | CPA Total |
|---|---|---|---|---|---|---|---|---|
| 2012 | 3039 | 1271 | 901 | 227 | 100 | 5538 | 206490 | 212028 |
| 2013 | 2794 | 1208 | 880 | 207 | 90 | 5179 | 195337 | 200516 |
| 2014 | 2669 | 1190 | 847 | 200 | 89 | 4995 | 190335 | 195330 |
| 2015 | 2620 | 1209 | 848 | 206 | 75 | 4958 | 190607 | 195565 |
| 2016 | 2632 | 1244 | 868 | 202 | 89 | 5035 | 192319 | 197354 |
| 2017 | 2644 | 1289 | 863 | 208 | 90 | 5094 | 194597 | 199691 |
| 2018 | 2750 | 1307 | 909 | 232 | 98 | 5296 | 203016 | 208312 |
| 2019 | 2900 | 1392 | 996 | 234 | 104 | 5626 | 214689 | 220315 |
| 2020 | 3074 | 1467 | 1028 | 241 | 112 | 5922 | 225254 | 231176 |
| 2021 | 3315 | 1618 | 1112 | 256 | 120 | 6421 | 239318 | 245739 |
| 2022 | 3573 | 1734 | 1181 | 271 | 111 | 6870 | 247439 | 254309 |
Notes: The information provided is for the Core Public Administration (CPA) a subset of the Federal Public Service. It includes all employment tenures, active employees only (i.e., employees on leave without pay are excluded), and it is based on effective employment classification (i.e., acting appointments included).
Source: TBS (Pay System)
Average Age by Executive Level March 2015 to March 2022
| Executives | 2015 | 2016 | 2017 | 2018 | 2019 | 2020 | 2021 | 2022 |
|---|---|---|---|---|---|---|---|---|
| EX-01 to EX-03 | 50.1 | 50 | 50 | 50 | 49.8 | 49.8 | 49.8 | 49.8 |
| EX-04 to EX-05 | 53.7 | 54.2 | 53.8 | 53.4 | 53.5 | 53.4 | 53.5 | 53.5 |
| Executives | 50.3 | 50.3 | 50.2 | 50.2 | 50 | 50 | 50.1 | 50.1 |
| Federal Public Service | 45 | 45 | 44.9 | 44.6 | 44.2 | 43.9 | 43.9 | 43.9 |
Notes: The information provided is for the Federal Public Service (i.e., Core Public Administration (CPA) and Separate Agencies). It includes all employment tenures, active employees only (i.e., employees on leave without pay are excluded), and it is based on effective employment classification (i.e., acting appointments included). Excludes those with missing birthdates.
Source: TBS (Pay System)
Deputy Ministers and Associate Deputy Ministers
Average Age and Population, March 2017 to March 2022
| 2017 | 2018 | 2019 | 2020 | 2021 | 2022 | |||||||
|---|---|---|---|---|---|---|---|---|---|---|---|---|
| Average Age | Count | Average Age | Count | Average Age | Count | Average Age | Count | Average Age | Count | Average Age | Count | |
| DMs | 56.7 | 36 | 55.7 | 38 | 56 | 37 | 56.8 | 36 | 57.5 | 37 | 57.4 | 36 |
| ADMs | 54.4 | 41 | 54.3 | 47 | 54.4 | 45 | 54.8 | 42 | 52.8 | 39 | 53.8 | 41 |
| FPS | 44.9 | 262696 | 44.6 | 273571 | 44.2 | 287978 | 43.9 | 300450 | 43.9 | 319601 | 43.9 | 319598 |
Note: The information provided is for the Federal Public Service (i.e., Core Public Administration and Separate Agencies). It included all employment tenures, active employees only (i.e., employees on leave without pay are excluded), and it is based on effective employment classification (i.e., acting appointments included)
Source: PCO and TBS
Diversity & Inclusion
Official Language Status of CPA Positions
| 2000 | 2005 | 2010 | 2015 | 2020 | |
|---|---|---|---|---|---|
| Bilingual | 36% | 40% | 41% | 43% | 42% |
| Unilingual | 64% | 60% | 59% | 57% | 58% |
| 2000 | 2005 | 2010 | 2015 | 2021 | |
|---|---|---|---|---|---|
| Meet | 41832 | 58279 | 77331 | 75172 | 90893 |
| Do Not Meet - Exempt | 5030 | 3889 | 3625 | 2909 | 2297 |
| Do Not Meet - Must Meet During Exemption Period | 968 | 2050 | 831 | 141 | 50 |
- The percentage of bilingual positions has increased from 35.7% in 2000 to 42.4% in 2020.
- In 2020, the National Capital Region (64.2%), Quebec (excluding NCR) (67.5%) and New Brunswick (50.7%) had the highest proportion of bilingual positions.
- Between 2000 and 2015, the percentage of employees meeting the language requirements of their positions steadily increased. It has remained stable over the past six years.
Note: Includes Core Public Administration (CPA) employees only, indeterminate and terms 3 months or more.
- OL data in the charts are up to March 2020.
- OL data for the FY 2020-21 will be published in the Official Languages Annual Report in 2021.
- Yukon
Bilingual: 36
Unilingual: 36 - Northwest Territories
Bilingual: 35
Unilingual: 65 - Nunavut
Bilingual: 23
Unilingual: 53 - British Colombia
Bilingual: 262
Unilingual: 1,031 - Alberta
Bilingual: 222
Unilingual: 792 - Saskatchewan
Bilingual: 115
Unilingual: 729 - Manitoba
Bilingual: 159
Unilingual: 502 - Ontario
Bilingual: 623
Unilingual: 1,502 - National Capital Region
Bilingual: 407
Unilingual: 0 - Québec
Bilingual: 691
Unilingual:1,338 - New Brunswick
Bilingual: 329
Unilingual: 165 - Nova Scotia
Bilingual: 216
Unilingual: 384 - Prince Edward Island
Bilingual: 46
Unilingual: 75 - Newfoundland and Labrador
Bilingual: 74
Unilingual: 551
* Includes air, train, and ferry routes.
** Consulates and embassies are automatically bilingual. Other offices must measure demand (for example, offices of Public Services and Procurement Canada, International Development Research Centre).
Sources: Data from the Regulations Management System and from Canada Post as of March 31, 2020.
Age Distribution of New Indeterminate Hires
2021-22, CPA Only
| Age | Count |
|---|---|
| 17 | 12 |
| 18 | 32 |
| 19 | 17 |
| 20 | 66 |
| 21 | 199 |
| 22 | 544 |
| 23 | 771 |
| 24 | 974 |
| 25 | 1059 |
| 26 | 1018 |
| 27 | 974 |
| 28 | 987 |
| 29 | 888 |
| 30 | 881 |
| 31 | 810 |
| 32 | 784 |
| 33 | 676 |
| 34 | 732 |
| 35 | 666 |
| 36 | 696 |
| 37 | 612 |
| 38 | 619 |
| 39 | 607 |
| 40 | 577 |
| 41 | 539 |
| 42 | 544 |
| 43 | 493 |
| 44 | 520 |
| 45 | 418 |
| 46 | 404 |
| 47 | 390 |
| 48 | 367 |
| 49 | 364 |
| 50 | 318 |
| 51 | 285 |
| 52 | 277 |
| 53 | 263 |
| 54 | 228 |
| 55 | 213 |
| 56 | 195 |
| 57 | 181 |
| 58 | 183 |
| 59 | 136 |
| 60 | 89 |
| 61 | 96 |
| 62 | 63 |
| 63 | 48 |
| 64 | 34 |
| 65 | 22 |
| 66 | 13 |
| 67 | 20 |
| 68 | 7 |
| 69+ | 12 |
| Total | 21923 |
Note: "median" age (34) of New Indeterminate Hires was used instead of the average age (37) to reduce the skewing caused by outliers at both ends of the spectrum.
Source: PSC Appointment File
Indeterminate Hires in the CPA by Employment Equity (EE) Profile, 2020-21
- In 2020-21, there were 24,229 new indeterminate hires.
- A higher proportion of members of visible minorities were hired at a younger age
- However, those living with disabilities were hired at a later age.
| Employment Equity Group | Overall CPA Representation | Workforce Availability |
|---|---|---|
| Women | 55.6% | 52.7% |
| Indigenous peoples | 5.2% | 4.0% |
| Persons with disabilities | 5.6% | 9.0% |
| Members of visible minorities | 18.9% | 15.3% |
Under 35 Years of Age
- 60.7% Women
- 3.6% Indigenous Peoples
- 4.0% Persons with Disabilities
- 23.1% Members of Visible Minorities
35 and Over
- 59.6% Women
- 4.1% Indigenous Peoples
- 4.8% Persons with Disabilities
- 19.1% Members of Visible Minorities
New Indeterminate Hires Representation
- 60.2% Women
- 3.8% Indigenous Peoples
- 4.3% Persons with Disabilities
- 21.2% Members of Visible Minorities
Workforce Availability Estimates
(2016 Census and 2017 Canadian Survey on Disability*)
- 52.7% Women
- 4.0% Indigenous Peoples
- 9.0% Persons with Disabilities*
- 15.3% Members of Visible Minorities
* Statistics Canada 2017 Canadian Survey on Disability expanded the definition of persons with disability to include mental illness and chronic pain.
Source: TBS-OCHRO (Employment Equity Database) and PSC (Appointment File)
Employment Equity (EE) in the CPA
Designated Group Representation in the Public Service by Percentage (2010 v. 2021)
| 2010 | 2021 | Diff | |
|---|---|---|---|
| Women | 54.8% | 55.6% | 0.8% |
| Indigenous Peoples | 4.6% | 5.2% | 0.6% |
| Persons with disabilities | 5.7% | 5.6% | -0.1% |
| Members of visible minorities | 10.7% | 18.9% | 8.2% |
| 2010 | 2021 | |
|---|---|---|
| Women | 52.3% | 52.7% |
| Indigenous Peoples | 3.0% | 4.0% |
| Persons with disabilities | 4.0% | 9.0% |
| Members of visible minorities | 12.4% | 15.3% |
Overall, employment equity (EE) representation of women, Indigenous peoples and members of visible minorities across the public service has been improving, but there is much more work to be done.
*The 2017 Canadian Survey on Disabilities expanded the definition of Persons with Disabilities (PwD) to include disabilities relating to pain and mental health. Work Force Availability in 2020 for PwD when adjusted to the former definition of PwD is close to 2010 representation.
Source: TBS, TBS-OCHRO as of March 31, 2010, and March 31, 2021
Significant representation gaps persist at executive levels
Women
| Year | EX-01 to EX-03 Representation | ADM Representation | Workforce Availability |
|---|---|---|---|
| 2000 | 28.8% | 23.4% | |
| 2001 | 30.3% | 25.9% | |
| 2002 | 32.1% | 30.0% | |
| 2003 | 34.0% | 31.5% | |
| 2004 | 35.1% | 33.1% | |
| 2005 | 37.4% | 33.9% | 42.1% |
| 2006 | 38.9% | 36.8% | 42.1% |
| 2007 | 40.5% | 38.5% | 42.1% |
| 2008 | 41.9% | 38.8% | 42.1% |
| 2009 | 43.2% | 40.2% | 44.7% |
| 2010 | 44.3% | 40.8% | 44.7% |
| 2011 | 45.2% | 39.9% | 44.7% |
| 2012 | 45.8% | 39.4% | 44.7% |
| 2013 | 45.9% | 37.4% | 44.7% |
| 2014 | 45.9% | 38.7% | 47.8% |
| 2015 | 46.0% | 40.8% | 47.8% |
| 2016 | 47.0% | 39.8% | 47.8% |
| 2017 | 47.7% | 41.9% | 47.8% |
| 2018 | 48.8% | 43.3% | 47.8% |
| 2019 | 50.7% | 43.3% | 48.0% |
| 2020 | 51.5% | 44.8% | 48.0% |
| 2021 | 52.6% | 46.8% | 48.0% |
| 2000 | 2005 | 2010 | 2015 | 2021 | |
|---|---|---|---|---|---|
| EX WFA | 42.10% | 44.70% | 47.80% | 48.00% | |
| EX-01 to EX-03 | 28.80% | 37.40% | 44.30% | 46.00% | 52.60% |
| ADM | 23.40% | 33.90% | 40.80% | 40.80% | 46.80% |
Members of Visible minorities
| Year | EX-01 to EX-03 Representation | ADM Representation | Workforce Availability |
|---|---|---|---|
| 2000 | 3.20% | 2.20% | |
| 2001 | 3.40% | 2.40% | |
| 2002 | 3.90% | 2.20% | |
| 2003 | 4.30% | 2.20% | |
| 2004 | 4.90% | 3.00% | |
| 2005 | 5.30% | 3.30% | 6.40% |
| 2006 | 5.60% | 3.60% | 6.40% |
| 2007 | 6.40% | 4.00% | 6.40% |
| 2008 | 6.70% | 5.80% | 6.40% |
| 2009 | 7.00% | 5.60% | 7.60% |
| 2010 | 7.40% | 5.00% | 7.60% |
| 2011 | 8.00% | 5.20% | 7.60% |
| 2012 | 8.40% | 5.20% | 7.60% |
| 2013 | 8.40% | 5.70% | 7.60% |
| 2014 | 8.80% | 6.60% | 9.50% |
| 2015 | 9.10% | 7.10% | 9.50% |
| 2016 | 9.70% | 8.10% | 9.50% |
| 2017 | 10.50% | 7.90% | 9.50% |
| 2018 | 10.40% | 8.90% | 9.50% |
| 2019 | 11.30% | 8.60% | 10.60% |
| 2020 | 11.60% | 9.30% | 10.60% |
| 2021 | 12.50% | 9.80% | 10.60% |
| 2000 | 2005 | 2010 | 2015 | 2021 | |
|---|---|---|---|---|---|
| EX WFA | 6.40% | 7.60% | 9.50% | 10.60% | |
| EX-01 to EX- 03 | 3.20% | 5.30% | 7.40% | 9.10% | 12.50% |
| ADM | 2.20% | 3.30% | 5.00% | 7.10% | 9.80% |
Source: Pay System and Employment Equity Data Bank (EEDB) as of March 31st of each year. The Law Management (LC) occupational group is included in representation and Work Force Availability (WFA) as of March 31, 2021.
The 2021 WFA for persons with disabilities is based on the expanded definition of disability used in the 2017 Canadian Survey on Disability, which includes episodic and non-visible disabilities. The 2021 representation of persons with disabilities is based on a previous definition.
Indigenous Peoples
| Year | EX-01 to EX-03 Representation | ADM Representation | Workforce Availability |
|---|---|---|---|
| 2000 | 2.00% | 0.90% | |
| 2001 | 2.10% | 0.40% | |
| 2002 | 2.60% | 0.40% | |
| 2003 | 2.90% | 0.40% | |
| 2004 | 3.00% | 0.40% | |
| 2005 | 3.10% | 0.70% | 3.70% |
| 2006 | 3.50% | 1.40% | 3.70% |
| 2007 | 3.40% | 2.60% | 3.70% |
| 2008 | 3.40% | 2.40% | 3.70% |
| 2009 | 3.70% | 2.70% | 4.30% |
| 2010 | 3.80% | 2.50% | 4.30% |
| 2011 | 3.90% | 2.30% | 4.30% |
| 2012 | 3.90% | 1.90% | 4.30% |
| 2013 | 3.90% | 1.70% | 4.30% |
| 2014 | 3.90% | 1.80% | 5.20% |
| 2015 | 3.60% | 1.80% | 5.20% |
| 2016 | 3.90% | 1.40% | 5.20% |
| 2017 | 4.00% | 2.10% | 5.20% |
| 2018 | 3.90% | 1.80% | 5.20% |
| 2019 | 4.20% | 2.60% | 5.10% |
| 2020 | 4.20% | 3.00% | 5.10% |
| 2021 | 4.50% | 3.60% | 5.10% |
| 2000 | 2005 | 2010 | 2015 | 2021 | |
|---|---|---|---|---|---|
| EX WFA | 3.70% | 4.30% | 5.20% | 5.10% | |
| EX-01 to EX-03 | 2.00% | 3.10% | 3.80% | 3.60% | 4.50% |
| ADM | 0.90% | 0.70% | 2.50% | 1.80% | 3.60% |
Persons with disabilities
| Year | EX-01 to EX-03 Representation | ADM Representation | Workforce Availability |
|---|---|---|---|
| 2000 | 3.00% | 1.70% | |
| 2001 | 3.60% | 2.40% | |
| 2002 | 4.20% | 2.60% | |
| 2003 | 4.70% | 3.30% | |
| 2004 | 5.00% | 3.40% | |
| 2005 | 5.60% | 3.30% | 2.60% |
| 2006 | 5.60% | 3.90% | 2.60% |
| 2007 | 5.90% | 4.40% | 2.60% |
| 2008 | 5.80% | 4.10% | 2.60% |
| 2009 | 6.30% | 3.30% | 4.00% |
| 2010 | 5.90% | 2.50% | 4.00% |
| 2011 | 5.60% | 2.30% | 4.00% |
| 2012 | 5.60% | 2.90% | 4.00% |
| 2013 | 5.40% | 3.50% | 4.00% |
| 2014 | 5.50% | 2.10% | 2.30% |
| 2015 | 5.40% | 2.20% | 2.30% |
| 2016 | 5.10% | 3.20% | 2.30% |
| 2017 | 5.10% | 3.80% | 2.30% |
| 2018 | 4.80% | 4.30% | 2.30% |
| 2019 | 4.60% | 4.60% | 5.30% |
| 2020 | 4.70% | 3.80% | 5.30% |
| 2021 | 5.60% | 5.40% | 5.30% |
| 2000 | 2005 | 2010 | 2015 | 2021 | |
|---|---|---|---|---|---|
| EX WFA | 2.60% | 4.00% | 2.30% | 5.30% | |
| EX-01 to EX- 03 | 3.00% | 5.60% | 5.90% | 5.40% | 5.60% |
| ADM | 1.70% | 3.30% | 2.50% | 2.20% | 5.40% |
Source: Pay System and Employment Equity Data Bank (EEDB) as of March 31st of each year. LCs are included in representation and Work Force Availability (WFA) as of March 31, 2021.
The 2021 WFA for persons with disabilities is based on the expanded definition of disability used in the 2017 Canadian Survey on Disability, which includes episodic and non-visible disabilities. The 2021 representation of persons with disabilities is based on a previous definition.
Representation of Indigenous peoples by designated subgroup
Salary Distribution
| Overall population | Indigenous Peoples | Inuit | Métis | North American Indian / First Nation | Other | |
|---|---|---|---|---|---|---|
| Less than $50,000 | 2.40% | 2.50% | ||||
| $50,000 to $74,999 | 41.30% | 43.80% | 55.20% | 42.30% | 44.20% | 44.50% |
| $75,000 to $99,000 | 33.00% | 36.70% | 31.70% | 37.90% | 36.10% | 35.60% |
| More than $100,000 | 23.30% | 17.00% |
Distribution of Indigenous employees between 20 to 29 years and 50 to 64 years of age.
| Overall population | Indigenous peoples | Inuit | Métis | North American Indian / First Nation | Other | |
|---|---|---|---|---|---|---|
| 20 to 29 years | 12.20% | 9.90% | 19.90% | 8.00% | 8.90% | 16.60% |
| 50 to 64 years | 31.00% | 34.50% | 27.20% | 35.10% | 37.40% | 25.90% |
| Overall | representation |
|---|---|
| Inuit | 3.0% |
| Métis | 42.0% |
| North American / First Nation | 41.6% |
| Other | 13.4% |
| Subgroup | Overall representation | Executive representation | ||
|---|---|---|---|---|
| # | % | # | % | |
| Inuit | 357 | 0.2 | * | * |
| Métis | 5,026 | 2.2 | 135 | 2 |
| North American Indian / | 4,984 | 2.2 | 110 | 1.6 |
| First Nation | ||||
| Other | 1,610 | 0.7 | * | * |
| Total | 11,977 | 5.2 | 297 | 4.4 |
Information for small numbers has been suppressed and thus excluded from the graph.
| Percent | |
|---|---|
| Métis | 45.50% |
| North American Indian / First Nation | 37.00% |
Representation of persons with disabilities by designated subgroup
| Overall population | Persons with disabilities | Co-ordination or dexterity | Mobility | Speech impairment | Blind or visual impairment | Deaf or hard of hearing | Other disability | |
|---|---|---|---|---|---|---|---|---|
| Less than $50,000 | 2.40% | 3.00% | 3.10% | |||||
| $50,000 to $74,999 | 41.30% | 44.20% | 43.60% | 48.20% | 39.50% | 38.40% | 40.80% | 45.50% |
| $75,000 to $99,999 | 33.00% | 30.90% | 30.60% | 30.00% | 30.80% | 31.10% | 31.10% | 30.80% |
| More than $100,000 | 23.30% | 21.90% | 20.60% |
| Overall population | Persons with disabilities | Co-ordination or dexterity | Mobility | Speech impairment | Blind or visual impairment | Deaf or hard of hearing | Other disability | |
|---|---|---|---|---|---|---|---|---|
| 20 to 29 years | 12.20% | 8.30% | 3.10% | 3.50% | 6.00% | 3.80% | 10.90% | |
| 50 to 64 years | 31.00% | 41.90% | 53.50% | 52.60% | 46.40% | 47.20% | 53.30% | 36.20% |
| Sub group | Overall | EX |
|---|---|---|
| Other | 64.70% | 54.90% |
| Deaf | 13.90% | 18.80% |
| Blind | 7.40% | 12.20% |
| Speech | 2.10% | 2.40% |
| Mobility | 17.00% | 11.40% |
| Coordination | 8.50% | 8.80% |
| Subgroup | Overall | Executives | ||
|---|---|---|---|---|
| # | % | # | % | |
| Coordination or Dexterity | 1,094 | 0.5 | 33 | 0.5 |
| Mobility | 2,186 | 1 | 43 | 0.6 |
| Language disorders | 276 | 0.1 | 9 | 0.1 |
| Blind or Visually Impaired | 951 | 0.4 | 46 | 0.7 |
| Deaf or Hearing Impaired | 1,786 | 0.8 | 71 | 1.1 |
| Other Disabilities | 8,339 | 3.7 | 207 | 3.1 |
| Total | 12,893 | 5.6 | 377 | 5.6 |
Representation of members of visible minorities by designated subgroup
| Subgroup | Overall | Executives | ||
|---|---|---|---|---|
| # | % | # | % | |
| Black | 8,754 | 3.8 | 128 | 1.9 |
| Non-White Latin American | 1,869 | 0.8 | 25 | 0.4 |
| Person of Mixed Origin | 3,490 | 1.5 | 114 | 1.7 |
| Chinese | 7,241 | 3.2 | 99 | 1.5 |
| Japanese | 271 | 0.1 | 7 | 0.1 |
| Korean | 642 | 0.3 | 12 | 0.2 |
| Filipino | 1,641 | 0.7 | 13 | 0.2 |
| South Asian / East Indian | 7,646 | 3.3 | 186 | 2.8 |
| Non-White West Asian, North African or Arab | 4,839 | 2.1 | 129 | 1.9 |
| Southeast Asian | 1,877 | 0.8 | 31 | 0.5 |
| Other visible minority groups | 4,852 | 2.1 | 86 | 1.3 |
| Total | 43,122 | 18.9 | 830 | 12.4 |
| Subgroup | Overall | Executives |
|---|---|---|
| Other Visible Minority Groups | 11.30% | 10.40% |
| Southeast Asian | 4.40% | 3.70% |
| Non-White West Asian, North African or Arab | 11.20% | 15.50% |
| South Asian / East Indian | 17.70% | 22.40% |
| Filipino | 3.80% | 1.60% |
| Korean | 1.50% | 1.40% |
| Japanese | 0.60% | 0.80% |
| Chinese | 16.80% | 11.90% |
| Person of Mixed Origin | 8.10% | 13.70% |
| Non-White Latin American | 4.30% | 3.00% |
| Black | 20.30% | 15.40% |
Interchange Canada Usage Trends: New
Interchange Canada Participation Trends
- Non-EX incoming participants accounted for 46% and Non-EX outgoing participants accounted for 42% of total assignments initiated in 2021-22
- EX incoming participants accounted for 9% and EX outgoing participants accounted for 3% of total assignments initiated in 2021-22
Active Assignments
- As of July 30th, 2022, there are 449 active Interchange Canada assignments across the core public administration and all other sectors
- Non-EX incoming participants currently account for 62% and Non-EX outgoing participants currently account for 21% of total active assignments
- EX incoming participants currently account for 12% and EX outgoing participants currently account for 5% of total active assignments
Note: Table shows amount of new assignments started in the corresponding fiscal year, based on data entered into the IC Reporting Application by departmental liaison officers. Valid as of July 30th, 2022. Many departments only input assignment data upon assignment completion - most recent numbers may appear lower than they actually are due to delayed reporting. Source: TBS

Figure 13 - Text version
The trend graph for New Assignments by Fiscal Years is broken down by EX and Non-EX categories with an added type of assignment defined by "In" to the CPA or "Out" of the CPA. The data columns range from FY 2018-19 to 2022-23 with a supplementary column for currently active assignments as of the report extraction as of June 1st 2023.
| EX-in | EX-out | Non-Ex in | Non-EX Out | Grand total | |
|---|---|---|---|---|---|
| 2018-19 | 30 | 15 | 124 | 267 | 436 |
| 2019-20 | 30 | 23 | 128 | 221 | 402 |
| 2020-21 | 40 | 38 | 438 | 215 | 731 |
| 2021-22 | 41 | 12 | 191 | 177 | 421 |
| 2022-23 | 41 | 13 | 197 | 157 | 408 |
| Active | 61 | 28 | 221 | 96 | 406 |
Digital - OCIOM
State of Information Technology (IT)
Overview of Expenditures
| Current | Change | |
|---|---|---|
| Annual IT operating expenditure for 2019-20 | $7.5 B |
$722 M* |
On IT Infrastructure |
$3.0 B |
$157 M* |
On IT Applications |
$2.6 B |
$394 M* |
Computer Systems |
22,263** |
2,197 |
- Annual Information Technology operating expenditure for 2019-20 was $7.5B
- The number of Access to Information Requests has steadily increased since 1983, due mainly to a significant increase in requests submitted to Immigration, Refugees and Citizenship Canada since 2012-13. Operational costs related to these requests are also rising
- 42% of Government of Canada services can be completed on-line from end-to-end
- In 2019-20, internal and external clients completed 425 million transactions (including border crossings) with the Government of Canada
*Between 2018-19 and 2019-20
**17,812 total in the core public administration, 4,451 total in the separate agencies (March 2021)
*** GC Application Health Indicator only includes “In Production” (live) applications (business solutions and software)
Source: TBS

Figure 14 - Text version
Comparative bar graph and line graph describing Access to Information and Personal Information requests. The left side of the Y-axis shows the number of requests, and the right side shows the cost of operations in millions. The X-axis shows the fiscal year.
In the 1983 to 1984 fiscal year, there were 1,513 access to information requests, and 17,109 personal information requests. The total cost of operations (real dollar 2020) was 14.81 million dollars.
In the 1984 to 1985 fiscal year, there were 2,229 access to information requests, and 27,547 personal information requests. The total cost of operations (real dollar 2020) was 18.95 million dollars.
In the 1985 to 1986 fiscal year, there were 3,606 access to information requests, and 38,606 personal information requests. The total cost of operations (real dollar 2020) was 19.35 million dollars.
In the 1986 to 1987 fiscal year, there were 5,450 access to information requests, and 42,292 personal information requests. The total cost of operations (real dollar 2020) was 18.15 million dollars.
In the 1987 to 1988 fiscal year, there were 7,301 access to information requests, and 49,626 personal information requests.
The total cost of operations (real dollar 2020) was 15.78 million dollars.
In the 1988 to 1989 fiscal year, there were 8,853 access to information requests, and 59,631 personal information requests. The total cost of operations (real dollar 2020) was 21.59 million dollars.
In the 1989 to 1990 fiscal year, there were 10,234 access to information requests, and 55,505 personal information requests. The total cost of operations (real dollar 2020) was 25.01 million dollars.
In the 1990 to 1991 fiscal year, there were 11,093 access to information requests, and 48,430 personal information requests. The total cost of operations (real dollar 2020) was 23.67 million dollars.
In the 1991 to 1992 fiscal year, there were 10,387 access to information requests, and 49,732 personal information requests. The total cost of operations (real dollar 2020) was 21.33 million dollars.
In the 1992 to 1993 fiscal year, there were 9,729 access to information requests, and 42,713 personal information requests. The total cost of operations (real dollar 2020) was 27.93 million dollars.
In the 1993 to 1994 fiscal year, there were 10,422 access to information requests, and 39,060 personal information requests. The total cost of operations (real dollar 2020) was 24.47 million dollars.
In the 1994 to 1995 fiscal year, there were 12,861 access to information requests, and 42,147 personal information requests. The total cost of operations (real dollar 2020) was 29.60 million dollars.
In the 1995 to 1996 fiscal year, there were 13,124 access to information requests, and 43,137 personal information requests. The total cost of operations (real dollar 2020) was 32.02 million dollars.
In the 1996 to 1997 fiscal year, there were 12,476 access to information requests, and 47,532 personal information requests.
The total cost of operations (real dollar 2020) was 33.16 million dollars.
In the 1997 to 1998 fiscal year, there were 12,206 access to information requests, and 43,648 personal information requests. The total cost of operations (real dollar 2020) was 32.25 million dollars.
In the 1998 to 1999 fiscal year, there were 14,340 access to information requests, and 41,498 personal information requests. The total cost of operations (real dollar 2020) was 35.20 million dollars.
In the 1999 to 2000 fiscal year, there were 19,294 access to information requests, and 41,585 personal information requests. The total cost of operations (real dollar 2020) was 39.37 million dollars.
In the 2000 to 2001 fiscal year, there were 20,789 access to information requests, and 104,133 personal information requests. The total cost of operations (real dollar 2020) was 57.79 million dollars.
In the 2001 to 2002 fiscal year, there were 21,265 access to information requests, and 36,137 personal information requests. The total cost of operations (real dollar 2020) was 52.77 million dollars.
In the 2002 to 2003 fiscal year, there were 22,977 access to information requests, and 37,863 personal information requests. The total cost of operations (real dollar 2020) was 54.62 million dollars.
In the 2003 to 2004 fiscal year, there were 25,234 access to information requests, and 54,377 personal information requests. The total cost of operations (real dollar 2020) was 50.55 million dollars.
In the 2004 to 2005 fiscal year, there were 25,207 access to information requests, and 36,316 personal information requests. The total cost of operations (real dollar 2020) was 51.58 million dollars.
In the 2005 to 2006 fiscal year, there were 27,269 access to information requests, and 36,090 personal information requests. The total cost of operations (real dollar 2020) was 68.38 million dollars.
In the 2006 to 2007 fiscal year, there were 29,182 access to information requests, and 34,559 personal information requests. The total cost of operations (real dollar 2020) was 65.25 million dollars.
In the 2007 to 2008 fiscal year, there were 31,487 access to information requests, and 39,134 personal information requests. The total cost of operations (real dollar 2020) was 77.79 million dollars.
In the 2008 to 2009 fiscal year, there were 34,041 access to information requests, and 36,454 personal information requests. The total cost of operations (real dollar 2020) was 86.36 million dollars.
In the 2009 to 2010 fiscal year, there were 35,154 access to information requests, and 41,621 personal information requests. The total cost of operations (real dollar 2020) was 85.79 million dollars.
In the 2010 to 2011 fiscal year, there were 41,641 access to information requests, and 48,755 personal information requests. The total cost of operations (real dollar 2020) was 94.22 million dollars.
In the 2011 to 2012 fiscal year, there were 43,194 access to information requests, and 50,524 personal information requests. The total cost of operations (real dollar 2020) was 102.32 million dollars.
In the 2012 to 2013 fiscal year, there were 55,145 access to information requests, and 55,355 personal information requests. The total cost of operations (real dollar 2020) was 102.53 million dollars.
In the 2013 to 2014 fiscal year, there were 60,105 access to information requests, and 56,263 personal information requests.
The total cost of operations (real dollar 2020) was 105.96 million dollars.
In the 2014 to 2015 fiscal year, there were 68,193 access to information requests, and 67,399 personal information requests. The total cost of operations (real dollar 2020) was 113.30 million dollars.
In the 2015 to 2016 fiscal year, there were 75,387 access to information requests, and 70,833 personal information requests. The total cost of operations (real dollar 2020) was 113.66 million dollars.
In the 2016 to 2017 fiscal year, there were 91,880 access to information requests, and 70,490 personal information requests. The total cost of operations (real dollar 2020) was 111.43 million dollars.
In the 2017 to 2018 fiscal year, there were 106,255 access to information requests, and 67,967 personal information requests. The total cost of operations (real dollar 2020) was 117.99 million dollars.
In the 2018 to 2019 fiscal year, there were 123,421 access to information requests, and 74,566 personal information requests. The total cost of operations (real dollar 2020) was 123.90 million dollars.
In the 2019 to 2020 fiscal year, there were 156,255 access to information requests, and 78,565 personal information requests. The total cost of operations (real dollar 2020) was 130.03 million dollars.
While the number of Personal Information Requests has fluctuated since 1983, the number of Access to Information Requests has steadily increased due mainly to a significant increase in requests submitted to Immigration, Refugees and Citizenship Canada since 2012-13. The number of requests to other institutions has been largely stable or in decline. Operational costs related to these requests are also rising.
The Access to Information Act and Privacy Act provide a right to request government information and one’s own personal information held by the Government of Canada.
The spike in personal information requests in 2000-01 followed the Privacy Commissioner’s 1999-2000 Annual Report which highlighted a database that contained significant personal information about Canadians.
Source: TBS
Number of Visits to the Open Data Portal
| Years | Annuals Visits |
|---|---|
| 2016 | 564,638 |
| 2017 | 1,297,828 |
| 2018 | 1,002,495 |
| 2019 | 1,810,229 |
| 2020 | 1,942,769 |
| 2021 (YTD 31-May) | 1,044,769 |
Number of Visits to the Open Data Portal – COVID-19 Resources
| Month | Total Downloads |
|---|---|
| Jun-20 | 5,816 |
| Jul-20 | 5,522 |
| Aug-20 | 5,319 |
| Sep-20 | 5,294 |
| Oct-20 | 8,397 |
| Nov-20 | 9,098 |
| Dec-20 | 8,149 |
| Jan-21 | 11,488 |
| Feb-21 | 11,504 |
| Mar-21 | 12,435 |
| Apr-21 | 11,225 |
| May-21 | 12,600 |
COVID-19 Data and Information Released as of May 31, 2021
Total Released: 565
- Open Datasets, 167
- Open Information, 398
Top 3 downloaded COVID-19 datasets
- Public Health Infobase - Data on COVID-19 in Canada
- Canada Emergency Response Benefit Statistics
- Canada Emergency Student Benefit
Note: Does not include IRCC COVID-19 tagged datasets
Digital Access and Service Channel Preferences
Canadians access services via in-person, online and by phone at a relatively equal rate.
Overall, internal and external clients completed 425 million* transactions with the Government of Canada across various channels. Three of these channels were accessed as follows:
online
by telephone
in-person
20% of GC Services offer services online, by telephone and in-person. Usage rates are different when clients can choose from these three available channels
online
by telephone
in-person
Government of Canada External Services
Overall Scope
- 74 Departments*
- 474 Programs
- 1,117 Services
- 360 Priority services
Transactions Processed
- 157M Online Applications
- 91M Telephone Calls and Applications
- 33M Mail Applications
- 17M In-person Applications**
Service Performance
- 42% of GC services can be completed on-line from end-to-end
- Overall, 54% of all steps required to receive a service were available online
- 79% of GC services met their service standard targets in 2019-20
*Out of 84 organizations subject to the Policy on Service and Digital
** In-person applications does not include border crossings of 94 million (also known as traveller processing).
Note: Remaining transactions processed are via other channels such as email, fax or radio.
Clients include: persons (citizens and non-citizens), foreign entities, businesses, non-profits, provinces, territories and communities.
Service Improvement Opportunities
Online Enablement of Top 15 External Services
| Department | Online Enablement |
|---|---|
| ESDC-Employment Insurance | Less than 100% |
| CRA-Individual Incomes Tax Returns | 100% |
| CBSA-Commercial Processing | Less than 100% |
| ESDC-Old Age Security | Less than 100% |
| ESDC-Canada Pension Plan | Less than 100% |
| CRA-GST/HST Returns | 100% |
| ISED-Corporate Name Search | 100% |
| IRCC-Electronic Travel Authorization | 100% |
| CRA-Authorize a Representative | 100% |
| CRA-T2 Corporation Income Tax Returns | 100% |
| IRCC-Issuance of a Regular Passport | Less than 100% |
| IRCC-Temporary Resident Visa | Less than 100% |
| ESDC-Social Insurance Number | 0 |
| ESDC - Job Bank - find a job | 100% |
| IRCC-Interim Federal Health | 100% |
Top 15 External Services by Transaction Volume
| Department | In person | Other | Phone | Online | |
|---|---|---|---|---|---|
| ESDC-Employment Insurance | 0 | 0 | 0 | over 35 million | less than 5 million |
| CRA-Individual Incomes Tax Returns | 0 | less than 5 million | 0 | 0 | over 30 million |
| CBSA-Commercial Processing | less than 5 million | 0 | 0 | 0 | over 15 million |
| ESDC-Old Age Security | 0 | less than 5 million | less than 5 million | less than 10 million | 0 |
| ESDC-Canada Pension Plan | 0 | less than 5 million | less than 5 million | less than 10 million | 0 |
| CRA-GST/HST Returns | 0 | less than 5 million | 0 | 0 | less than 5 million |
| ISED-Corporate Name Search | 0 | 0 | 0 | 0 | less than 10 million |
| IRCC-Electronic Travel Authorization | 0 | 0 | 0 | 0 | less than 5 million |
| CRA-Authorize a Representative | 0 | less than 5 million | 0 | 0 | less than 5 million |
| CRA-T2 Corporation Income Tax Returns | 0 | 0 | 0 | 0 | less than 5 million |
| IRCC-Issuance of a Regular Passport | less than 5 million | less than 5 million | 0 | 0 | 0 |
| IRCC-Temporary Resident Visa | 0 | less than 5 million | 0 | less than 5 million | less than 5 million |
| ESDC-Social Insurance Number | less than 5 million | 0 | 0 | 0 | less than 5 million |
| ESDC - Job Bank - find a job | 0 | 0 | 0 | 0 | less than 5 million |
| IRCC-Interim Federal Health | 0 | less than 5 million | 0 | 0 | less than 5 million |
Assets and Procurement – OCG
Treasury Board sets the policy direction for the management of assets and acquired services and makes decisions on departmental proposals, such as investment plans and individual projects

Figure 15 - Text version
Pie chart describing Government of Canada tangible capital assets, for a total of 83.6 billion dollars in net book value in the 2019 to 2020 fiscal year.
Vehicles occupy 15.3 billion dollars. Machinery and equipment occupy 12 billion dollars. Buildings occupy 17.8 billion dollars. Works infrastructure occupies 12.1 billion dollars. Land occupies 2.1 billion dollars. Assets under construction occupies 20.1 billion dollars. Finally, other assets occupy 4.2 billion dollars.
Source: 2019-20 Public Accounts Volume 1, Tangible Capital Assets and Volume III, section 5; the Directory of Federal Real Property (government-owned land and buildings)
Procurement
A very steady pattern of concentration of high-volume, low-value contracts and low-volume, high-value contracts has been seen over the past decade.
Total cost of 415,885 contracts in CY 2019: $21.3B
- In calendar year 2019, the federal government awarded contracts worth $21.3B, totaling 415,885 contracts
- 93% were valued under $25K. However, the vast majority of expenditures ($19.4B) related to contracts over $25K
Total cost of over 382,000 contracts on a 9-year average: $18.5B
- On a nine-year average, the federal government has awarded $18.5B in contracts annually (over 382,000 contracts)
- Of those over 382,000 contracts, 92% of contracts are valued at less than $25K
- Of the remaining 8% of contracts with values exceeding $25K, total expenditures averaged $17B annually
Source: TBS Published Proactive Disclosure of Contracts Data as of June 21, 2021
Procurement by Type of Provider
| Military Procurement | Major Complex Procurement | Basic Goods | Services (Excluding major military and non-military) | ||
|---|---|---|---|---|---|
| Percentage of value by enterprise category (type of provider) | Small-Medium Enterprises | 24% | 26% | 49% | 66% |
| Large Canadian Enterprises | 50% | 74% | 41% | 31% | |
| Foreign Enterprises | 26% | 0%* | 10% | 3% | |
| Total | 100% | 100% | 100% | 100% | |
The figures are based on contracts awarded by PSPC's Acquisitions Program on behalf of client departments and agencies from FY 2011-12 to FY 2020-21. * No business with foreign enterprises in the major complex procurement category can be explained by the fact that the large Canadian enterprise category included foreign enterprises with a Canadian subsidiary. Source: PSPC |
|||||
Procurement by Category
Type: Military Procurement
Total
36% ($6.2B) of PSPC-Acquisitions Program (AP) procurements
Distribution
(percentage of figures are based on total value of contracts)
66% competitive
34% non-competitive
Goods: $3.7B
Services: $2.5B
SMEs: 24%
Large Canadian Enterprises: 50%
Foreign Enterprises: 26%
Type: Major Complex Procurement
Total
24% ($4.1B) of PSPC-AP procurements
Distribution
(percentage of figures are based on total value of contracts)
95% competitive
5% non-competitive
Goods: $0.4B
Services: $3.7B
SMEs: 26%
Large Canadian Enterprises: 74%
Foreign Enterprises: 0%
Type: Basic Goods
Total
15% ($2.5B) of PSPC-AP procurements
Distribution
(percentage of figures are based on total value of contracts)
75% competitive
25% non-competitive
SMEs: 49%
Large Canadian Enterprises: 41%
Foreign Enterprises: 10%
Indigenous Enterprises: 5%
Type: Services (Excluding major military and non-military)
Total
25% ($4.2B) of PSPC-AP procurements – excluding military procurement and major complex procurements
Distribution
(percentage of figures are based on total value of contracts)
93% competitive
7% non-competitive
SMEs: 66%
Large Canadian Enterprises: 31%
Foreign Enterprises: 3%
Indigenous Enterprises: 7%
The figures are based on contracts awarded by PSPC's Acquisitions Program on behalf of client departments and agencies from FY 2011-12 to FY 2020-21.
Source: PSPC, 2021
Federal Real Property

Figure 16 - Text version
Pie chart displaying the percentage in Crown-owned land area by the top three reporting organizations. Parks Canada Agency occupies 92%, Environment and Climate Change Canada occupies 6%, National Defence occupies 2%, and all other organizations occupy 1%.

Figure 17 - Text version
Pie chart displaying the percentage in Crown-owned floor space by the top ten reporting organizations.
National defence occupies 44%, Public Services and Procurement Canada occupies 14%, Correctional Service Canada occupies 6%, Canada Post occupies 6%, Royal Canadian Mounted Police occupies 4%, Transport Canada occupies 4%, Parks Canada Agency occupies 3%, Agriculture and Agri-Food Canada occupies 2%, Fisheries and Oceans Canada occupies 2%, National Research Council Canada occupies 2%, and all other organizations occupy 13%.
- Federal real property belongs to the Crown in right of Canada: administration entrusted to 16 departments, 22 agent Crown corporations and 16 port authorities
- 11,997 properties (39 million hectares) and 33,696 buildings (23.8 million square meters of space)
- Inventory includes office buildings, military bases, laboratories, light stations, penitentiaries, embassies, national parks, customs border crossings and infrastructure such as bridges and damsFootnote 6
- Approximately 21% of Crown-owned buildings and 21% of floor space are in poor or critical condition
Note: Directory of Federal Real Property as of June 23, 2021. Data includes Crown owned interest type for all reporting organizations.
Source: TBS
Government Expenditures on Real Property
Approximately $12.6B in 2019-20 to buy, construct, fit-up, operate, maintain and recapitalize real property
The current portfolio is not significantly different from 2005-06 but expenditures increased by 68%

Figure 18 - Text version
Comparative bar graph describing Government Expenditures on Real Property. The X-axis shows the year, and the Y-axis shows dollars in billions.
In the 2005 to 2006 fiscal year, 3.5 billion dollars were spent on operating expenditures, 3.0 billion dollars were spent on maintenance and repair, and 1.0 billion dollars were spent on acquisitions, construction, and renovation. This came up to a total of 7.5 billion dollars.
In the 2006 to 2007 fiscal year, 3.3 billion dollars were spent on operating expenditures, 3.4 billion dollars were spent on maintenance and repair, and 0.8 billion dollars were spent on acquisitions, construction, and renovation. This came up to a total of 7.6 billion dollars.
In the 2007 to 2008 fiscal year, 3.7 billion dollars were spent on operating expenditures, 3.7 billion dollars were spent on maintenance and repair, and 0.9 billion dollars were spent on acquisitions, construction, and renovation. This came up to a total of 8.2 billion dollars.
In the 2008 to 2009 fiscal year, 4.1 billion dollars were spent on operating expenditures, 4.1 billion dollars were spent on maintenance and repair, and 1.2 billion dollars were spent on acquisitions, construction, and renovation. This came up to a total of 9.3 billion dollars.
In the 2009 to 2010 fiscal year, 4.4 billion dollars were spent on operating expenditures, 4.8 billion dollars were spent on maintenance and repair, and 1.0 billion dollars were spent on acquisitions, construction, and renovation. This came up to a total of 10.2 billion dollars.
In the 2010 to 2011 fiscal year, 4.3 billion dollars were spent on operating expenditures, 5.1 billion dollars were spent on maintenance and repair, and 1.5 billion dollars were spent on acquisitions, construction, and renovation. This came up to a total of 10.9 billion dollars.
In the 2011 to 2012 fiscal year, 4.3 billion dollars were spent on operating expenditures, 4.7 billion dollars were spent on maintenance and repair, and 1.6 billion dollars were spent on acquisitions, construction, and renovation. This came up to a total of 10.5 billion dollars.
In the 2012 to 2013 fiscal year, 4.3 billion dollars were spent on operating expenditures, 4.4 billion dollars were spent on maintenance and repair, and 1.8 billion dollars were spent on acquisitions, construction, and renovation. This came up to a total of 10.5 billion dollars.
In the 2013 to 2014 fiscal year, 4.2 billion dollars were spent on operating expenditures, 4.4 billion dollars were spent on maintenance and repair, and 1.7 billion dollars were spent on acquisitions, construction, and renovation. This came up to a total of 10.3 billion dollars.
In the 2014 to 2015 fiscal year, 4.2 billion dollars were spent on operating expenditures, 4.3 billion dollars were spent on maintenance and repair, and 1.8 billion dollars were spent on acquisitions, construction, and renovation. This came up to a total of 10.3 billion dollars.
In the 2015 to 2016 fiscal year, 4.1 billion dollars were spent on operating expenditures, 4.5 billion dollars were spent on maintenance and repair, and 1.8 billion dollars were spent on acquisitions, construction, and renovation. This came up to a total of 10.5 billion dollars.
In the 2016 to 2017 fiscal year, 4.0 billion dollars were spent on operating expenditures, 4.9 billion dollars were spent on maintenance and repair, and 2.4 billion dollars were spent on acquisitions, construction, and renovation. This came up to a total of 11.3 billion dollars.
In the 2017 to 2018 fiscal year, 4.1 billion dollars were spent on operating expenditures, 3.7 billion dollars were spent on maintenance and repair, and 3.0 billion dollars were spent on acquisitions, construction, and renovation. This came up to a total of 10.8 billion dollars.
In the 2018 to 2019 fiscal year, 4.1 billion dollars were spent on operating expenditures, 4.9 billion dollars were spent on maintenance and repair, and 2.4 billion dollars were spent on acquisitions, construction, and renovation. This came up to a total of 11.4 billion dollars.
In the 2019 to 2020 fiscal year, 4.2 billion dollars were spent on operating expenditures, 4.8 billion dollars were spent on maintenance and repair, and 3.6 billion dollars were spent on acquisitions, construction, and renovation. This came up to a total of 12.6 billion dollars.
- Expenditures are normalized to 2020 dollars
- Payroll expenditures for employees supporting real property are excluded
- Due to limitations of Public Accounts, may include certain non-real property expenditures
Source: TBS; Central Financial Management Reporting System for departments and agencies
Departmental Expenditures on Materiel
Materiel may be defined as “Movable property and all assets, including equipment and stores,Footnote 7 other than money and real property.” The average spend on materiel was $4.5B over the past 10 years.

Figure 19 - Text version
This bar graph depicts Government of Canada expenditures on Materiel acquisition from fiscal years 2011-2012 to 2020-2021.
In 2010-2011, expenditures on materiel acquisition was $5B.
In 2011-2012, expenditures on materiel acquisition was $4B.
In 2012-2013, expenditures on materiel acquisition was $3.7B.
In 2013-2014, expenditures on materiel acquisition was $3.5B.
In 2014-2015, expenditures on materiel acquisition was $3.8B.
In 2015-2016, expenditures on materiel acquisition was $4.1B.
In 2016-2017, expenditures on materiel acquisition was $3.9B.
In 2017-2018, expenditures on materiel acquisition was $4.9B.
In 2018-2019, expenditures on materiel acquisition was $6.3B.
In 2019-2020, expenditures on materiel acquisition was $5.9B.
Source: TBS-OCG
Materiel Management – Light Duty Fleet
| Propulsion type | Vehicle Count | Percentage | |
|---|---|---|---|
| Conventional Fleet | Internal combustion engine (gasoline, diesel) | 15,618 | 92% |
| Hybrid electric vehicles | 1,106 | 6% | |
| Zero emission vehicles* | 339 | 2% | |
| Total | 17,063 | 100% | |
| National Safety and Security Fleet** | Internal combustion engine (gasoline, diesel) | 11,577 | 99% |
| Hybrid electric vehicles | 62 | 0.50% | |
| Zero emission vehicles* | 3 | 3% | |
| Total | 11,642 | 100% | |
* Zero emission vehicles include battery electric, plug-in hybrid and hydrogen fuel cell vehicles. ** DND and RCMP vehicles with an explicit safety or security function (e.g. police vehicles). Source: TBS (OCG_ASAS and Office of Greening Government) PSPC, ARI - June 2021 |
|||
- >28,700 light-duty and executive vehicles owned by 54 departments and agencies
- This includes >17,000 conventional vehicles and >11,600 national safety and security vehicles
- RCMP and DND account for the largest percentage (64%)
- Annual replacement expenditure (2019-20) approx. $134M
- Annual O&M costs approx. $122M
- The federal government also owns >3,400 commercial vehicles, >7,600 standard military pattern vehicles and >8,000 other vehicles (e.g. off-road, industrial equipment)
Greening government - CGG
Sources of Greenhouse Gas Emissions, 2019-20
The Greening Government Strategy defines how the Government of Canada will transition to net-zero carbon and climate-resilient operations, while also reducing environmental impacts beyond carbon, including on waste, water and biodiversity.

Figure 20 - Text version
Pie chart describing sources of greenhouse gas emissions. Specifically, the estimated procurement of air travel and commuting. For a total of 4671 kilotons (Scope 3 - Indirect emissions), the pie chart breaks this down into seven categories.
Procurement: Fleet/equipment maintenance occupies 895 kilotons. Procurement: energy occupies 658 kilotons. Procurement: construction occupies 367 kilotons. Procurement: IT occupies 225 kilotons. Commuting occupies 328 kilotons.
Air travel occupies 220 kilotons. Procurement: other goods and services occupy 1978 kilotons.
As of fiscal year 2019-20, emissions from government-owned and leased buildings and conventional fleet have been reduced by 34.6% relative to 2005-06 levels, on track to meeting the 40% reduction by 2025 target.

Figure 21 - Text version
Pie chart describing buildings and conventional fleet. For a total of 1177 kilotons (Scope 1-2), the pie chart breaks this down into four categories. Buildings (heating and cooling) occupy 736 kilotons. Aircraft, marine, and other occupy 53 kilotons. Buildings (electricity) occupy 318 kilotons. Road vehicles occupy 71 kilotons.
Pie chart describing national safety and security fleet. For a total of 951 kilotons (Scope 1), the pie chart breaks this down into three categories. Aircraft occupies 592 kilotons. Ships occupy 278 kilotons. Land occupies 81 kilotons.
Regulations – RAS
The Federal Regulatory System
400 Acts with 3K RegulationsFootnote 8
55 departments and agencies have regulatory responsibilities
34K FTEs perform regulatory functions
150-200 Proposals for new or amended regulations and 200-300 Proposals for Orders in Council are reviewed and approved annually by Treasury Board
Source: TBS, June 2021
Forecasted OCHRO Budget 2022-2023 and HR overview
Attestation
IBP (2023-24) – OCHRO Financial Attestation
I approve the OCHRO financial situation as presented in this deck for the current forecast exercise.
Funding has been allocated to the highest priorities in my organization, and any pressures requests represent only where I have deemed that there would be a significant impact on delivery on my core responsibilities.
Any additional comments will be provided as needed to the Financial Management Advisor (FMA).
For fund centres under my direct responsibility, I attest as follows that:
- The Salary and Operations and Maintenance (O&M) forecasts are fairly presented. Non-salary commitments (contracts) are reasonable.
- Salary planned staffing has been verified and is reasonable. The forecasts fairly present OCHRO’s capacity to staff within the operational requirements by the year end.
- Active and planned projects have been discussed with my designated Financial Management Advisor and identified, where applicable.
- Proactive identification of Financial Risk which could impact resource requirements & program delivery for the Secretariat has been considered, identified and discussed with my designated Financial Management Advisor to identify next steps, mitigation strategies (where applicable).
Mélissa Beaumier-Robert
Manager, Financial Management Advisory Services
Date
Francis Trudel
Associate Chief Human Resources Officer
Date
Objectives
- To present the results of the 2023-24 IBP Exercise (Part 2).
- To seek approval (attestation) of the 2023-24 IBP forecasts.
Executive Summary
Overall: OCHRO is forecasting a surplus of $6.0M for the 2023-24 IBP Forecasting Exercise.
- Planned staffing is ambitious at 203 FTEs (260 staffing actions) for the fiscal year in light of the high turn over and difficulties hiring in the current labour market. OCHRO has grown by 45 FTEs only in 2022-23 compared to 2021-22.
- Attrition of $15.1M (119 FTEs) was included. If the attrition does not materialize to the level expected, activities will have to be reduced to ensure OCHRO remains within its authorities.
- Even though additional funding is anticipated for future years, it is expected that OCHRO will still have pressures and difficulties staying within its authorities since its mandate keeps growing but additional funding to be received is limited and mostly temporary (slide 12).
- Financial risks and considerations that may have a significant impact on the forecast have been identified (slide 13).
- Results of the 2023-24 IBP Financial Forecasting Exercise are to be presented to EXCO in March.
General Operating: OCHRO is forecasting a surplus of $5.7M for the 2023-24 IBP Forecasting Exercise.
- General Operating : A deficit of $1.9M is forecasted, once risk management of $4.5M is factored-in, due to existing pressures (slide 7).
- Pay Equity: A surplus of $7.6M is forecasted due to the delay of coming into force of the Pay Equity Act.
- To achieve this financial situation, OCHRO must secure $21.4M in additional funding: $7M requested in B2023 for CDI ($3.1M) and Classification ($3.9M) that has yet to be approved, $10.7M for Program Integrity, $0.6M in Vote 10 for PA Modernization and $3.3M in ARLU mostly for B2022 items:
- With the exception of B2023 items, risk of not receiving the funding is low.
- Additional funding was requested as part of B2023 for the Global Strategy. However, the requested funding and related forecast have been excluded from the financial situation at this time.
- OCHRO has $6.7M in pressures at IBP (slides 6 & 7). Mitigation strategies are in place to limit the usage of Pay Equity funding to offset these pressures.
- Pay Equity did not include the purchase of the Value of Work Assessment Tool in its forecast. At IBP, the cost is still to be determined. Consequently, the current surplus in Pay Equity may not fully materialize in 2023-24.
SPA: OCHRO is forecasting a surplus of $0.4M for the 2023-24 IBP Forecasting Exercise.
- Charter Challenge: A breakeven is forecasted, once risk management of $0.5M is factored-in.
- HR to Pay: A surplus of $0.4M is forecasted, once risk management of $1.8M is factored-in. This surplus cannot be used to offset other pressures.
- To achieve this financial situation, OCHRO must secure the $15.9M in funding requested in B2023 for HR to Pay that has yet to be approved.
- This financial situation includes $2.3M in pressures (slide 7) that are being risk managed within SDDS & ERTC.
Overall Financial Situation (Includes EBP)
Financial Situation Report
As of January 18, 2023
| 2023-24 Overall Financial Situation (incl. EBP) | 2022-23 | 2021-22 | |||||||||
|---|---|---|---|---|---|---|---|---|---|---|---|
| Division Name | Budget | Anticipatory Budget | Total Budget | IBP Forecast | Surplus/ (Deficit) | Anticipated B2023 Funding (Sunsetters) | Risk Management Within Sector | Revised Surplus/ (Deficit) | P10 Forecast | Actuals | |
| A | B | C=A+B | D | E=C-D | F | G | H=E+F+G | ||||
| General Operating | DMO | 1,310,449 | 1,300,992 | 2,611,441 | 2,303,128 | 308,313 | - | - | 308,313 | 2,609,054 | 2,200,035 |
| ERTC | 20,220,082 | 3,382,778 | 23,602,860 | 33,564,413 | (9,961,553) | 3,891,051 | 3,821,840 | (2,248,662) | 33,434,464 | 26,674,690 | |
| P&C | 21,013,042 | 6,601,965 | 27,615,008 | 30,170,234 | (2,555,226) | 2,502,465 | - | (52,761) | 27,083,726 | 22,777,716 | |
| SDDS | 10,399,787 | 3,177,153 | 13,576,940 | 14,878,260 | (1,301,320) | 585,000 | 716,321 | 1 | 12,081,813 | 10,568,278 | |
| Sub-Total - General Operating | 52,943,360 | 14,462,888 | 67,406,249 | 80,916,035 | (13,509,786) | 6,978,516 | 4,538,161 | (1,993,109) | 75,209,058 | 62,220,719 | |
| Other General Operating | PAY EQUITY | 11,663,974 | - | 11,663,974 | 4,015,028 | 7,648,946 | - | - | 7,648,946 | 2,629,884 | 2,435,022 |
| SETTLEMENTS | - | - | - | - | - | - | - | - | 20,550,000 | - | |
| VACCINATION POLICY (B12K) | - | - | - | - | - | - | - | - | - | - | |
| Sub-Total - Other General Operating | 11,663,974 | - | 11,663,974 | 4,015,028 | 7,648,946 | - | - | 7,648,946 | 23,179,884 | 2,435,022 | |
| Grand Total - General Operating | 64,607,335 | 14,462,888 | 79,070,223 | 84,931,063 | (5,860,840) | 6,978,516 | 4,538,161 | 5,655,837 | 98,388,942 | 64,655,740 | |
| SPA | CHARTER CHALLENGE | 1,700,000 | - | 1,700,000 | 2,184,688 | (484,688) | - | 484,688 | (0) | 790,966 | 194,959 |
| HR TO PAY (B12P) | - | - | - | 17,373,347 | (17,373,347) | 15,919,108 | 1,835,095 | 380,856 | 16,267,780 | 15,123,966 | |
| Sub-Total - SPA | 1,700,000 | - | 1,700,000 | 19,558,035 | (17,858,035) | 15,919,108 | 2,319,783 | 380,855 | 17,058,746 | 15,318,925 | |
| VNR | PSSA | 10,779,089 | (1,068,788) | 9,710,301 | 9,710,301 | 0 | - | - | 0 | 9,026,642 | 8,805,675 |
| Total | 77,086,424 | 13,394,100 | 90,480,524 | 114,199,399 | (23,718,875) | 22,897,624 | 6,857,944 | 6,036,692 | 124,474,330 | 88,780,339 | |
- At IBP, OCHRO is forecasting an overall surplus of $5.7M in General Operating and a surplus of $0.4M in its SPAs, once risk management and funding requested in B2023 for Classification ($3.9M), CDI ($3.1M) and HR to Pay ($15.9M) have been included.
- General Operating : The deficit of $1.9M in General Operating is temporarily offset by the surplus of $7.6M planned for Pay Equity under Other General Operating.
- Charter Challenge: A breakeven is forecasted.
- HR to Pay: A surplus of $0.4M is forecasted but it cannot be used to offset other pressures within OCHRO.
- PSSA: A breakeven is forecasted as revenues collected at year-end cannot exceed expenditures as per the Vote Netted Revenue (VNR) authority.
- The anticipatory budget of $14.5M is mostly for Program Integrity funding ($10.7M). Additional information on anticipated budget transfers can be found in Annex A.
- Compared to the 2022-23 P10 forecast, expenditures are forecasted to decrease by $10.3M (8%) in 2023-24 due to:
- A decrease in forecasted expenditures of $20.6M related to the Phoenix litigation and the UCCO settlement agreement, not reoccurring in 2023-24; offset by
- An increase of $10.3M due to new initiatives to be funded by the Program Integrity funding and increased workload in existing programs.
Pressures and Mitigation Strategies
- Sectors have $2.2M in pressures that aren’t being risk managed at this time:
- Pending approval by the CHRO, ERTC would like to submit a request to the Departmental Reserve for $2.2M.
- ERTC is already risk managing $3.8M in other pressures in its regular operating and its ability to risk manage more is limited, unless Pay Equity funding is used.
- If funding isn’t approved, activities and priorities will need to be reviewed since the pressures below are non-discretionary expenditures.
- Some of the pressures could be managed with OCHRO at this time and reassessed at the next forecasting exercise when there is greater clarity around OCHRO’s financial situation and B2023 requests.
| Sector | Title | Pressure Amount | Description | Risk Level |
|---|---|---|---|---|
| Included in Forecast | ||||
| ERTC | Command Centre | $0.2M | ERTC's forecast includes a cost estimates of $50K for salary and 100K in G&S. A request to the Departmental Reserve could be submitted to signal the intention of requesting funding if the amount goes beyond what OCHRO can risk manage. |
High |
| OCA Financial Analysis (MOU with OSFI) |
$0.3M | The OCA within OSFI is increasing significantly its costs starting in 2023-24, creating a pressure for ERTC. Risk is high since this is a non-discretionary expenditure. Funding could be sought from the Departmental Reserve considering the $3.8M in pressures already being risk managed by ERTC. However, a long-term mitigation strategy needs to be implemented. | High | |
| Collective bargaining negotiations | $1.1M | The $1.1M deficit in O&M is explained by the cyclical negotiations cycle, along with the PIC hearing-related costs and the physical hotel/boardroom reservations and related simultaneous translation costs. ERTC only has funding for its normal operations not for negotiations. Next year all negociation tables will be active, which explains the pressure. It goes above what ERTC can afford with its operational budget. | High | |
| Retendering of Benefit Plans (FTEs) |
$0.7M | Retendering has been an ongoing pressure for ERTC as this program hasn't been properly funded in the past. Funding has been allocated from the Departmental Reserve in some fiscal years to alleviate the pressure. A long-term solution needs to be implemented but a request for Reserve Funding could be submitted once more in 2023-24. The pressure is for $0.7M including EBP. | High | |
| Total - Items for Submission to Dept. Reserve | $2.2M | |||
- Sectors within OCHRO have $6.8M in pressures that are being risk managed. If funding requested in B2023 isn’t approved, the sectors ability to manage these pressures within could be compromised.
- ERTC: Mitigation strategies are in place to limit the usage of Pay Equity funding, especially since the Pay Equity forecast does not include the purchase of a new system (Value of Work Assessment Tool) as the cost is still to be determined.
- SDDS: Mitigation strategies are in place to ensure the sector stays within its authorities.
- P&C: The sector has $4.1M in pressures for CDI ($2.5M) and Official Languages ($1.6M), however surpluses within the sector are fully offsetting the pressures.
| Sector | Title | Pressure Amount | Description | Risk Level |
|---|---|---|---|---|
| Included in Forecast | ||||
| ERTC | Classification |
$3.6M | ERTC is ramping up work on Classification. The overal deficit for Classification is $8M. However, it will be offset in part if the funding requested in B2023 ($3.9M) is approved leaving a pressure of $4.1M. There are also surpluses in other areas of ERTC reducing the pressure further to $3.7M. The following mitigation strategies are in place to ensure ERTC stays withing its budget: 1) Work is under way to resubmit a reprofile request for PA Mod. If approve, an additional $1.9M would be allocated to ERTC in 2023-24. 2) Planned staffing ($1.1M) could be reduced slightly. 3) Minimal funding could be temporarily borrowed from Pay Equity. |
Medium |
| Increased Workload - Strategic Compensation Management | $0.2M | The deficit is in part due employees hired on a permanent basis for Vaccination that now have to be absorbed in regular operations since the funding sunsetted. This pressure will be risk managed within ERTC through slippage. | Low | |
| SDDS | ETMS MOU | $0.7M | ETMS is a annual MOU and a recurring pressure. This MOU is always funded through slippage. It is recommended to risk manage within SDDS at this time. | Low |
| Sub-Total - Regular Operating | $4.5M | |||
| SDDS | HR to Pay (SPA) |
$1.8M | Current forecast for HR to Pay is $1.8M over the requested funding in B2023. It is recommended to risk manage this pressure within SDDS at this time in light of the following mitigation strategies: - Flexibility exists in the ambitous planned staffing of $4.4M, which includes 24 staffing actions for new employees with a start date in the first quarter of 2023-24. - A surplus is currently forecasted in the SPA for 2022-23. This surplus could potentially be reprofiled to 2023-24. - Discussions are still underway regarding the allocation of the $10M that could be received from SSC. An amount could potentially be allocated to DS to offset its salary deficit if slippage in planned staffing does not materialize to the expected levels. |
Low |
| ERTC | Increased Workload - Charter Challenge (SPA) |
$0.5M | Salary expenditures are forecasted to increase further in 2023-24 due to an increase in workload within the program (8 staffing actions for 7.6 FTEs planned). As part of B2023, a request was submitted to increase the TBS Charter Challenge Fund by $13M. If the request is approve, ERTC could increase the amount it is planning to access from the Frozen Allotment in order to offset this pressure. It is recommended to risk manage this pressure within ERTC at this time until a decision is rendered on the B2023 request. |
High |
| Sub-Total - SPA | $2.3M | |||
| Grand Total | $6.8M | Items being risk managed by the sectors | ||
Salary Financial Situation (Includes EBP)
| 2023-24 Salary (incl. EBP) | 2022-23 | 2021-22 | |||||||||
|---|---|---|---|---|---|---|---|---|---|---|---|
| Division Name | Budget | Anticipatory Budget | Total Budget | IBP Forecast | Surplus/ (Deficit) | Anticipated B2023 Funding (Sunsetters) | Risk Management Within Sector | Revised Surplus/ (Deficit) | P10 Forecast | Actuals | |
| A | B | C=A+B | D | E=C-D | F | G | H=E+F+G | ||||
| General Operating | DMO | 1,219,713 | - | 1,219,713 | 2,248,278 | (1,028,565) | - | - | (1,028,565) | 2,490,356 | 2,173,630 |
| ERTC | 17,693,347 | 2,872,047 | 20,565,394 | 26,515,462 | (5,950,068) | 3,453,855 | 3,002,309 | 506,096 | 27,251,546 | 23,875,605 | |
| P&C | 16,016,268 | 4,641,491 | 20,657,760 | 22,841,666 | (2,183,906) | 1,531,465 | - | (652,441) | 21,383,528 | 18,516,595 | |
| SDDS | 9,265,065 | 2,239,653 | 11,504,718 | 11,467,518 | 37,200 | - | - | 37,200 | 9,765,813 | 7,833,900 | |
| Sub-Total - General Operating | 44,194,393 | 9,753,191 | 53,947,585 | 63,072,924 | (9,125,339) | 4,985,320 | 3,002,309 | (1,137,710) | 60,891,243 | 52,399,730 | |
| Other General Operating | PAY EQUITY | 2,873,192 | - | 2,873,192 | 2,823,052 | 50,140 | - | - | 50,140 | 2,480,946 | 2,374,551 |
| SETTLEMENTS | - | - | - | - | - | - | - | - | - | - | |
| Sub-Total - Other General Operating | 2,873,192 | - | 2,873,192 | 2,823,052 | 50,140 | - | - | 50,140 | 2,480,946 | 2,374,551 | |
| Grand Total - General Operating | 47,067,586 | 9,753,191 | 56,820,777 | 65,895,976 | (9,075,199) | 4,985,320 | 3,002,309 | (1,087,570) | 63,372,189 | 54,774,281 | |
| SPA | CHARTER CHALLENGE | 1,079,500 | - | 1,079,500 | 1,564,188 | (484,688) | - | 484,688 | (0) | 783,016 | 194,959 |
| HR TO PAY (B12P) | - | - | - | 11,322,062 | (11,322,062) | 10,683,196 | 496,668 | (142,198) | 10,423,337 | 12,134,274 | |
| Sub-Total - SPA | 1,079,500 | - | 1,079,500 | 12,886,250 | (11,806,750) | 10,683,196 | 981,356 | (142,199) | 11,206,353 | 12,329,233 | |
| VNR | PSSA | 6,444,089 | (1,004,788) | 5,439,301 | 5,439,301 | 0 | - | - | 0 | 5,353,264 | 5,129,353 |
| Total | 54,591,175 | 8,748,403 | 63,339,578 | 84,221,527 | (20,881,949) | 15,668,516 | 3,983,665 | (1,229,769) | 79,931,806 | 72,232,867 | |
- At IBP, OCHRO is forecasting an overall deficit of $1.1M in General Operating and a deficit of $0.1M in its SPAs, once risk management and funding requested in B2023 for Classification ($3.5M), CDI ($1.5M) and HR to Pay ($10.7M) have been included.
- General Operating: The deficit of $1.1M is mostly due to Program Integrity funding to be received in O&M for DMO and some areas of P&C.
- Charter Challenge: A breakeven is forecasted.
- HR to Pay: The salary deficit of $0.1M is offset by the funding to be received from SSC in O&M.
- An overall 15% attrition ($15.1M) was included in the determination of the salary forecast due to high turn over and difficulties staffing in the current labour market.
- In comparison to the 2022-23 P10 forecast, OCHRO’s IBP forecast of $84.2M is $4.3M (5%) higher due to :
- An increase of $0.8M for Charter Challenge mostly due to an increase in workload;
- An increase of $0.9M for HR to Pay as additional resources will be hired to support the Program;
- P&C: An increase of $1.5M due to new initiatives anticipated to be funded in 2023-24 via the Program Integrity funding; and
- SDDS: An increase of $1.7M due to new initiatives anticipated to be funded in 2023-24 via the Program Integrity funding; offset by
- ERTC: A decrease of $0.4M as a result of the sunsetting of the vaccination program; and
- DMO: A decrease of $0.2M due to the strategy in place to hire employees in more junior positions to carry out the work.
Salary Forecast by Employee Type
| Indeterminate | Determinate | Other (Student, Casual) |
Planned Staffing | Global Salaries | Attrition 15% | Total | FTE 2023-24 |
||
|---|---|---|---|---|---|---|---|---|---|
| FTEs | 534.5 | 48.4 | 4.3 | 202.5 | - | (119.4) | 670.3 | 670.3 | |
| General Operating | DMO | 2,267,334 | - | 7,747 | 369,952 | - | (396,755) | 2,248,278 | 20.6 |
| ERTC | 25,475,301 | 937,035 | 73,707 | 4,726,317 | 115,278 | (4,812,176) | 26,515,462 | 200.9 | |
| P&C | 14,646,212 | 4,066,064 | 237,066 | 7,872,761 | 50,446 | (4,030,882) | 22,841,666 | 181.9 | |
| SDDS | 9,405,795 | 265,190 | 49,784 | 3,770,430 | - | (2,023,681) | 11,467,518 | 91.1 | |
| Sub-Total - General Operating | 51,794,642 | 5,268,289 | 368,304 | 16,739,460 | 165,724 | (11,263,494) | 63,072,924 | 494.5 | |
| Other General Operating | PAY EQUITY | 2,504,124 | - | - | 817,114 | - | (498,186) | 2,823,052 | 21.4 |
| Total - General Operating | 54,298,765 | 5,268,289 | 368,304 | 17,556,574 | 165,724 | (11,761,680) | 65,895,976 | 515.9 | |
| SPA | CHARTER CHALLENGE | 666,155 | 255,512 | - | 918,555 | - | (276,033) | 1,564,188 | 12.0 |
| HR TO PAY (B12P) | 8,346,203 | 514,532 | 26,807 | 4,531,477 | 12,065 | (2,109,023) | 11,322,062 | 99.8 | |
| Sub-Total - SPA | 9,012,358 | 770,044 | 26,807 | 5,450,032 | 12,065 | (2,385,056) | 12,886,250 | 111.8 | |
| VNR | PSSA | 4,910,213 | 174,718 | 21,007 | 1,216,371 | 83,985 | (966,994) | 5,439,301 | 42.7 |
| Total - OCHRO | 68,221,336 | 6,213,051 | 416,119 | 24,222,977 | 261,774 | (15,113,730) | 84,221,527 | ||
| 81% | 7% | 0% | 29% | 0% | -18% | 100% |
| # Staffing Actions | Net New (Indeterminate) | Replacement (Indeterminate) | Term, Casual, Students (Temporary) |
Total | ||||||
|---|---|---|---|---|---|---|---|---|---|---|
| $ | FTE | $ | FTE | $ | FTE | $ | FTE | |||
| General Operating | DMO | 3 | 22,117 | - | 347,835 | 2.8 | - | - | 369,952 | 2.8 |
| ERTC | 52 | 2,325,987 | 16.2 | 839,459 | 6.9 | 1,560,872 | 13.4 | 4,726,317 | 36.5 | |
| P&C | 81 | 2,582,458 | 19.8 | 3,785,043 | 30.4 | 1,505,260 | 11.6 | 7,872,761 | 61.8 | |
| SDDS | 38 | 2,605,950 | 21.9 | 745,856 | 7.1 | 418,624 | 4.4 | 3,770,430 | 33.3 | |
| Sub-Total - General Operating | 174 | 7,536,512 | 57.9 | 5,718,192 | 47.0 | 3,484,756 | 29.4 | 16,739,460 | 134.4 | |
| Other General Operating | PAY EQUITY | 7 | 6,072 | 0.0 | 103,101 | 1.0 | 707,942 | 6.0 | 817,115 | 7.0 |
| Sub-Total - Other General Operating | 7 | 6,072 | 0.0 | 103,101 | 1.0 | 707,942 | 6.0 | 817,115 | 7.0 | |
| Total - General Operating | 181 | 7,542,584 | 57.9 | 5,821,293 | 48.0 | 4,192,698 | 35.4 | 17,556,575 | 141.4 | |
| SPA | CHARTER CHALLENGE | 8 | 527,443 | 4.4 | - | - | 391,111 | 3.2 | 918,554 | 7.6 |
| HR TO PAY (B12P) | 51 | 2,390,602 | 22.4 | 1,413,482 | 11.4 | 727,393 | 9.2 | 4,531,477 | 42.9 | |
| Sub-Total - SPA | 59 | 2,918,045 | 26.8 | 1,413,482 | 11.4 | 1,118,504 | 12.4 | 5,450,031 | 50.5 | |
| VNR | PSSA | 20 | 651,755 | 4.8 | 226,788 | 2.2 | 337,828 | 3.6 | 1,216,371 | 10.6 |
| Total - OCHRO | 260 | 11,112,384 | 89.5 | 7,461,563 | 61.6 | 5,649,030 | 51.4 | 24,222,977 | 202.5 | |
| 44% | 30% | 25% | 100% | |||||||
- At IBP, OCHRO has $24M (29%) in overall planned staffing.
- Slippage is expected since 112 FTEs are planned to start by the end of Q1.
- Indeterminate employees (including planned staffing) represent $87M compared to an ongoing salary budget of $45.2MFootnote 4. The sustainability of the salary forecast represents a risk that will need to be closely monitored. Temporary funding is alleviating some of the risk.
- Some employees will be hired on an indeterminate basis even though funding is temporary due to the highly specialized skill sets required. OCHRO needs to establish mitigation strategies to ensure indeterminate employees are reassigned to other priorities or deployed to other teams/sectors once the funding has sunsetted or if the funding requests are not approved.
FTE Analysis (incl. EBP)
FTE Affordability analysis provides sectors with information on how many FTEs they can afford for a given fiscal year based on their forecasted average salary and total budget salary. The FTE affordability presents a simplified image of a sector’s health and is not meant to be a cap.
Operating Vote, VNR and SPA - by Fiscal Year

Figure 22 - Text version
2021-22: There were 565 FTEs on strength
2022-23: OCHRO’s FTE Affordability Benchmark has been estimated at 598 FTEs compared to a forecast of 610 FTEs of which 597 FTEs are on strength and 13 FTEs are planned.
2023-24: OCHRO’s FTE Affordability Benchmark has been estimated at 504 FTEs compared to a forecast of 670 FTEs of which 468 FTEs are on strength and 202 FTEs are planned.
| FTE Affordability Measure | # |
|---|---|
| Total FTEs allowed per Salary Budget | 228.2 |
| Forecasted FTEs | 283.7 |
| Variance | (55.5) |
| Avg. Sal $ per FTE | $131,289 |
- OCHRO’s FTE Affordability has been estimated at 504 FTEs in 2023-24, which is lower than the 598 FTEs for 2022-23. The decrease is due to the Classification, CDI & HR to Pay funding that sunsetted in 2022-23, for which renewal has yet to be approved. If funding is approved in full for these initiatives, OCHRO’s FTE Affordability would increase by 124 FTEs to reach 628 FTEs.
- It is anticipated that the number of FTEs will increase by 60 FTEs (10%) in 2023-24 to reach 670 FTEs (once attrition of 119 FTEs has been included) due to increases in workload for the existing programs and new mandates/initiatives.
- If funding requested in B2023 is received in full, OCHRO will still be 42 FTEs over the revised FTE Affordability. The variance is high and explained in part by funding being received in O&M for some initiatives. Planned staffing needs to be carefully managed to minimize salary deficits and ensure the salary forecast is sustainable for future years. If funding requested in B2023 isn’t received, staffing plans will need to be reviewed.
O&M Financial Situation
| 2023-24 O&M | 2022-23 | 2021-22 | |||||||||
|---|---|---|---|---|---|---|---|---|---|---|---|
| Division Name | Budget | Anticipatory Budget | Total Budget | IBP Forecast | Surplus/ (Deficit) | Anticipated B2023 Funding (Sunsetters) | Risk Management Within Sector | Revised Surplus/ (Deficit) | P10 Forecast | Actuals | |
| A | B | C=A+B | D | E=C-D | F | G | H=E+F+G | ||||
| General Operating | DMO | 90,736 | 1,300,992 | 1,391,728 | 54,850 | 1,336,878 | - | - | 1,336,878 | 118,698 | 26,406 |
| ERTC | 2,526,735 | 510,731 | 3,037,466 | 7,048,951 | (4,011,485) | 437,196 | 819,531 | (2,754,758) | 6,182,919 | 2,799,085 | |
| P&C | 4,996,774 | 1,960,474 | 6,957,248 | 7,328,568 | (371,320) | 971,000 | - | 599,680 | 5,700,198 | 4,261,121 | |
| SDDS | 1,134,722 | 937,500 | 2,072,222 | 3,410,742 | (1,338,520) | 585,000 | 716,321 | (37,199) | 2,316,000 | 2,734,378 | |
| Sub-Total - General Operating | 8,748,967 | 4,709,697 | 13,458,664 | 17,843,111 | (4,384,447) | 1,993,196 | 1,535,852 | (855,399) | 14,317,815 | 9,820,989 | |
| Other General Operating | PAY EQUITY | 8,790,782 | - | 8,790,782 | 1,191,976 | 7,598,806 | - | - | 7,598,806 | 148,938 | 60,470 |
| SETTLEMENTS | - | - | - | - | - | - | - | - | 20,550,000 | - | |
| Sub-Total - Other General Operating | 8,790,782 | - | 8,790,782 | 1,191,976 | 7,598,806 | - | - | 7,598,806 | 20,698,938 | 60,470 | |
| Grand Total - General Operating | 17,539,749 | 4,709,697 | 22,249,446 | 19,035,087 | 3,214,359 | 1,993,196 | 1,535,852 | 6,743,407 | 35,016,753 | 9,881,459 | |
| SPA | CHARTER CHALLENGE | 620,500 | - | 620,500 | 620,500 | - | - | - | - | 7,950 | - |
| HR TO PAY (B12P) | - | - | - | 6,051,285 | (6,051,285) | 5,235,912 | 1,338,427 | 523,054 | 5,844,443 | 2,989,692 | |
| Sub-Total - SPA | 620,500 | - | 620,500 | 6,671,785 | (6,051,285) | 5,235,912 | 1,338,427 | 523,054 | 5,852,393 | 2,989,692 | |
| VNR | PSSA | 4,335,000 | (64,000) | 4,271,000 | 4,271,000 | - | - | - | - | 3,673,378 | 3,676,321 |
| Total | 22,495,249 | 4,645,697 | 27,140,946 | 29,977,872 | (2,836,926) | 7,229,108 | 2,874,279 | 7,266,461 | 44,542,524 | 16,547,473 | |
- At IBP, OCHRO is forecasting an overall surplus of $6.7M in General Operating and a surplus of $0.5M in the SPAs, once risk management and funding requested in B2023 for Classification ($0.5M), CDI ($1.6M) and HR to Pay ($5.2M) have been included :
- General Operating: The surplus is due to the $7.6M surplus in Pay Equity under Other General Operating due to the delay of coming into force of the Pay Equity Act. A significant portion of this surplus will be used to acquire the Value of Work Assessment Tool. The program is awaiting a quote for the delivery and implementation of this tool to add it to its forecast.
- Charter Challenge: A breakeven is forecasted.
- HR to Pay: A surplus of $0.5M is forecasted due to the funding to be received from SSC. This surplus is offsetting the salary deficit.
- In comparison to the 2022-23 P10 forecast, OCHRO’s IBP forecast of $30M is $14.6M (33%) lower due to :
- A decrease in forecasted expenditures of $20.6M related to the Phoenix litigation and the UCCO settlement agreement, not reoccurring in 2023-24; offset by
- An increase of $0.6M for Charter Challenge mostly due to the engagement of a consultation panel;
- An increase of $0.6M for PSSA mostly due to increasing costs under other professional and special services relative to OCA (OSFI) MOU;
- ERTC: An increase of $1.9M due to an increase is workload mostly for Pay Equity, Strategic Compensation Management and Pension Policy & Programs;
- P&C: An increase of $1.6M due to new initiatives anticipated to be funded in 2023-24 via the Program Integrity funding; and
- SDDS: An increase of $1.3M due to new initiatives anticipated to be funded in 2023-24 via the Program Integrity funding and the ETMS MOU being included in the forecast while a budget transfer was done in 2022-23.
- See Annex D for the forecast by Reporting Object
Overview of Authorities Against Forecast
Slide to provide an overview of your past expenditures and currently anticipated future authorities to create an awareness of the multi-year financial situation for your sector.

Figure 23 - Text version
OCHRO’s authorities (in millions).
2022-23: OCHRO’s authorities total $112.9 millions and can be broken down as follows: $51.9 millions in A-Base funding, $30.8 millions in Sunsetting and Internal Reallocation, $19.4 millions in Vote Net Revenues, $10 millions in Special Purpose Allotment and $0.8 million in anticipated funding.
2023-24: OCHRO’s authorities total $113.4 millions and can be broken down as follows: $52.6 millions in A-Base funding, $12 millions in Sunsetting and Internal Reallocation, $1.7 millions in Vote Net Revenues, $10.8 millions in Special Purpose Allotment and $36.3 millions in anticipated funding.
2024-25: OCHRO’s authorities total $113.8 millions and can be broken down as follows: $52.6 millions in A-Base funding, $7.1 millions in Sunsetting and Internal Reallocation, $1.7 millions in Vote Net Revenues, $11 millions in Special Purpose Allotment and $41.4 millions in anticipated funding.
2025-26: OCHRO’s authorities total $101.9 millions and can be broken down as follows: $52.6 millions in A-Base funding, $0.1 million in Sunsetting and Internal Reallocation, $1.7 millions in Vote Net Revenues, $10.4 millions in Special Purpose Allotment and $37.1 millions in anticipated funding.
2026-27: OCHRO’s authorities total $91.5 millions and can be broken down as follows: $52.6 millions in A-Base funding, $0.1 million in Sunsetting and Internal Reallocation, $1.7 millions in Vote Net Revenues and $37 millions in anticipated funding.
2022-23: actuals expenditures represent $101.9 millions compared to a forecast of $114.2 millions in 2023-24.
- The 2022-23 forecast is based on the results of the P10 exercise and the 2023-24 forecast is based on the IBP Exercise. The $20.6M received in 2022-23 for litigations has been removed from the table above for comparison purposes.
- It should be noted that the anticipated funding for 2023-24 includes B2023 for sunsetters but excludes the additional reprofile for PA Mod, funding for the Global Strategy and the funding that could be received from the Departmental Reserve.
- Even though additional funding is anticipated for future years, it is expected that OCHRO will still have pressures and difficulties staying within its authorities since its mandate keeps growing but additional funding received is temporary and limited.
- Authorities are reducing in 2025-26 since Pay Equity is sunsetting and in 2026-27 since PSSA funding is sunsetting.
- Refer to Annex A for additional information on the authorities.
Financial Risks and Considerations
- The following risks have been identified and may have significant impacts on the forecast:
- General Operating deficit:
- Pay Equity did not include the purchase of the Value of Work Assessment Tool in its forecast. At IBP, the cost is still to be determined. Consequently, the current surplus in Pay Equity may not fully materialize in 2023-24.
- Planned staffing:
- Planned staffing is high at $24.2M. Slippage is expected and planned staffing should be reviewed carefully for the next forecasting exercise.
- Indeterminate employees:
- Some employees were hired on an indeterminate basis even though funding is temporary due to the highly specialized skill sets required. At IBP, indeterminate employees (including planned staffing) represent $87M, which is almost twice the amount it can afford with its current ongoing salary budget.
- OCHRO needs to establish mitigation strategies to ensure indeterminate employees are reassigned to other priorities or deployed to other teams/sectors once the funding has sunsetted or if the funding requests are not approved.
- B2023:
- If OCHRO does not receive the $22.9M in funding requested in B2023, activities will need to be reduced significantly.
- Reprofile:
- PA Modernization (Vote 10): The Reprofile of $593K from 2021-22 and $4.5M from 2022-23 to 2023-24 ($2.5M) and 2024-25 ($2.5M) was partially approved. The reprofile of $593K to 2023-24 was approved, but the request to Reprofile $4.5M was denied by Finance. ERTC in collaboration with CSS will be meeting with the Department of Finance to discuss the submission of another reprofile request for the portion of the reprofile that was denied.
- Attrition:
- OCHRO has $15.1M in attrition (with EBP). If turn-over and slippage do not materialize to the level anticipated, the salary deficit will increase. OCHRO’s financial situation will be monitored closely to ensure activities are reduced if attrition does not materialize to the level expected. However, based on prior trends, the risk is deemed low at this time.
- General Operating deficit:
Recommendation and Next Steps
Conclusion
- The financial situation for 2023-24 is high risk in light of the $22.9M requested in B2023 that has yet to be approved. If funding is received in full, the financial situation for OCHRO will be medium risk in light of the mitigation strategies to address the pressures, the surplus under Pay Equity and the significant planned staffing that can be reduced, if needed.
- Planned staffing of $24.2M is high and a large portion is for indeterminate hiring. Staffing actions should be more in lined with the source of funds. Planned staffing needs to be carefully managed to minimize salary deficits and ensure the salary forecast is sustainable for future years.
Recommendation:
- Approve OCHRO’s IBP forecast and attestation (see slide 2).
- Including the submission of the following pressures to obtain funding from the Departmental Reserve (slide 6):
- Command Centre ($150K)
- OCA Financial Analysis ($260K)
- Retendering ($730K)
- Collective Bargaining ($1.1M)
- Including the submission of the following pressures to obtain funding from the Departmental Reserve (slide 6):
Next steps:
- Results to be presented to EXCO in March 2023.
- Ensure staffing actions continue to have an identified source of funds.
- Continue working on TB Submission for Program Integrity and start working on CEAA for funding requests in B2023 in order to be able to access the funding quickly in 2023-24, if approved. Supplementary Estimates B should be targeted to reduce the likelihood of free balance issues.
- Action upcoming MOUs and other agreements for 2023-24.
- Sectors are required to consider Indigenous businesses in their planning and provide their proposed upcoming Indigenous procurement plans. Justification for not considering Indigenous firms is mandatory and will be closely reviewed for each new contracting request.
Annex A – Future Year Authorities
| Funding Type | 2023-24 | 2024-25 | 2025-26 | ||||||||||||
|---|---|---|---|---|---|---|---|---|---|---|---|---|---|---|---|
| Salary | G&S | Subtotal | EBP | Total | Salary | G&S | Subtotal | EBP | Total | Salary | G&S | Subtotal | EBP | Total | |
| A-Base | 34,708,458 | 8,531,968 | 43,240,426 | 9,371,284 | 52,611,709 | 34,708,458 | 8,531,967 | 43,240,425 | 9,371,284 | 52,611,708 | 34,708,458 | 8,531,967 | 43,240,425 | 9,371,284 | 52,611,708 |
| Sunsetting and Internal Reallocation | 2,352,633 | 9,007,782 | 11,360,415 | 635,211 | 11,995,625 | 1,938,161 | 4,608,534 | 6,546,695 | 523,303 | 7,069,998 | 111,000 | 1,000 | 112,000 | 29,970 | 141,970 |
| SPA | 850,000 | 620,500 | 1,470,500 | 229,500 | 1,700,000 | 850,000 | 620,500 | 1,470,500 | 229,500 | 1,700,000 | 850,000 | 620,500 | 1,470,500 | 229,500 | 1,700,000 |
| VNR | 5,074,086 | 4,335,000 | 9,409,086 | 1,370,003 | 10,779,089 | 5,074,086 | 4,554,000 | 9,628,086 | 1,370,003 | 10,998,089 | 5,074,086 | 3,932,000 | 9,006,086 | 1,370,003 | 10,376,089 |
| Total Approved Budget | 42,985,177 | 22,495,249 | 65,480,426 | 11,605,998 | 77,086,424 | 42,570,705 | 18,315,001 | 60,885,706 | 11,494,090 | 72,379,796 | 40,743,544 | 13,085,467 | 53,829,011 | 11,000,757 | 64,829,767 |
| Anticipated funding - Program Integrity | 5,235,092 | 4,058,289 | 9,293,381 | 1,413,475 | 10,706,856 | 5,207,445 | 4,050,458 | 9,257,903 | 1,406,010 | 10,663,913 | 5,207,445 | 5,116,951 | 10,324,396 | 1,406,010 | 11,730,406 |
| Anticipated Funding - B2023 | 12,337,414 | 7,229,108 | 19,566,522 | 3,331,102 | 22,897,624 | 12,337,414 | 7,452,731 | 19,790,145 | 3,331,102 | 23,121,247 | 12,337,414 | 7,484,395 | 19,821,809 | 3,331,102 | 23,152,911 |
| PA Modernization | 592,731 | 592,731 | 0 | 592,731 | 0 | 0 | 0 | 0 | 0 | 0 | |||||
| VNR Adjustments | (791,172) | (64,000) | (855,172) | (213,616) | (1,068,788) | 0 | 0 | 0 | 0 | 0 | 0 | ||||
| PE Reprofile | 0 | 0 | 0 | 717,686 | 4,347,060 | 5,064,745 | 193,775 | 5,258,520 | 0 | 0 | 0 | ||||
| MOUs | (150,000) | (150,000) | 0 | (150,000) | 0 | 0 | 0 | 0 | 0 | 0 | |||||
| Other | 2,444,586 | 208,677 | 2,653,263 | 660,038 | 3,313,301 | 1,768,973 | 149,741 | 1,918,714 | 477,623 | 2,396,337 | 1,720,627 | 5,499 | 1,726,126 | 464,569 | 2,190,695 |
| Grand Total | 62,211,098 | 34,370,054 | 96,581,152 | 16,796,996 | 113,378,148 | 62,602,223 | 34,314,990 | 96,917,213 | 16,902,600 | 113,819,813 | 60,009,030 | 25,692,312 | 85,701,342 | 16,202,438 | 101,903,780 |
Annex B – Detailed Breakdown – HR to Pay
| 2023-24 Overall Financial Situation (incl. EBP) | 2022-23 | 2021-22 | ||||||||
|---|---|---|---|---|---|---|---|---|---|---|
| Division Name | Budget | Anticipatory Budget | Total Budget | IBP Forecast | Surplus/ (Deficit) | Anticipated B2023 Funding (Sunsetters) | Risk Management Within Sector | Revised Surplus/ (Deficit) | P10 Forecast | Actuals |
| A | B | C=A+B | D | E=C-D | F | G | H=E+F+G | |||
| ERTC | - | - | - | 904,741 | (904,741) | 1,285,597 | - | 380,856 | 1,043,647 | 1,072,701 |
| SDDS | - | - | - | 16,468,605 | (16,468,605) | 14,633,511 | 1,835,095 | 0 | 15,224,134 | 14,051,265 |
| TOTAL - HR to Pay | - | - | - | 17,373,347 | (17,373,347) | 15,919,108 | 1,835,095 | 380,856 | 16,267,780 | 15,123,966 |
| 2023-24 Salary (incl. EBP) | 2022-23 | 2021-22 | ||||||||
|---|---|---|---|---|---|---|---|---|---|---|
| Division Name | Budget | Anticipatory Budget | Total Budget | IBP Forecast | Surplus/ (Deficit) | Anticipated B2023 Funding (Sunsetters) | Risk Management Within Sector | Revised Surplus/ (Deficit) | P10 Forecast | Actuals |
| A | B | C=A+B | D | E=C-D | F | G | H=E+F+G | |||
| ERTC | - | - | - | 904,741 | (904,741) | 1,221,185 | - | 316,444 | 1,043,582 | 1,069,619 |
| SDDS | - | - | - | 10,417,320 | (10,417,320) | 9,462,011 | 496,668 | (458,642) | 9,379,756 | 11,064,655 |
| TOTAL - HR to Pay | - | - | - | 11,322,062 | (11,322,062) | 10,683,196 | 496,668 | (142,198) | 10,423,337 | 12,134,274 |
| 2023-24 O&M | 2022-23 | 2021-22 | ||||||||
|---|---|---|---|---|---|---|---|---|---|---|
| Division Name | Budget | Anticipatory Budget | Total Budget | IBP Forecast | Surplus/ (Deficit) | Anticipated B2023 Funding (Sunsetters) | Risk Management Within Sector | Revised Surplus/ (Deficit) | P10 Forecast | Actuals |
| A | B | C=A+B | D | E=C-D | F | G | H=E+F+G | |||
| ERTC | - | - | - | - | - | 64,412 | - | 64,412 | 65 | 3,082 |
| SDDS | - | - | - | 6,051,285 | (6,051,285) | 5,171,500 | 1,338,427 | 458,642 | 5,844,378 | 2,986,610 |
| TOTAL - HR to Pay | - | - | - | 6,051,285 | (6,051,285) | 5,235,912 | 1,338,427 | 523,054 | 5,844,443 | 2,989,692 |
Annex C - Historical Growth

Figure 24 - Text version
2017-18: OCHRO had 424 FTEs on strength under the General Operating and 45 FTEs under the Special Purpose Allotment for a total of 469 FTEs.
2018-19: OCHRO had 410 FTEs on strength under the General Operating and 46 FTEs under the Special Purpose Allotment for a total of 465 FTEs. It represents a decrease of 1% compared to the prior fiscal year.
2019-20: OCHRO had 411 FTEs on strength under the General Operating and 102 FTEs under the Special Purpose Allotment for a total of 513 FTEs. It represents an increase of 10% compared to the prior fiscal year.
2020-21: OCHRO had 425 FTEs on strength under the General Operating and 90 FTEs under the Special Purpose Allotment for a total of 515 FTEs. It represents an increase of 0% compared to the prior fiscal year.
2021-22: OCHRO had 429 FTEs on strength under the General Operating and 136 FTEs under the Special Purpose Allotment for a total of 565 FTEs. It represents an increase of 10% compared to the prior fiscal year.
2022-23 P10: OCHRO plans to have 515 FTEs on strength under the General Operating and 95 FTEs under the Special Purpose Allotment for a total of 610 FTEs at March 31,2023. It represents an increase of 8% compared to the prior fiscal year.
2023-24: OCHRO plans to have 559 FTEs on strength under the General Operating and 112 FTEs under the Special Purpose Allotment for a total of 670 FTEs at March 31,2024. It represents an increase of 10% compared to the prior fiscal year.
- OCHRO has continued to experience steady growth in the number of FTEs over the past 5 fiscal years. From 2018-19 to 2023-24, 44% growth is forecasted. The number of FTEs has increased due to new initiatives such as: Diversity and Inclusion, Pay Equity, Mental Health and Wellness, future of work research and experimentation, data analytics, stewardship, integration and other government priorities.
- If all planned staffing materialize in 2023-24, the employees currently on strength (597 FTEs) will increase by 73 FTEs to reach 670 FTEs. Continued attention is required to ensure salary forecasts remain realistic and within OCHRO’s authorities.
Annex D – Gross O&M Forecast by Reporting Object

Figure 25 - Text version
Gross O&M forecast can be broken down as follows: Consulting & Research $13,398,921 (43%), Computer Services $230,361 (1%), Other Professional Services $9,489,752 (30%), Materials & Supplies $358,567 (1%), Rentals $373,387 (1%), Conferences $311,188 (1%), Hospitality $49,000 (0%), Other Payments $5,215,398 (17%), Other $161,575 (0%), Travel $637,470 (2%), Communications $228,784 (1%) and Training $997,111 (3%).
- OCHRO’s gross O&M forecast of $31.5M excludes $1.5M in anticipated recoveries from SSC for Next Gen (net forecast of $30M).
- 91% ($9.9M) of the gross O&M forecast is for Consultants & Other Professional Services.
- $1M is forecasted for Travel, Hospitality and Conferences.
Annex E - Sector Financial Forecast
| 2024 | |||||||
|---|---|---|---|---|---|---|---|
| Budget | Anticipated Transfers | Annual Plan | Actuals | Commitments | Free Balance | Surplus/Deficit | |
| FTE (FTE) | 411.25 | 670.34 | 411.25 | 259.09 | |||
| F1 FTE EMPLOYEE (F1) | 411.25 | 599.33 | 411.25 | 188.08 | |||
| F2 FTE PLANNED (F2) | 205.09 | 205.09 | |||||
| F3 FTE ADJUSTMENT (F3) | 14.72 | 14.72 | |||||
| F4 FTE ATTRITION (F4) | 119.36 | 119.36 | |||||
| PERSONNEL COSTS (101) | 42,985,177.00 | 6,888,506.42 | 63,179,418.91 | 42,985,177.00 | 13,305,735.49 | ||
| 01 EMPLOYEE SALARIES (01) | 61,221,991.05 | 61,221,991.05 | |||||
| 112 STUDENT ALLOTMENT (112) | 12,597.15 | 12,597.15 | |||||
| 62 CASUAL BASIC PAY (62) | 54,886.88 | 54,886.88 | |||||
| 66 OTHER PERSONNEL COSTS (66) | 10,486.31 | 10,486.31 | |||||
| 70 PLANNED SALARIES (70) | 19,073,210.18 | 19,073,210.18 | |||||
| 71 GLOBAL SALARIES (71) | 206,121.00 | 206,121.00 | |||||
| 73 EMPLOYEE SALARY ADJUSTMENTS (73) | 2,362,554.76 | 2,362,554.76 | |||||
| A1 ATTRITION (A1) | 11,900,574.80 | 11,900,574.80 | |||||
| R1 RISK MGMT - SALARIES (R1) | 3,136,744.10 | 3,136,744.10 | |||||
| X1 SALARIES ANTIC TRANSFER INT (X1) | - | - | |||||
| X2 SALARIES ANTIC TRANSFER EXT (X2) | 130,989.27 | 130,989.27 | |||||
| X5 PLAN SAL TRS OGD (X5) | 6,757,517.15 | 6,757,517.15 | |||||
| Employee Benefits Plan (EBP) | 11,605,997.79 | 1,859,896.73 | 17,058,443.11 | 11,605,997.79 | 3,592,548.58 | ||
| Personnel Costs (101) with EBP (101-E) | 54,591,174.79 | 8,748,403.15 | 80,237,862.02 | 54,591,174.79 | 16,898,284.07 | ||
| GOODS AND SERVICES (102) | 22,495,249.00 | 4,645,697.00 | 27,103,593.00 | 15,863,407.15 | 6,631,841.85 | 37,353.00 | |
| 02 TRAVEL (02) | 637,470.00 | 658,350.00 | 658,350.00 | 637,470.00 | |||
| 03 POSTAGE, FREIGHT & EXPRESS (03) | 3,850.00 | 3,850.00 | |||||
| 04 RELOCATION (04) | 75,000.00 | 75,000.00 | |||||
| 06 OTHER COMMUNICATIONS (06) | 228,784.00 | 200,000.00 | 200,000.00 | 228,784.00 | |||
| 08 PUBLISHING AND PRINTING (08) | 2,825.00 | 2,825.00 | |||||
| 10 TRAINING (10) | 997,111.00 | 997,111.00 | |||||
| 11 CONSULTING AND RESEARCH (11) | 13,398,921.00 | 12,892,704.04 | - 12,892,704.04 | 13,398,921.00 | |||
| 12 COMPUTER SERVICES (12) | 230,361.00 | 230,361.00 | |||||
| 13 TEMPORARY HELP SERVICES (13) | 70,000.00 | 70,000.00 | |||||
| 14 OTHER PROF AND SPECIAL SERVICE (14) | 9,489,752.00 | 409,534.29 | 409,534.29 | 9,489,752.00 | |||
| 15 RENTALS (15) | 373,387.00 | 373,387.00 | |||||
| 18 PRINTED MATTER (18) | 7,900.00 | 7,900.00 | |||||
| 19 MATERIALS AND SUPPLIES (19) | 358,567.00 | 93,048.82 | 93,048.82 | 358,567.00 | |||
| 21 HOSPITALITY (21) | 49,000.00 | 49,000.00 | |||||
| 22 CONFERENCES (22) | 311,188.00 | 311,188.00 | |||||
| 31 OTHER SUBSIDIES AND PAYMENTS (31) | 5,215,398.00 | 1,609,770.00 | 1,609,770.00 | 5,215,398.00 | |||
| 36 INCENTIVE AWARDS (36) | 2,000.00 | 2,000.00 | |||||
| 38 PLAN G&S RECOV OGD (38) | 1,473,642.00 | 1,473,642.00 | |||||
| R2 RISK MGMT - G & S (R2) | 2,874,279.00 | 2,874,279.00 | |||||
| X4 G&S ANTIC TRANSFER EXT (X4) | 144,677.00 | 144,677.00 | |||||
| X6 PLAN G&S TRS OGD (X6) | 4,501,020.00 | 4,501,020.00 | |||||
| SUBTOTAL without EBP | 65,480,426.00 | 11,534,203.42 | 90,283,011.91 | 15,863,407.15 | 49,617,018.85 | 13,268,382.49 | |
| Total with EBP | 77,086,423.79 | 13,394,100.15 | 107,341,455.02 | - | 15,863,407.15 | 61,223,016.64 | 16,860,931.07 |
| Anticipated B2023 Funding (Sunsetters) | 22,897,623.84 | ||||||
| Revised Surplus/Deficit | 6,036,692.77 | ||||||
OCHRO Integrated Business Plan Placemat
Modernizing People Management in the Public Service – a sequenced and prioritized change management approach for 2023-24
The Big Renovation (3+ years)
Key Assumptions for Success
- Future of Work Integrated strategies and Policy Framework established
- Pay remains stable and backlog is minimized
- HR function and service delivery models are endorsed
- Data and evidence gathered to support and drive disruptive change
- Bargaining environment and other external factors are more stable
The Building Blocks (3 years)
Key Operating Assumptions
- Minimal disruption to Public Service environment
- Maintain distributed HR accountabilities
- Mindful of public service change resilience (at all levels)
- Navigate complex bargaining environment (i.e., inflation, hybrid work)
- Upcoming funding decisions required (i.e., CDI, HR-to-Pay-Pension, Classification)
- Alignment to HR data model and strategy
- Overall risk assessment and environmental scan taken into account (public health, labour unrest)
- Maintaining Public Trust
- Sufficient resources
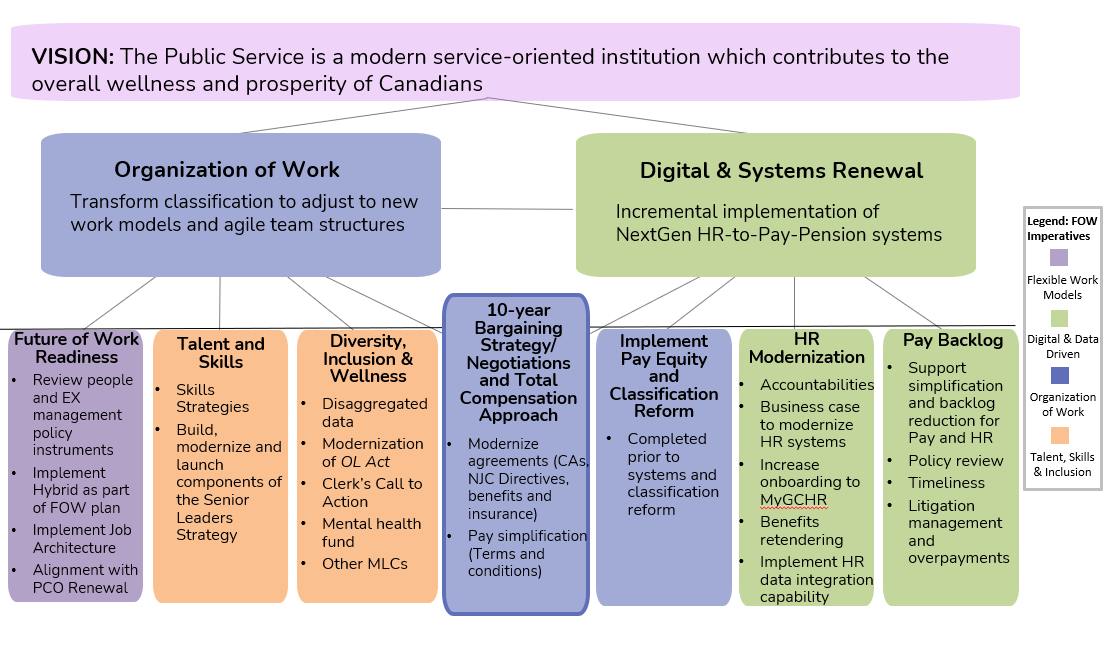
Figure 26 - Text version
VISION: The Public Service is a modern service-oriented institution which contributes to the overall wellness and prosperity of Canadians
To achieve this vision, seven building blocks have been identified, sequenced and prioritized (Future of Work; Talent and Skills; Diversity, Inclusion and Wellness; 10-year Bargaining Strategy; Pay Equity and Classification Reform; HR Modernization; Pay Backlog). Initiatives classified as building blocks are short-term and support the big renovation pieces (Organization of Work; Digital and Systems Renewal).
In addition to priorities, OCHRO is responsible for numerous legislative/statutory obligations:
- Bargain in good faith with Canada’s public sector unions
- Improve the sustainability of public sector pension and benefits plans and their responsiveness to Future of Work trends
- Lead the negotiation of the Pay Equity in the core public administration and members of the RCMP
- Continue to support to organizations on Canada Labour Code requirements, and respond to potential regulatory changes
- Labour relations and total compensation
Proposed 2023-2024 OCHRO Integrated Business Plan
Objectives
- Provide context on the Integrated Business Plan (IBP) and its purpose
- Provide context on the framing of OCHRO’s business priorities
- Share OCHRO’s business and management priorities
- Next Steps to finalize Part 1 of the IBP
Context – Integrated business planning
The Integrated Business Plan (IBP) is a yearly exercise led by TBS’ Corporate Services (CSS), and is comprised of 2 parts:
- Part 1: Business Planning, outlines the sector’s key business and management priorities, associated risks and key positions for succession planning
- CSS delegated Part 1 to Strategic Directions and Digital Solutions (SDDS), who then worked with OCHRO sectors to complete their respective template
- Part 2: Financial Planning, is a financial forecast tool for 2023-24. Sectors provide budget information, FTE affordability and prior year information (already approved)
- The Deputy Minister’s Office led Part 2 and worked with OCHRO sectors to complete the templates
The IBP is not reported publicly and is used to align both TBS and OCHRO priorities with their respective human and financial resource requirements
For OCHRO, the IBP is also used to forecast each sectors’ expenses for the upcoming fiscal year (FY) and set each sector’s annual budget allocation
2022-23 IBP – Framing of OCHRO’s business priorities
As part of last year’s IBP process, OCHRO integrated each sector’s business priorities by aligning them to the Future of Work (FOW) imperatives
People management
Inclusive
Talent, Skills, & Inclusion
The Public Service is skilled, diverse, inclusive, accessible, and human-centric
Agile
Flexible Work Models
A distributed, flexible, productive workforce and welcoming workplace
Equipped
Organization of Work
The Public Service classifies and compensates work to facilitate agility and drive employer competitiveness in response to the changing nature of work
Digital & Data Driven
The Public Service is digitally enabled, and leverages HR systems and data to support strategic decision-making
Culture, Change Management, Mindsets & Behaviours
A Public Service that embodies the future of work vision
2023-24 IBP – Framing of OCHRO’s business priorities
Leveraging the FOW imperatives, this year’s IBP establishes near-term priorities by mapping OCHRO's business priorities to the "building blocks" that will enable the long-term modernization of PS people management

Figure 27 - Text version
VISION: The Public Service is a modern service-oriented institution which contributes to the overall wellness and prosperity of Canadians
To achieve this vision, key initiative have been identified, sequenced and prioritized. These initiatives are broken down into “building blocks” (Future of Work; Talent and Skills; Diversity, Inclusion and Wellness; 10-year Bargaining Strategy; Pay Equity and Classification Reform; HR Modernization; Pay Backlog) or “big renovation pieces” (Organization of Work; Digital and Systems Renewal). Initiatives classified as building blocks are short-term (deliverable within the next 3 years) and support the big renovation pieces, which won’t begin for a minimum of three years.
2023-24 IBP – The process
SDDS hosted workshops with sectors to identify their key priorities for 2023-24, using the 7 building blocks visual to connect priorities to OCHRO's vision for modernizing people management in the Public Service
Sectors identified 91 ED-approved business priorities, down from 105 in 2022-23. SDDS then further streamlined the number of priorities to 62, which included OCHRO’s Mandate Letter Commitments:
- 10 priorities for ERTC
- 36 priorities of P&C
- 16 priorities for SDDS
ADMs were engaged on the remaining 62 business priorities at the January 12th, 2023, EMC meeting. They were tasked with reviewing their respective sector’s remaining priorities and to each identify their top 5 business priorities for the 2023-24 FY.
2023-24 IBP – ERTC priorities
Business Priorities
- Support Deputy Heads in preventing harassment and violence and racism in public service workplaces
- Bargain in good faith with Canada’s public sector unions
- Lead the implementation of the Pay Equity Act for employees in the core public administration and members of the RCMP
- Provide Deputy Heads, and other partners (insurers, CoPs, PSPC, PSPIB) direction, guidance, and interpretive support to ensure the effective delivery of the ERTC mandate (e.g., classification, compensation policies, NJC support, pension, benefit and pay administration)
- Delivery of statutory obligations
Management Priorities
- Promote good people management practices: support a psychologically healthy workplace that respects individual differences that implements activities in support of a diverse workplace in a hybrid work context
- Maintain strategic capacity: Ensuring an equipped EX and management cadre
- Financial and HR Sustainability: Reinvigoration and alignment of resources
2023-24 IBP – P&C prioritiesFootnote 5
Business Priorities
- Support Future of Work Readiness by reviewing and adapting policy instruments on people and executive management
- Build, modernize and launch components of the Senior Leaders Strategy relating to compensation, classification, performance and talent management
- Support departments in implementing the Clerk’s Call for Action
- Implement legislative and regulatory measures derived from the modernization of the Official Languages Act
- Support the data strategy and efforts to develop, test and implement new HR systems
Management Priorities
- Continue to seek employee feedback to improve the hybrid work experience across P&C, and to assess workloads and align the organization of work and resources accordingly
- Develop a sound HR plan, staffing strategy and succession plan, and work closely with HRD to improve staffing processes and timelines
- Implement best practices and apply innovation to improve the hybrid work experience
- Ensure all employees follow at least one learning activity related to Indigenous knowledge, Equity, Diversity and Inclusion, and encourage employee participation in departmental and interdepartmental employee networks
2023-24 IBP – SDDS priorities
Business Priorities
- Support the simplification of HR-Pay business processes, and backlog reduction (includes work with Public Services and Procurement Canada)
- Implement Hybrid work, and the Future of Work Strategy (including Skills Strategy)
- Implement the People Management Data Model
- Support efforts to increase onboarding of departments and agencies to MyGCHR
- Establish a business case to modernize Human Resources (includes work with Shared Services Canada)
Management Priorities
- Work with CSS to realign human resources and financial structures to establish the newly merged sector back-office function
- Build cohesiveness through sustained sectoral engagement and through networking, wellness, developmental, information sharing and other team-building initiatives with guidance and leadership of sector champions
- Contribute to NextGen (including SSC MoU), Program Integrity, and HR-to-Pay TB Submissions to secure additional funding (i.e., both ongoing a-base and temporary b-base funding)
- Conduct a sector efficiency review with a view to building a strategic staffing/talent management plan that will fill resource capability/capacity gaps in priority areas
2023-24 IBP – Next steps
- Following your approval of Part 1 of OCHRO’s 2023-24 IBP (requested from CSS by February 13th, 2023), OCHRO’s 2023-24 IBP (Parts 1 & 2) will be presented at:
- The Investment and Human Resources Committee in February 2023
- The Executive Committee (EXCO) in March 2023
- SDDS is also developing a second deck relating to Part 1 of OCHRO’s 2023-24 IBP. This second deck, meant for an audience internal to OCHRO, will provide more details on the business and management priorities identified by OCHRO ADMs
- You should expect to receive this deck, for your information and approval in March 2023
Page details
- Date modified: