
Meeting between Patrick Borbey, PSC President, and Terence Hubbard, interim President of the Impact Assessment Agency of Canada
*Information valid as of January 2022
Introduction
Deputy Head
Terence (Terry) Hubbard was appointed as interim President of the Impact Assessment Agency of Canada (IAAC) on November 28, 2021, for a term of eight months or until such time as a new President is appointed, whichever occurs first.
Mr. Hubbard is exercising the Public Service Commission’s (PSC) authority for the first time as Deputy Head (DH). A copy of the New Direction in Staffing (NDS) highlights for DHs is attached as Annex A.
Organizational Context
Mandate
On August 28, 2019, the Impact Assessment Act, the Canadian Energy Regulator Act, and the Canadian Navigable Waters Act came into force. The Impact Assessment Act created the new IAAC (formerly known as the Canadian Environmental Assessment Agency (CEAA)). This change repeals the Canadian Environmental Assessment Act, created in 2012.
The IAAC is a federal body accountable to the Minister of Environment and Climate Change.
The IAAC delivers high-quality impact assessments that contribute to informed decision-making on major environmental projects, in support of sustainable development. Through its delivery of impact assessments, the IAAC serves Canadians by looking at both positive and negative environmental, economic, social and health impacts of potential projects of federal interest. More specifically, the IAAC:
- Leads and manages the impact assessment process for all federally designated major projects.
- Leads Crown engagement and serves as the single point of contact for consultation and engagement with Indigenous peoples during impact assessments for designated projects.
- Provides opportunities and funding to support public participation in impact assessments.
- Works to ensure that mitigation measures are applied and are working as intended.
- Promotes uniformity and coordination of impact assessment practices across Canada through research, guidance and ongoing discussion with stakeholders and partners.
- Works with a range of international jurisdictions and organizations to exchange best practices in terms of impact assessment.
The IAAC works with other bodies like the Canadian Energy Regulator (formerly the National Energy Board), the Canadian Nuclear Safety Commission, Offshore Boards and other federal departments and agencies. The IAAC also works in cooperation with provinces and territories, Indigenous jurisdictions, environmental organizations, and industry.
Challenges
Ensuring steady growth of the organization because of legislative changes in support of new impact assessment and regulatory processes will be a challenge due to the current scarcity of competent labor market talent and resources on the issue of climate change impact assessment.
Experimentation
The operational staffing team is comprised of several new human resources advisors. As such, the PSC has produced various presentations on staffing and recruitment-related topics during this past year (2021-22). The information sessions generally related to employment equity, diversity and inclusion and assessment.
Population and Staffing Activities
Population
The IAAC is a small organization that has a population of 459 employees (as of March 31, 2021). In the 2020-2021 fiscal year, it performed 242 staffing actions.
Please refer to Annex B for additional details.
Staffing Activities
In 2020-2021, the IAAC processed a total of 242 staffing actions:
- 101 appointments to the public service (including casual workers and students):
- 39 casuals workers
- 16 students
- 54 promotions
- 30 acting appointments
- 57 lateral and downward movements
Please refer to Annex B for additional details on staffing activities.
Time to Staff
There are insufficient data to provide time to staff results for internal or external staffing processes at the IAAC.
Staffing Framework
New Direction in Staffing Implementation
The IAAC has implemented the mandatory staffing framework and provided a copy to the PSC. This organization has an appointment process policy that covers the use of advertised and non-advertised appointment processes, the articulation of the selection decision, and an area of selection section. This policy came into effect on April 13, 2016.
PSC Policy Division revised the IAAC sub delegation instrument, and the latest version of the instrument was approved in May 2016.
Appointment Delegation and Accountability Instrument Annex D Reporting
Use of the Public Service Official Languages Exclusion Approval Order (PSOLEAO) and the Public Service Official Languages Appointment Regulations (PSOLAR)
- In 2020-2021, the department reported 2 exclusions under the Public Service Official Languages Exclusion Approval Order and Public Service Official Languages Appointment Regulations.
- The department also reported one exclusion that was extended over the initial two-year period to become bilingual. The PSC found it to be compliant.
Approved Deputy Head Exceptions to the National Area of Selection (NAOS) Requirements for an External Advertised Appointment Process
The IAAC reported that no exception to the NAOS were made to the DH for 2019-2020 & 2020-2021.
Results of Organizational Cyclical Assessment
The IAAC submitted its first cyclical evaluation in July 2020.
Inquiries and Trends
The IAAC human resources advisors have consulted the PSC on a variety of topics, mostly regarding assessment, the Appointment Delegation and Accountability Instrument (ADAI) and the Appointment Policy. The IAAC has demonstrated openness and willingness to share their tools with other organizations. Other topics of discussion between the IAAC and the SSA involved the articulation of the selection decision, the hiring of former students, reassessing official languages within the same appointment process and questions surrounding sub-delegated authorities and its conditions.
Oversight
Audits
Since the coming into force of the New Direction in Staffing in 2016, the IAAC has not been included in any PSC audit.
The PSC is currently planning the next System-Wide Staffing Audit and a new Audit of Employment Equity Representation in Acting Appointments. Decisions regarding participating organizations will be made in early 2022-2023.
Investigations
No recent staffing investigations have been conducted by the PSC for the IAAC.
The IAAC does not have any members partaking in the PSC’s Investigators Community of Practice. However, should employees with investigative functions wish to join the PSC Federal Government Investigators Community, we invite them to communicate with Valerie Cannavino, Director of the Quality Assurance Division of the Investigations Directorate, by email at valerie.cannavino@cfp-psc.gc.ca. As members, they have a unique opportunity to be part of a professional community of federal public servants working in the investigations field. This community would allow them to develop new partnerships, enhance their skills and share innovative practices.
Staffing and Non-Partisanship Survey Results
Overall, the IAAC’s 2018 Staffing and Non-Partisanship Survey (SNPS) results are generally more favourable in comparison to other small organizations and the public service overall. Another SNPS has been conducted in 2021 but the results have not yet been published.
Please note that the survey was administered under the previous organisation’s name which was the CEAA (Canadian Environmental Assessment Agency). Below are some of the key findings of the SNPS results:
- 84.0% of employees agreed that people hired can do the job, compared to 67.1% in organizations of similar size, and 53.8% in the federal public service
- 81.7% of managers agreed that the New Direction in Staffing has improved the way they hire and appoint persons to and within their organization, compared to 69.7% in organizations of similar size, and 56.1% in the federal public service
- 79.0% of managers agreed that within their organization, the administrative process to staff a position is burdensome, compared to 79.3% in organizations of similar size, and 87.9% in the federal public service.
Diversity Profile
| Designated Group | Public ServiceWork Force Availability (WFA) | IAAC As of March 31, 2020 | IAAC As of March 31, 2019 | IAACAs of March 31, 2019 Representation across the Public Service of Canada |
|---|---|---|---|---|
| Women | 52.7% | 67.1% | 64.7% | 54.8% |
| Indigenous peoples | 4.0% | 5.9% | 5.4% | 5.1% |
| Persons with Disabilities | 9.0% | 3.6% | 2.4% | 5.2% |
| Members of Visible Minorities | 15.3% | 13.6% | 10.5% | 16.7% |
* Source:
Employment Equity in the Public Service of Canada 2019-2020, Treasury Board of Canada Secretariat
Employment Equity in the Public Service of Canada 2018-2019, Treasury Board of Canada Secretariat
Analysis:
The IAAC representation for women (67.1%) and Indigenous peoples (5.9%) are above WFA.
- The IAAC is below workforce availability for:
- Persons with disabilities, who represent 3.6% of its workforce, while the WFA is 9.0%.
- Members of visible minorities, who represent 13.6% of its workforce, while the WFA is 15.3%.
- The organization should take action to close the gap for persons with disabilities and members of visible minorities and continue to make merit-based appointments of members of the designated groups to ensure ongoing representativeness of its workforce.
Strategic Staffing Solutions:
The following array of solutions may be useful as the Department continues to build a representative and diverse organization:
- The Public Service Employment Act includes provisions that enable managers to:
- Target designated group members through the area of selection for advertised appointment processes.
- Establish and apply an organizational need to appoint designated group members.
- Use external and internal non-advertised appointment to appoint designated group members.
- The PSC offers recruitment solutions that target designated group members:
- Request referrals of designated group members when using student programs such as the Federal Student Work Experience Program (FSWEP) and Post-Secondary Co-op and Internship Program (COOP), with a plan that could include eventually recruiting students into the public service.
- Advertising through the student program Research Affiliate Program (RAP) to recruit students of designated group members.
- Request referrals of designated group members when using certain inventories, such as Post-Secondary Recruitment (PSR).
In its Call to Action, the Clerk of the Privy Council asked senior leaders to commit to making measurable change to the diversity and inclusiveness of the public service which includes the creation of staffing plans to close representation gaps for employment equity groups.
In February 2021, staffing targets for the hiring of persons with disabilities were sent by the PSC to IAAC. The 2018-2019 data highlighted the gap in representation of persons with disabilities (PWD) at the IAAC and the estimated level of recruitment required to close this gap within the next five years, taking into consideration factors such as attrition.
- Representation of PWD: 3.6%
- WFA for PWD: 9%
- Gap between WFA and representation: 5.4%
- Closing the gap: PWD population increase required to reach WFA over 5 years: 18
- Closing the gap: Recruitment of PWD required to achieve population increase over 5 years (estimate): 32
Priority Entitlements and Veterans
Appointments of Persons with a Priority Entitlement
From April 1, 2021 to December 31, 2021 the IAAC did not appoint any persons with a priority entitlement (PPE) indeterminately. One person with a priority entitlement was appointed in the previous fiscal year 2020/2021.
Appointments of Persons with a Canadian Armed Forces (CAF) Priority Entitlement
Since the coming into force of the Veterans Hiring Act on July 1, 2015 until December 31, 2021, the IAAC has not made any appointments of persons with a CAF Priority Entitlement.
Priority Clearance Requests
From April 1, 2020 to December 31, 2021, the IAAC submitted 224 priority clearance requests.
| Priority Clearance Type | Amount | Percentage |
|---|---|---|
Internal advertised processes
|
41 | 18% |
| Internal non-advertised processes | 89 | 40% |
External advertised processes
|
33 | 15% |
| External non-advertised processes | 47 | 21% |
| Appointment of persons with a priority entitlement (includes term and indeterminate appointments) | 0 | 0% |
| Student bridging | 11 | 5% |
| Section 43 | 3 | 1% |
| Total | 224 | 100% |
Source: Priority Information Management System
COVID-19 Related Priority Clearance Requests
Since the Priority Entitlements Policy Division began monitoring priority entitlement clearances related to Covid-19, the IAAC has not submitted any requests of this nature to the PSC.
Persons with a Priority Entitlement
As of December 31, 2021, the IAAC has 4 active persons with a priority entitlement in the Priority Information Management System.
Non-Partisanship in the Public Service
- In accordance with the Public Service Employment Act (PSEA), deputy heads may not engage in any political activity other than voting in an election.
- Public servants are required to obtain permission from the PSC prior to seeking nomination as a candidate in an election at the federal, provincial/territorial, or municipal level. Timely treatment of candidacy files is recommended.
- Our records indicate that no employee of the IAAC has requested permission to seek candidacy.
- General information sessions for employees on political activities and non-partisanship are available upon request.
- Each organization subject to the PSEA has a designated political activities representative (DPAR) who is an employee of that organization. The DPAR acts as a liaison with the PSC on matters related to political activities and non-partisanship and facilitates the timely treatment of candidacy requests. The DPAR at the Impact Assessment Agency of Canada is Stéphanie Charron.
Recruitment Programs
Federal Internship Program for Canadians with Disabilities
- The Federal Internship Program for Canadians with Disabilities is a great initiative to contribute to the Government of Canada’s Accessibility Strategy which aims to increase the economic inclusion of 125 persons with disabilities who have limited work experience, by developing key skills for future employment.
- The program provides managers and interns with career coaching services and tools to support the interns’ development such as recommended training offered by the Canada School of Public Service.
- The first cohort of the program resulted in 20 interns hired by eight organizations. In collaboration with 28 organizations, the program has surpassed the objective of hiring 30 interns by almost doubling the number of hires (55) for Cohort 2.
- The IAAC did not participate in Cohort 1 but participated in Cohort 2. Two interns were hired for a two-year internship in the National Capital Region at the AS-01 group and level starting in Spring 2021.
- The program has launched Cohorts 3 & 4 simultaneously earlier this Fall and is looking to partner with federal organizations to offer 25 internships for Cohort 3 (Spring 2022) and 25 internships for Cohort 4 (Autumn 2022).
- FIPCD is currently reviewing internship submissions received from organizations to determine which internships will be selected for the program. Organizations had until January 7, 2022 to submit their internship proposals.
- We anticipate providing organizations with an update on the status of their submissions towards the end of February 2022.
Employment Opportunity for Students with Disabilities / Indigenous Student Employment Opportunity
- There are two targeted programs under FSWEP which can be accessed by hiring managers to increase diversity in the workplace:
- Indigenous Student Employment Opportunity (ISEO)
- Employment Opportunity for Students with Disabilities (EOSD)
- The EOSD and ISEO initiatives are great initiatives aimed at reducing barriers to allow the full participation of students in the workplace, and by improving the workplace experience for students.
- Managers and students are provided with resources such as onboarding tools, training, and networking events such as mentoring and meet & greets.
- The National Indigenous Student Circle is a networking initiative for Indigenous students that supports retention and ongoing recruitment into the federal public service. A podcast on self-declaration is being developed and future topics for discussion include second language assessment and interview tips.
- IAAC submitted 9 requests for referrals for Students with Disabilities and 8 for Indigenous Students through FSWEP between April 30, 2020, and September 30, 2021.
- Candidates are available year-round through the FSWEP ongoing inventory.
- Number of available students in EOSD: 4,811Footnote 1
- Number of available students in ISEO: 2,204Footnote 2
Federal Student Work Experience Program
- FSWEP is the largest student employment program, which provides opportunities for students at all levels and in all programs of study to gain experience in the federal public service. It serves as a great program to help renew the workforce and bring new energy, ideas, and approaches to the workplace.
- IAAC has submitted 26 requests for referrals through FSWEP between April 30, 2020 and September 30, 2021.
- Moreover, IAAC hired 38 students through the FSWEP program in the last 4 years.
- The number of currently available students in this program is 78,598.Footnote 3
- The requests for student referrals in FSWEP have seen a significant increase (71%) since March 2021.
- Although encouraging for 2021, hiring volumes are still lower than 2019. The PSC will continue to monitor the number of hires closely system wide as we maintain our collective commitment to student hiring.
- Where we have been able to break down the EE profile of student hiring data, we have seen an increase in the percentage of hires for all EE groups since 2019.
Post-Secondary Recruitment
- The 2021 Post-Secondary Recruitment Campaign was launched on October 28, 2021 and features two new inventories that will be available to all departments:
- Business, Project Management and Government Programs which will respond to a wide range of program needs across the government.
- Programs and services to Canadians – Officer Level (PM-01 targeted PWD). In partnership with ESDC, this initiative is expected to support all departments that provide services directly to Canadians.
- The pools of partially assessed candidates will be available in the spring.
- In the interim, we still have many candidates ready to be hired into the public service in a variety of fields. These inventories and pools have been updated. Candidates are encouraged to self-declare in all our talent products.
- Policy candidates can also be recruited from these inventories:
- The Recruitment of Policy Leaders (RPL) pool features candidates qualified for EC-05 to EC-07 positions or equivalent.
- The Emerging Talent Pool (ETP) features candidates qualified for EC-04 positions or equivalent.
PSC/HRC Working Group – Hiring of Persons with Disabilities:
- The Human Resources Council (HRC) and the Public Service Commission of Canada (PSC) created a co-chaired working group last year, comprised of Heads of HR, or their delegates, and representatives from the PSC, to establish government-wide inventories to support departments and agencies in the hiring of PwD.
- The working group includes active participation from the Office of Public Service Accessibility (OPSA), the National Managers’ Community (NMC), and the Canadian Council on Rehabilitation and Work (CCRW).
- Since the inception, three inventories for persons with disabilities were launched in the fields of Data and Policy analysts positions in the Economics and Social Sciences Services (EC) groups, Digital Technology for positions in the Information Technology (IT) groups and financial management (FI).
- The inventories have been successful in attracting applicants with disabilities since its launch. As candidates are screened in, the respective functional community completes further assessment(s).
- Candidates from these inventories started to be referred to organizations in November 2021. Organizations are encouraged to reach out to the PSC to discuss how they can benefit and contribute to the success of these initiatives.
- An additional inventory is being planned in the sciences field in collaboration with the science community.
- The working group is also working on a strategy to establish a centralized repository of assessed candidates with disabilities from external advertised departmental pools with the objective of offering candidates additional opportunities to be considered without having to reapply and thus providing departments and agencies with a quick and efficient staffing option.
- As new inventories become available, the PSC and HRC will communicate with the HR and hiring manager communities. We will be counting on your organization's support to ensure the success of these initiatives, including promoting them and encouraging their use within your organizations.
Participation in Initiatives Related to the Hiring of Indigenous Peoples
- The Indigenous Career Pathways (ICP) is an Inventory of Indigenous student Applicants.
- Although IAAC has not collaborated with the PSC on specific initiatives, the Indigenous Career Pathway (ICP) is an initiative that may be of interest for the hiring of Indigenous People.
- Indigenous Career Pathways (ICP) provides managers and human resources specialists with expertise and support in Indigenous recruitment including the following tools:
- Inventory of Indigenous applicants
- 12 graduates currently availableFootnote 4with previous student experience within Government of Canada
- 9 pre-qualified candidates in various pools are currently availableFootnote 4 at various groups and levels such as AS-03, PM-03, EC-04 and EC-08
- Indigenous Recruitment Toolkit
- The toolkit is an evergreen guidance document for managers and human resources (HR) advisors, providing a repository of tools, resources, and advice on indigenous recruitment.
- The toolkit is currently being updated because of compiled lessons learned, and feedback received from managers and HR advisors through a survey. The update, which will be ready in late winter, will include new resources and good practices on outreach activities, and interview administration.
More information on Indigenous recruitment programs is available on the Indigenous recruitment–Information for hiring managers.
Staffing Support
Public Service Commission Representatives and Organizational Contacts
The Staffing Support Advisor (SSA) assigned to this organization is Caroline Fortin-Beaudry, the primary organizational contact is Julie Boyle, Team Leader and the Head of HR is Joelle Raffoul, Director General of Human Resources.
PREPARED BY:
Caroline Fortin-Beaudry
Staffing Support Advisor
APPROVED BY:
Lynn Brault
Director General, Staffing Support, Priorities and Political Activities Directorate,
Policy and Communications Sector
Gaveen Cadotte
Vice-President, Policy and Communications Sector
Annexes:
Annex A – The New Direction in Staffing (NDS) highlights for DHs
Annex B - Data on Population and Staffing Activities
Annex A
Highlights for deputy heads
A New Direction in Staffing – A Merit-Based System That is Effective, Efficient and Fair
Appointment Policy
New focus on core requirements to provide sub-delegated persons with greater discretion in making an appointment
- One Appointment Policy, no duplication of legal requirements
- Broader focus on values-based system, away from rules-based system
- Appointment Policy supported by streamlined guidance:
- A roadmap to the legislative, regulatory and policy requirements
- Options and considerations for decision making where there is discretion
- Clear expectations for priority entitlements
- No restrictions on assessment methods for EX appointments
- Exceptions to National Area of Selection approved by deputy head
Delegation
- New ability to customize organizational staffing system based on unique context and evolving business needs
- Deputy heads establish a direction on the use of advertised and non-advertised appointment processes
- Deputy heads to establish requirement(s) for sub-delegated persons to articulate, in writing, their selection decision
- Clarity on requirements related to investigations
- Attestation form to reinforce the accountabilities of sub-delegated persons
All PSC monitoring and reporting requirements now found in the Appointment Delegation and Accountability Instrument
Monitoring and Reporting
Monitoring built by organizations, targeted to their needs
- Annual Departmental Staffing Accountability Report no longer required
- Annual reporting to the PSC limited to:
- Use of Public Service Official Language Exclusion Approval Order
- Exceptions to the National Area of Selection approved by the deputy head
- Results of any internal investigations
- Actions taken following any PSC investigations or audits.
- Deputy head responsible for ongoing monitoring of organizational staffing system based on the organization’s unique context
- Assessment of adherence to requirements, based on organization’s own risks, every five years, at a minimum.
PSC Oversight
System-wide focus
- Government-wide compliance audit every two years
- Renewed Survey of Staffing administered in alternating years with government-wide audit
- System-wide effectiveness and efficiency reviews to support continuous improvement
- Targeted PSC audits because of identified system-wide or organizational risks or at the request of deputy head
- Investigations conducted when there is reason to believe there was political influence, fraud, or improper conduct in an appointment process
This document should be read in conjunction with the Public Service Employment Act, the Public Service Employment Regulations, the PSC Appointment Policy and the PSC Appointment Delegation and Accountability Instrument.
Annex B
Population by tenure as of March 31

Text version
| Year | Indeterminate population | Term population | Casual population | Student population | Total population |
|---|---|---|---|---|---|
| As of March 31, 2016 | 199 | 22 | 29 | 8 | 258 |
| As of March 31, 2017 | 232 | 25 | 27 | 13 | 297 |
| As of March 31, 2018 | 236 | 24 | 18 | 4 | 282 |
| As of March 31, 2019 | 265 | 30 | 27 | 7 | 329 |
| As of March 31, 2020 | 344 | 46 | 31 | 18 | 439 |
| As of March 31, 2021 | 374 | 49 | 23 | 13 | 459 |
Population by language requirements as of March 31, 2021

Text version
| Linguistic requirements of the position | Population as of March 31, 2021 | Percentage of population as of March 31, 2021 |
|---|---|---|
| Bilingual | 213 | 56% |
| Unilingual | 169 | 44% |
| Unknowns | 77 | Not Applicable |
Population by occupational group as of March 31, 2021

Text version
| Occupational group | Population as of March 31, 2021 | Percentage of population as of March 31, 2021 |
|---|---|---|
| PC – Physical Sciences | 140 | 31% |
| EC – Economics and Social Science Services | 112 | 25% |
| AS – Administrative Services | 55 | 12% |
| Other | 139 | 31% |
| Unknowns | 13 | Not Applicable |
Population by region as of March 31, 2021

Text version
| Region | Population as of March 31, 2021 | Percentage of population as of March 31, 2021 |
|---|---|---|
| National Capital Region (NCR) | 309 | 67% |
| Non-NCR | 150 | 33% |
| Unknowns | 0 | Not Applicable |
External indeterminate hires by occupational group, 2020-2021

Text version
| Occupational group | Number of indeterminate hiring activities | Percentage of all indeterminate hiring activities |
|---|---|---|
| EC – Economics and Social Science Services | 7 | 37% |
| AS – Administrative Services | 3 | 16% |
| IS – Information Services | 3 | 16% |
| CR – Clerical and Regulatory | 2 | 11% |
| PC – Physical Sciences | 2 | 11% |
| Other | 2 | 11% |
| Total | 19 | 100% |
Staffing by region

Text version
| Fiscal year | Percentage of staffing activities in the National Capital Region (NCR) * | Percentage of staffing activities in all other regions (Non-NCR) * |
|---|---|---|
| 2016-2017 | 66% | 34% |
| 2017-2018 | 75% | 25% |
| 2018-2019 | 73% | 27% |
| 2019-2020 | 72% | 28% |
| 2020-2021 | 76% | 24% |
* Regional distribution excludes unknowns
Staffing Activities by appointment process type

Text version
| Fiscal year | Non-advertised appointments (excludes unknowns) | Advertised appointments | Percentage of Non-advertised appointments |
|---|---|---|---|
| 2016-2017 | 14 | 77 | 15% |
| 2017-2018 | 37 | 56 | 40% |
| 2018-2019 | 59 | 59 | 50% |
| 2019-2020 | 85 | 76 | 53% |
| 2020-2021 | 60 | 35 | 63% |
- Includes indeterminate and specified term appointments
- Excludes lateral and downward movements, deployments and acting appointments of less than 4 months
- Includes only appointments where the staffing process type is known (71% to 88% of appointments)
Staffing by appointment type

Text version
| Fiscal year | Promotions | Lateral and downward movements | Appointments to the public service (includes casuals and students) | Acting appointments (excludes appointments of less than 4 months) | Total |
|---|---|---|---|---|---|
| 2016-2017 | 47 | 57 | 123 | 37 | 264 |
| 2017-2018 | 49 | 45 | 88 | 24 | 206 |
| 2018-2019 | 64 | 52 | 136 | 32 | 284 |
| 2019-2020 | 94 | 76 | 169 | 45 | 384 |
| 2020-2021 | 54 | 57 | 101 | 30 | 242 |
Staffing by tenure
Text version
| Fiscal year | Indeterminate staffing activities | Term staffing activities | Casual staffing activities | Student staffing activities | Total staffing activities |
|---|---|---|---|---|---|
| 2016-2017 | 147 | 39 | 55 | 23 | 264 |
| 2017-2018 | 128 | 23 | 39 | 16 | 206 |
| 2018-2019 | 166 | 41 | 53 | 24 | 284 |
| 2019-2020 | 235 | 46 | 68 | 35 | 384 |
| 2020-2021 | 151 | 36 | 39 | 16 | 242 |
Key findings - Staffing and non-partisanship survey (2018)
- 84.0% of employees agreed that people hired can do the job, compared to 67.1% in organizations of similar size, and 53.8% in the federal public service
- 81.7% of managers agreed that the New Direction in Staffing has improved the way they hire and appoint persons to and within their organization, compared to 69.7% in organizations of similar size, and 56.1% in the federal public service
- 79.0% of managers agreed that within their organization, the administrative process to staff a position is burdensome, compared to 79.3% in organizations of similar size, and 87.9% in the federal public service.
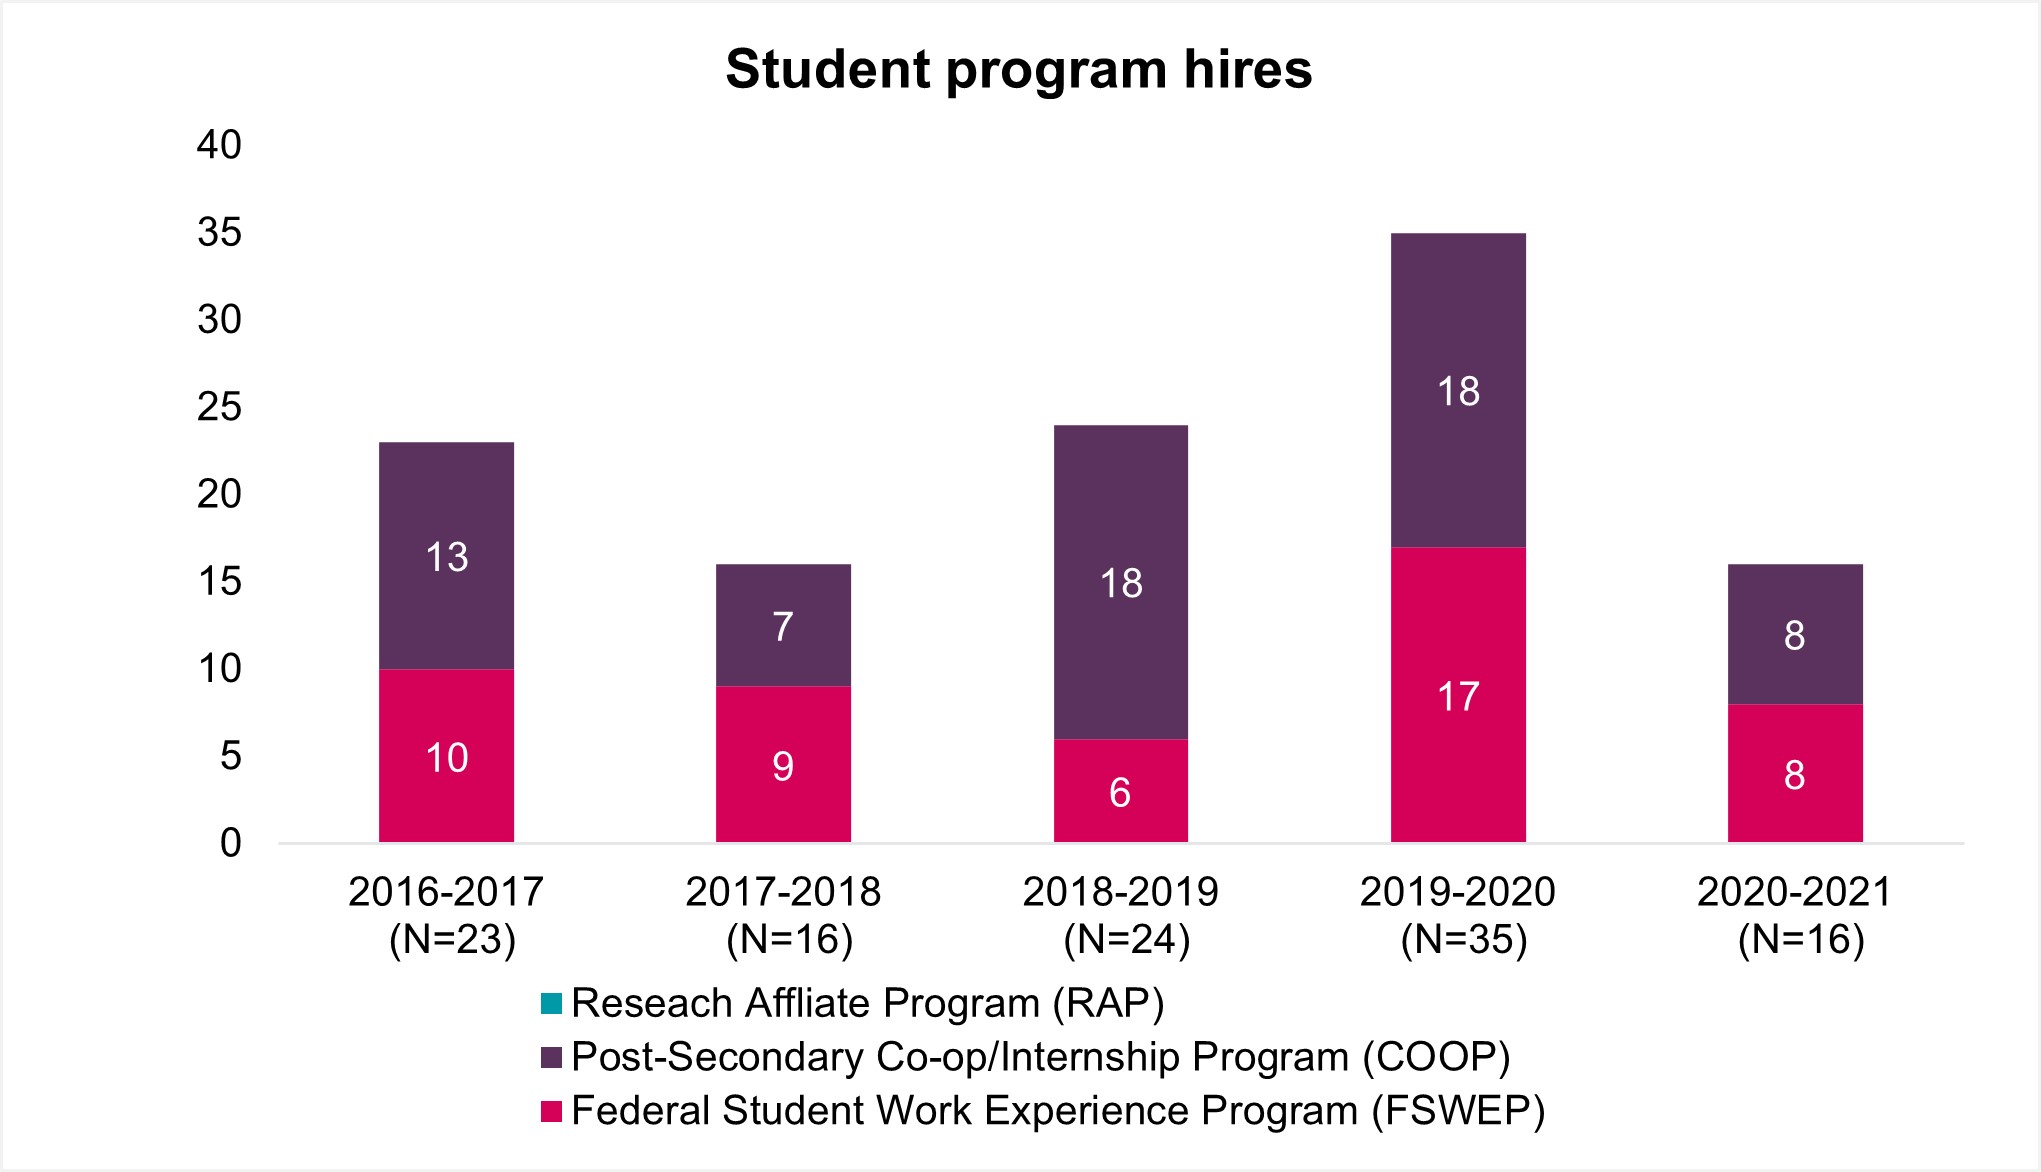
Student program hires
Text version
| Fiscal year | Federal Student Work Experience Program | Post-Secondary Co-op/Internship Program | Research Affiliate Program | Total |
|---|---|---|---|---|
| 2016-2017 | 10 | 13 | 0 | 23 |
| 2017-2018 | 9 | 7 | 0 | 16 |
| 2018-2019 | 6 | 18 | 0 | 24 |
| 2019-2020 | 17 | 18 | 0 | 35 |
| 2020-2021 | 8 | 8 | 0 | 16 |
Post-Secondary Recruitment Program and former student hires

Text version
| Fiscal year | Post-secondary Recruitment (PSR) | Former student hires* |
|---|---|---|
| 2016-2017 | 0 | 10 |
| 2017-2018 | 0 | 5 |
| 2018-2019 | 1 | 11 |
| 2019-2020 | 1 | 12 |
| 2020-2021 | 0 | 14 |
*Hiring of former students includes indeterminate and term hires with experience in a federal student recruitment program within the last 10 years.
Internal time to staff

Text version
| Number of calendar days | The number of internal appointments for which the internal time to staff was within the specified number of calendar days for organizations subject to the Public Service Employment Act |
|---|---|
| 0 calendar days | 0 |
| 0 to 29 calendar days | 10 |
| 30 to 59 calendar days | 67 |
| 60 to 89 calendar days | 147 |
| 90 to 119 calendar days | 203 |
| 120 to 149 calendar days | 191 |
| 150 to 179 calendar days | 174 |
| 180 to 209 calendar days | 168 |
| 210 to 239 calendar days | 136 |
| 240 to 269 calendar days | 125 |
| 270 to 299 calendar days | 114 |
| 300 to 329 calendar days | 79 |
| 330 to 359 calendar days | 74 |
| 360 to 389 calendar days | 66 |
| 390 to 419 calendar days | 56 |
| 420 to 449 calendar days | 46 |
| 450 to 479 calendar days | 34 |
| 480 to 509 calendar days | 28 |
| 510 to 539 calendar days | 27 |
| 540 to 569 calendar days | 19 |
| 570 to 599 calendar days | 10 |
| 600 to 629 calendar days | 13 |
| 630 to 659 calendar days | 13 |
| 660 to 689 calendar days | 12 |
| 690 to 719 calendar days | 7 |
| 720 to 749 calendar days | 10 |
| 750 to 779 calendar days | 8 |
| 780 to 809 calendar days | 8 |
| 810 to 839 calendar days | 3 |
| 840 to 869 calendar days | 5 |
| 870 to 899 calendar days | 6 |
| 900 to 929 calendar days | 3 |
| 930 to 959 calendar days | 2 |
| 960 to 989 calendar days | 2 |
| More than 990 calendar days | 36 |
Internal time to staff is calculated as the number of calendar days between the opening date of the advertisement and the date of the first notification.
Internal time to staff for fiscal year 2020-2021
The median internal time to staff for the public service (organizations subject to the Public Service Employment Act) for fiscal year 2020-2021 is 208 days. The data is insufficient for providing results on internal process times for the for the Impact Assessment Agency of Canada.
External time to staff
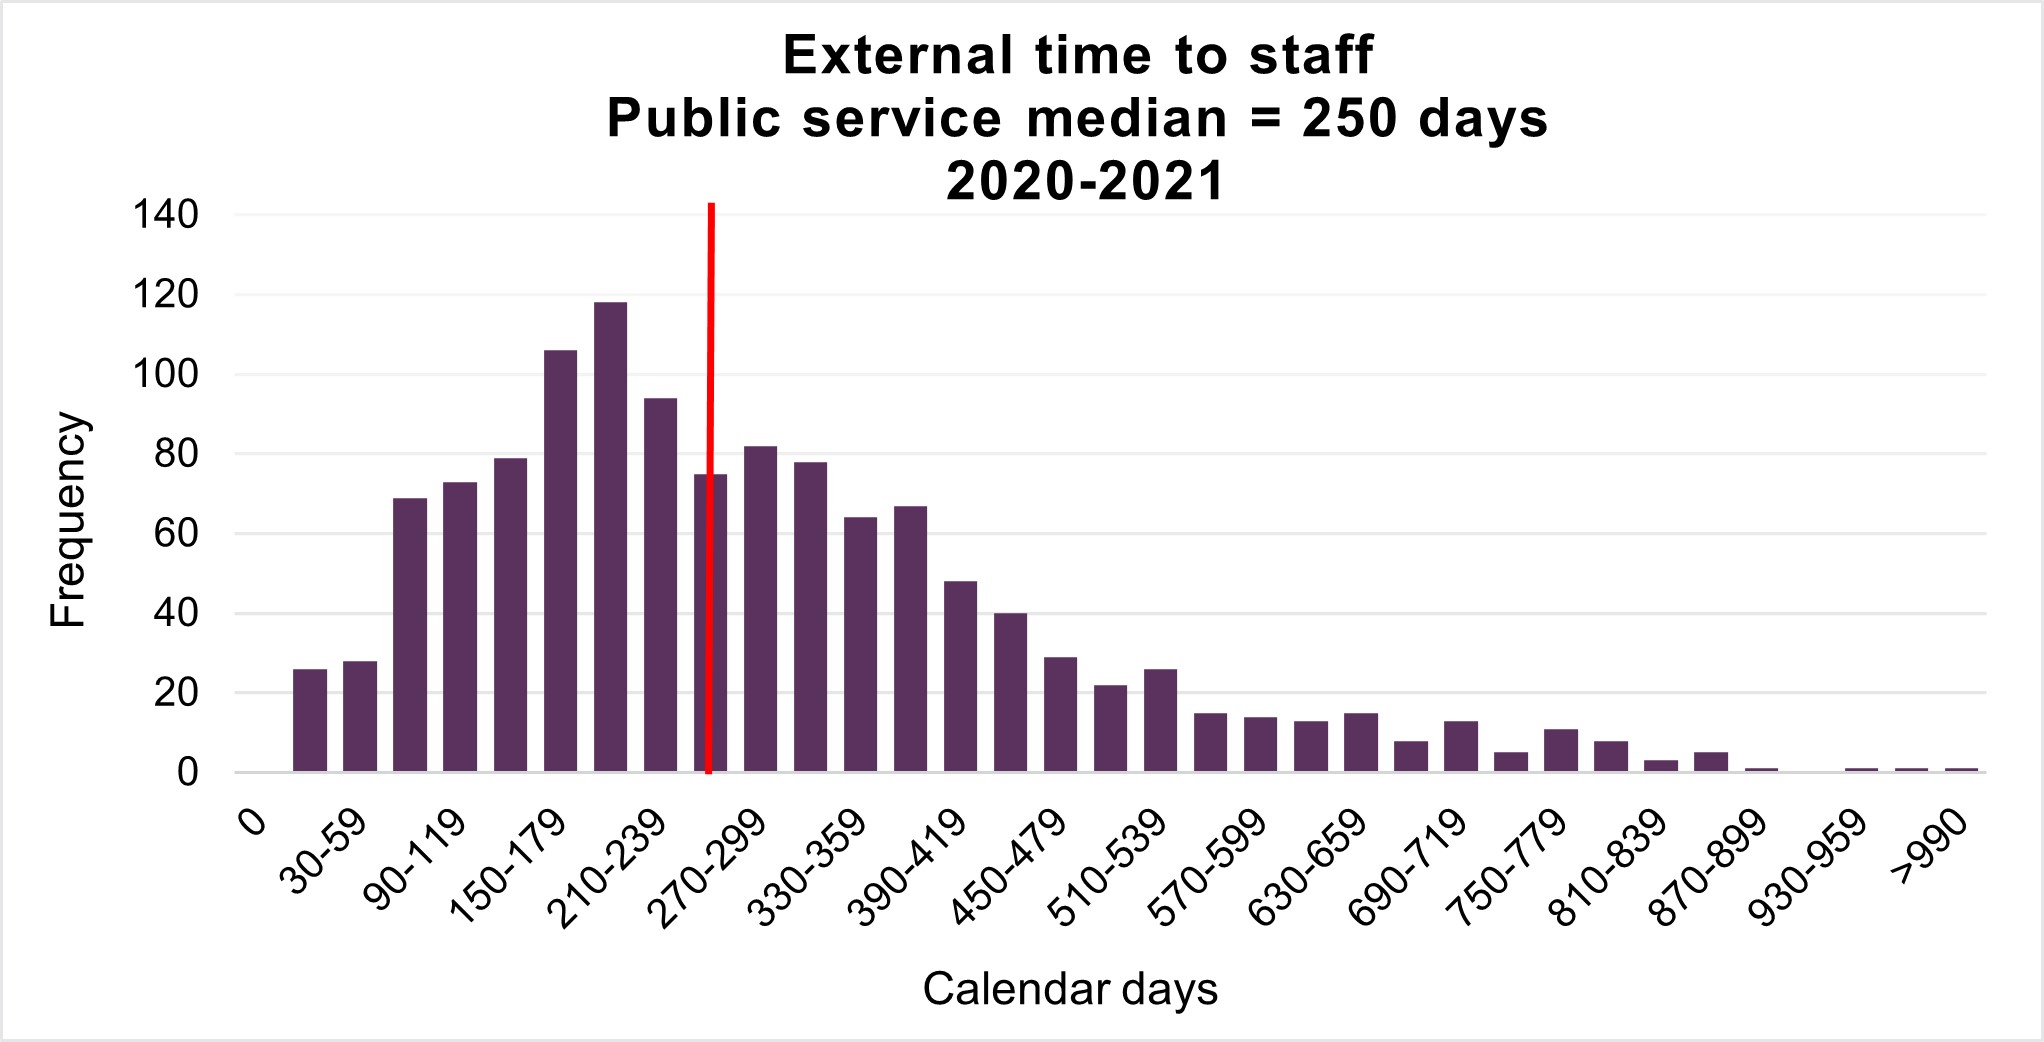
Text version
| Number of calendar days | The number of external appointment processes for which the external time to staff was within the specified number of calendar days for organizations subject to the Public Service Employment Act |
|---|---|
| 0 calendar days | 0 |
| 0 to 29 calendar days | 26 |
| 30 to 59 calendar days | 28 |
| 60 to 89 calendar days | 69 |
| 90 to 119 calendar days | 73 |
| 120 to 149 calendar days | 79 |
| 150 to 179 calendar days | 106 |
| 180 to 209 calendar days | 118 |
| 210 to 239 calendar days | 94 |
| 240 to 269 calendar days | 75 |
| 270 to 299 calendar days | 82 |
| 300 to 329 calendar days | 78 |
| 330 to 359 calendar days | 64 |
| 360 to 389 calendar days | 67 |
| 390 to 419 calendar days | 48 |
| 420 to 449 calendar days | 40 |
| 450 to 479 calendar days | 29 |
| 480 to 509 calendar days | 22 |
| 510 to 539 calendar days | 26 |
| 540 to 569 calendar days | 15 |
| 570 to 599 calendar days | 14 |
| 600 to 629 calendar days | 13 |
| 630 to 659 calendar days | 15 |
| 660 to 689 calendar days | 8 |
| 690 to 719 calendar days | 13 |
| 720 to 749 calendar days | 5 |
| 750 to 779 calendar days | 11 |
| 780 to 809 calendar days | 8 |
| 810 to 839 calendar days | 3 |
| 840 to 869 calendar days | 5 |
| 870 to 899 calendar days | 1 |
| 900 to 929 calendar days | 0 |
| 930 to 959 calendar days | 1 |
| 960 to 989 calendar days | 1 |
| More than 990 calendar days | 1 |
External time to staff is calculated as the number of calendar days between the opening date of the advertisement and the date of the first estimated external hire.
External time to staff for fiscal year 2020-2021
The median external time to staff for the public service (organizations subject to the Public Service Employment Act) for fiscal year 2020-2021 is 250 days. The data is insufficient for providing results on external process times for the for the Impact Assessment Agency of Canada.
Technical Notes:
- The Time to Staff for internal appointments is the median number of calendar days between the opening date of an internal advertisement and the date of the first Notice of Appointment or Proposal of Appointment (NAPA) from the Public Service Resourcing System for internal term and indeterminate positions. As NAPAs are not required for all internal staffing actions, this measure is limited to reporting on internal promotional appointments
- Only estimated term and indeterminate appointments/notifications are included (deployments, casual and acting appointments are excluded)
- The Time to Staff for external appointments is the median number of calendar days between the opening date of an external advertisement and the date of the first estimated appointment of an individual from outside an organization subject to the Public Service Employment Act for term and indeterminate positions. Only estimated term and indeterminate appointments/notifications are included (deployments, casual and acting appointments are excluded)
- Because data between systems is linked using a deterministic match, errors in data linkage are a potential source of measurement error
Sources:
- Hiring and staffing activities data are derived from information received from the Treasury Board of Canada Secretariat Incumbent File. The Incumbent File is extracted from the Public Services and Procurement Canada’s pay system. The data constitutes an estimate of hiring and staffing activities to and within organizations
- Information from the Priority Information Management System and the Public Services Resourcing System is also used to determine if staffing actions are advertised or non-advertised as well as for calculating time to staff
- The data are not expected to match an organization’s human resources data, due to methodology and timing differences
Page details
- Date modified: