
Citizenship of Applicants and External Appointments from April 1, 2017 to March 31, 2023
Objective
This report examines how frequently, in comparison to Canadian citizens (referred to here as “citizens”), permanent residents and non-Canadian citizens (“non-citizens”) apply to and are appointed to federal government positions that are advertised to the public. The report also explores the employment equity representation of citizens, non-citizens and permanent resident applicants as well as those that are hired externally.
According to the Employment Equity Act, employment equity aims to achieve equality in the workplace and to correct conditions of disadvantage in employment for the 4 employment equity groups: women, Indigenous PeoplesFootnote 1, persons with disabilities and members of visible minorities. Non-citizens are eligible to work in the federal public service, whether they are permanent residents or not. However, prior to the amendments to the Public Service Employment Act (PSEA) in 2021, citizens were given preference over non-citizens in advertised external appointment processes for federal government jobs. The 2021 amendments to the PSEA now give equal preference to citizens and permanent residents in those external advertised appointments. This was intended to remove potential barriers to employment from the hiring process and to provide a level playing field at the federal level for permanent residents.
These changes are reflected in the current report, which extends the results of the previous report by two years, from March 31, 2021 to March 31, 2023, and which details changes in trends following the amendments to the Act. Please note that this report analyzes the trends of applicants and external hires by citizenship status; it is not intended to analyze the impact of the amendments specifically on permanent residents. The impact of the amendments on permanent resident hiring will be explored in a future separate report.
Key takeaways
The scope of this report covers the fiscal yearsFootnote 2 between April 1, 2017 and March 31, 2023. Results show the following:
- Most non-citizen applicants and external hires are permanent residents.
- Permanent residents represent a growing number and share of total applicants and external hires.
- Despite increases in permanent resident recruitment, their share of hires is smaller than their share of applicants.
- Applicants who identify themselves as visible minorities are more likely to be non-citizens than their non-visible minorities counterparts. Further, non-citizens are less likely to be hired than citizens.
- As a result, there are fewer non-citizen visible minority applicants that are appointed.
- For all employment equity groups, non-citizens represented a higher share of applicants for men than for women.
Citizenship status of applicants and external appointments
- In 2022 to 2023, there were 348,520 unique applicants to jobs open to the public on the GC jobs website, a decrease from 375,473 in 2020 to 2021 (see Annex 2, Table A2-1).
- The share of non-citizen applicants to jobs advertised to the public increased from 17.1% (64,184) in 2020 to 2021 to 25.1% (87,407) in 2022 to 2023.
- In 2022 to 2023, there were 24,727 external appointments (external hires) from jobs open to the public for which citizenship could be identified, an increase from 19,065 in 2020 to 2021.
- Canadian citizens accounted for 92.2% (22,786) of all external appointments in 2022 to 2023.
- Non-citizen hires in 2022 to 2023 accounted for 7.8% (1,941) of the total, an increase from the share in 2020 to 2021 (2.5%, 471).
- Although preference in appointment of Canadian citizens and permanent residents are equal, the share of external hires that are non-citizens continued to be well below their relative share of applicants.
Citizenship and employment equity
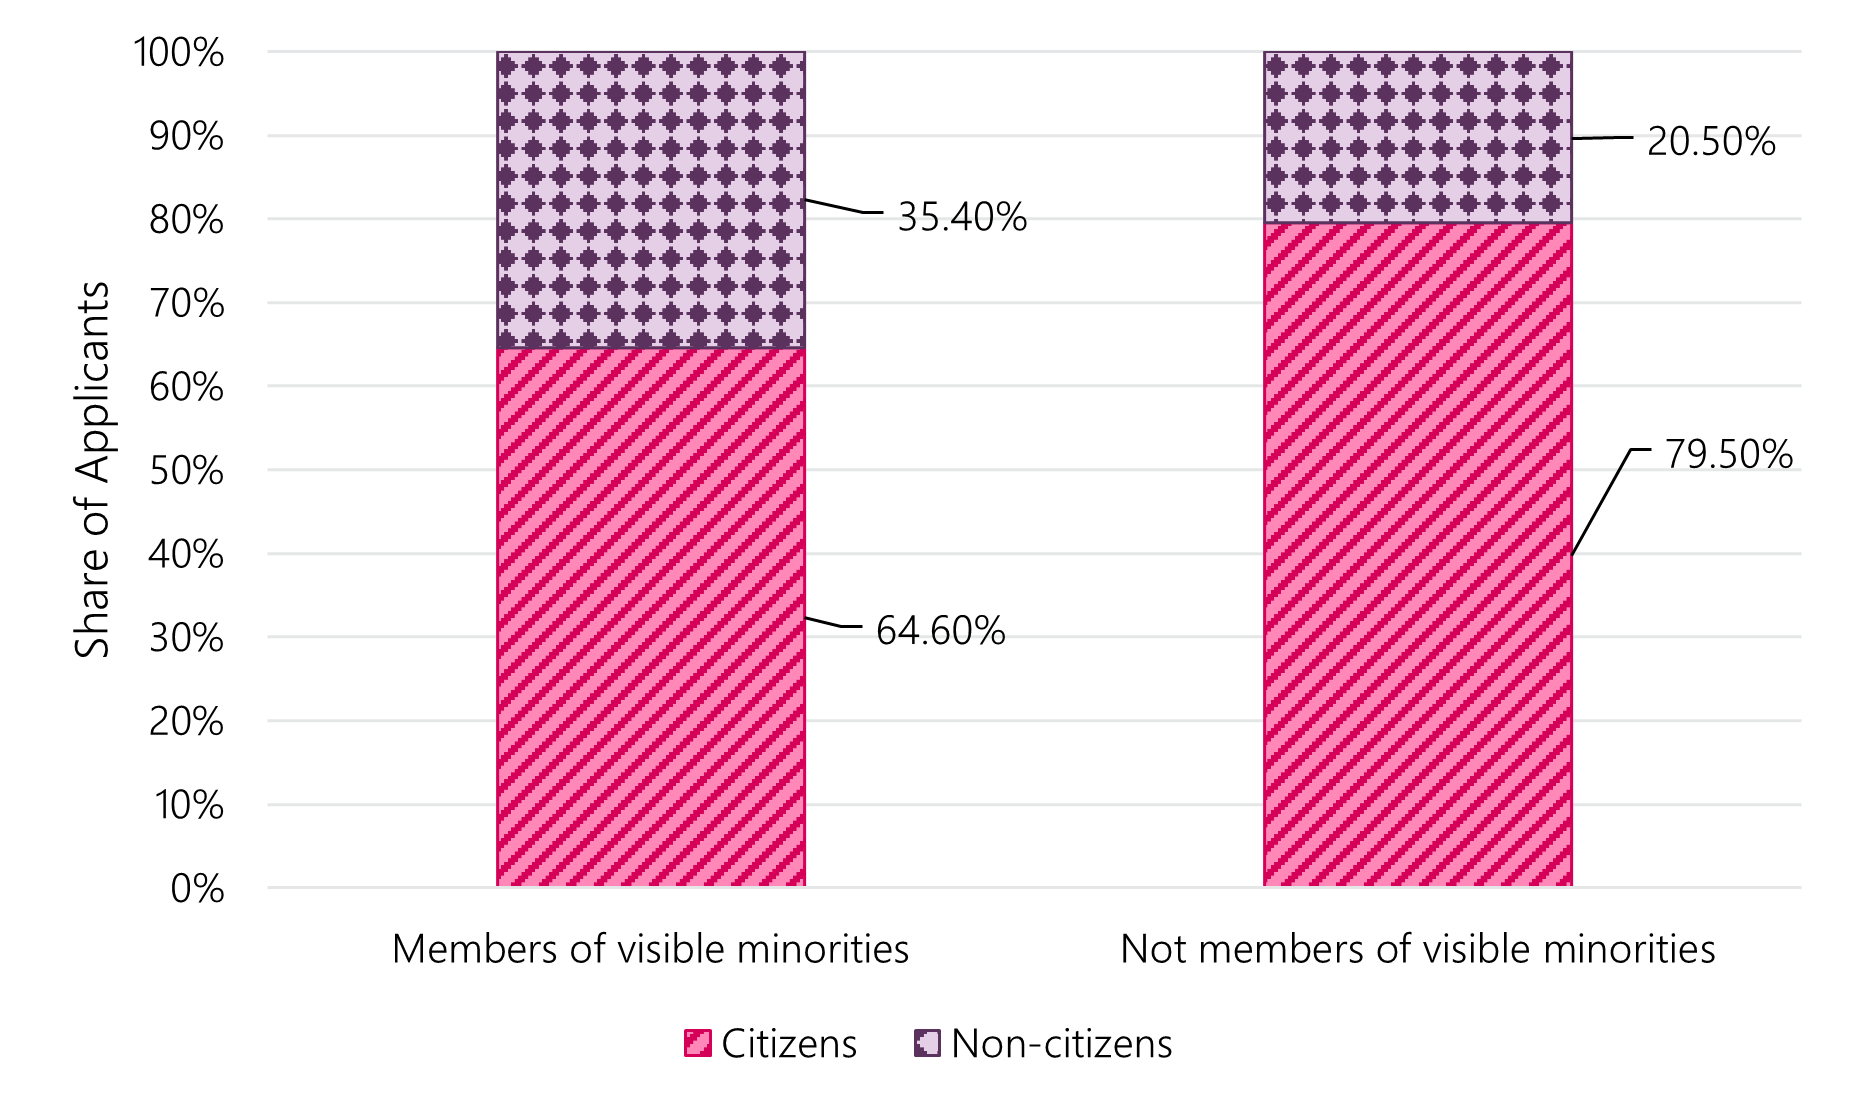
Non-citizens accounted for 35.4% of visible minority applicants, compared to 20.5% of non-visible minority applicants in 2022 to 2023 (see Graph 1). This is an increase from 27.3% and 13.7% respectively in 2020 to 2021.
Graph 1: Share of citizen versus non-citizen applicants among members of visible minorities and those who are not members of visible minorities fiscal year 2022 to 2023)
Text version
| Employment equity group | Citizens | Non-citizens |
|---|---|---|
| Applicants who are members of visible minorities | 64.6% | 35.4% |
| Applicants who are not members of visible minorities | 79.5% | 20.5% |
Visible minority applicants are more likely to be non-citizens than non-visible minority applicants.Footnote 3 Further, non-citizens overall are less likely to be hired than citizens. As a result, non-citizen visible minority applicants are less likely to be appointed relative to citizen visible minority applicants.
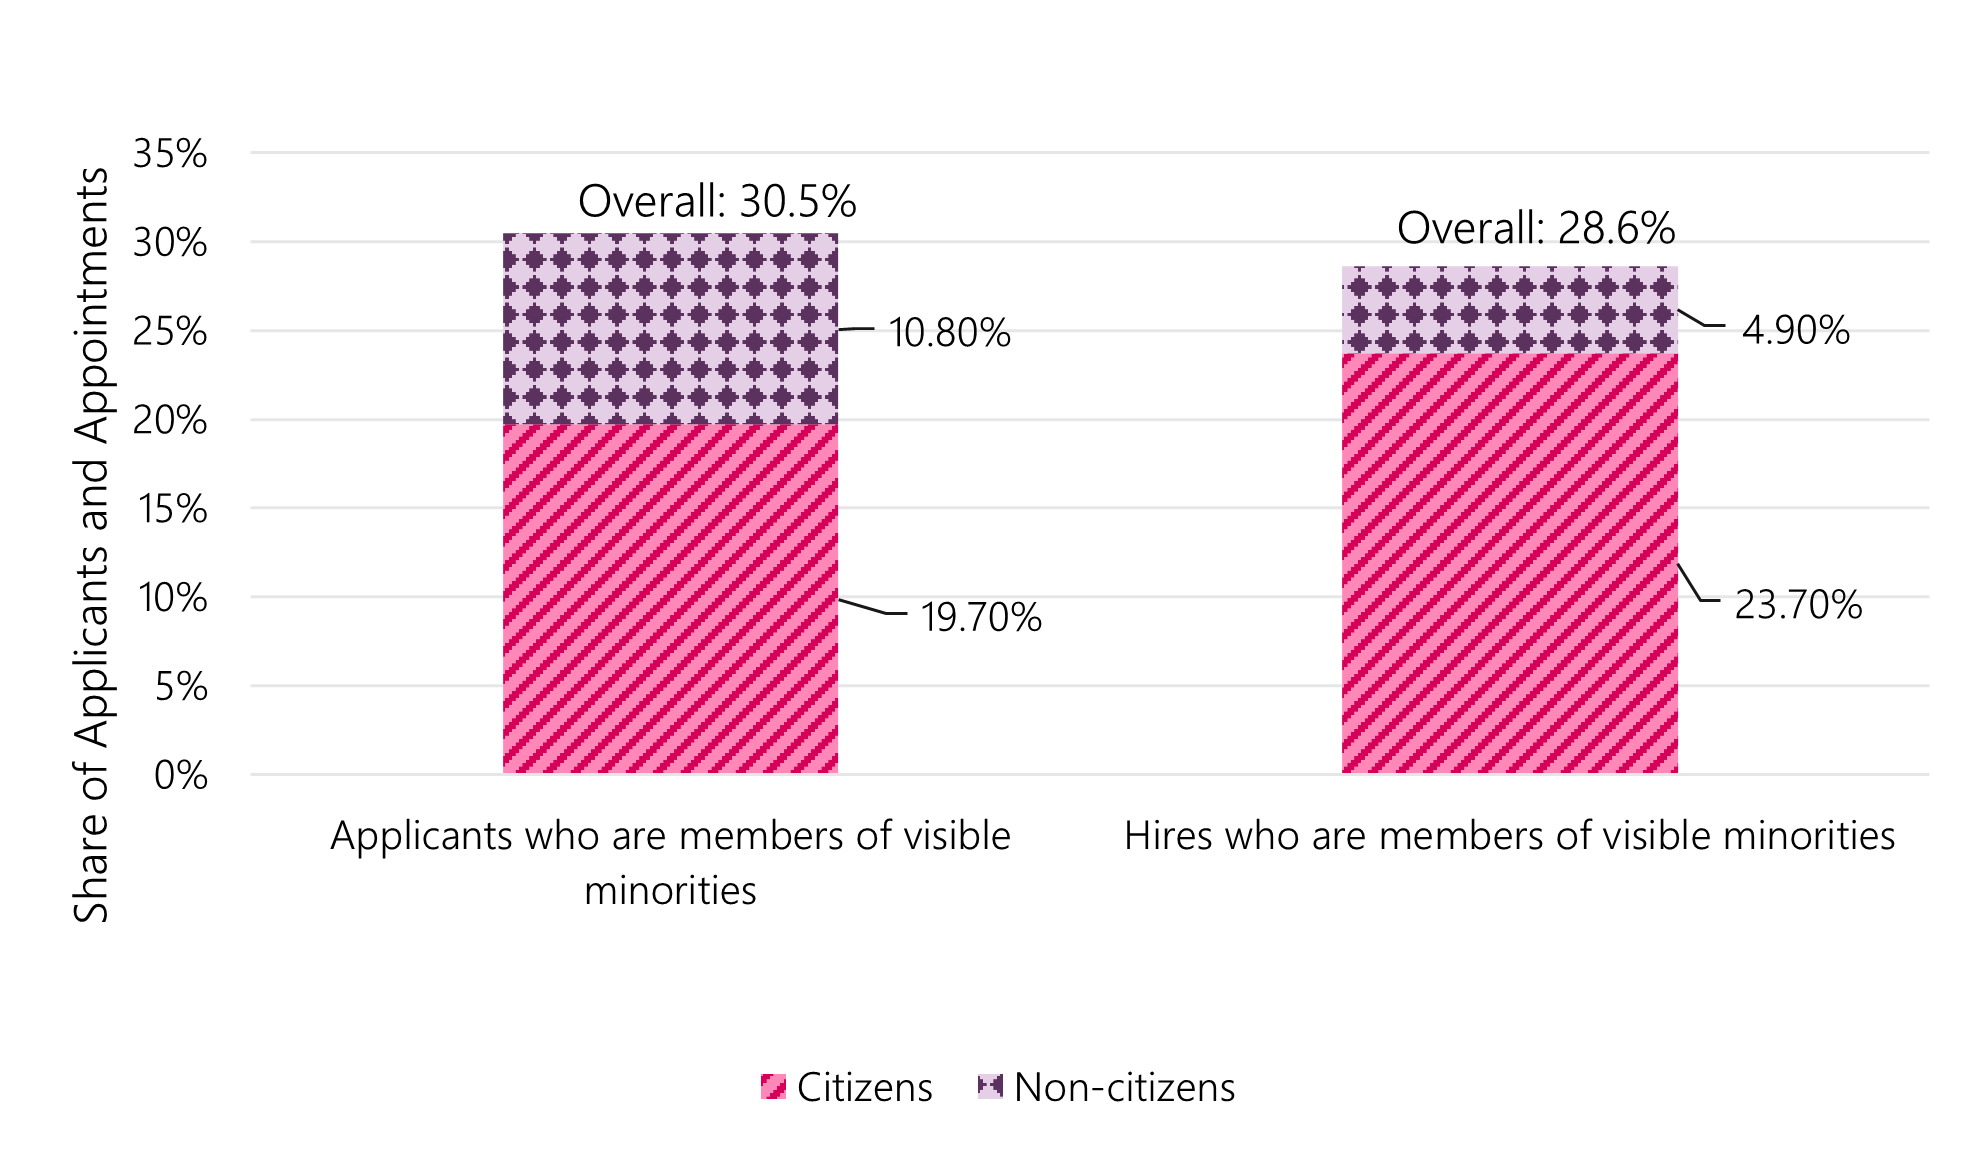
This can be seen in Graph 2, which breaks down visible minority applicants and appointments by citizenship.
- Overall, members of visible minorities represent 31% of all applicants and 29% of hires.
- When the analysis is restricted to Canadian citizens, members of visible minorities represent 19.7% of applicants and 23.7% of hires.
- However, non-citizen visible minorities represent 10.8% of all applicants but only 4.9% of all hires.
Graph 2: Members of visible minorities as applicants and external appointments, citizens versus non-citizens (fiscal year 2022 to 2023)
Text version
| Representation type | Citizens | Non-citizens | Total percent |
|---|---|---|---|
| Applicants who are members of visible minorities | 19.7% | 10.8% | 30.5% |
| Hires who are members of visible minorities | 23.7% | 4.9% | 28.6% |
Permanent residents and other non-citizens
There are different types of non-citizenship.Footnote 4 The following section describes applicant and appointment shares of permanent residents compared to other non-citizens.
Applicants
- Most non-citizen applicants are permanent residents.
- In 2022 to 2023, 63% (55,113) of the 87,407 non-citizen applicants were permanent residents, while the remaining 37% (32,294) were other non-citizens.
- Representation of members of visible minorities is highest among permanent resident applicants compared to other citizenship statuses.
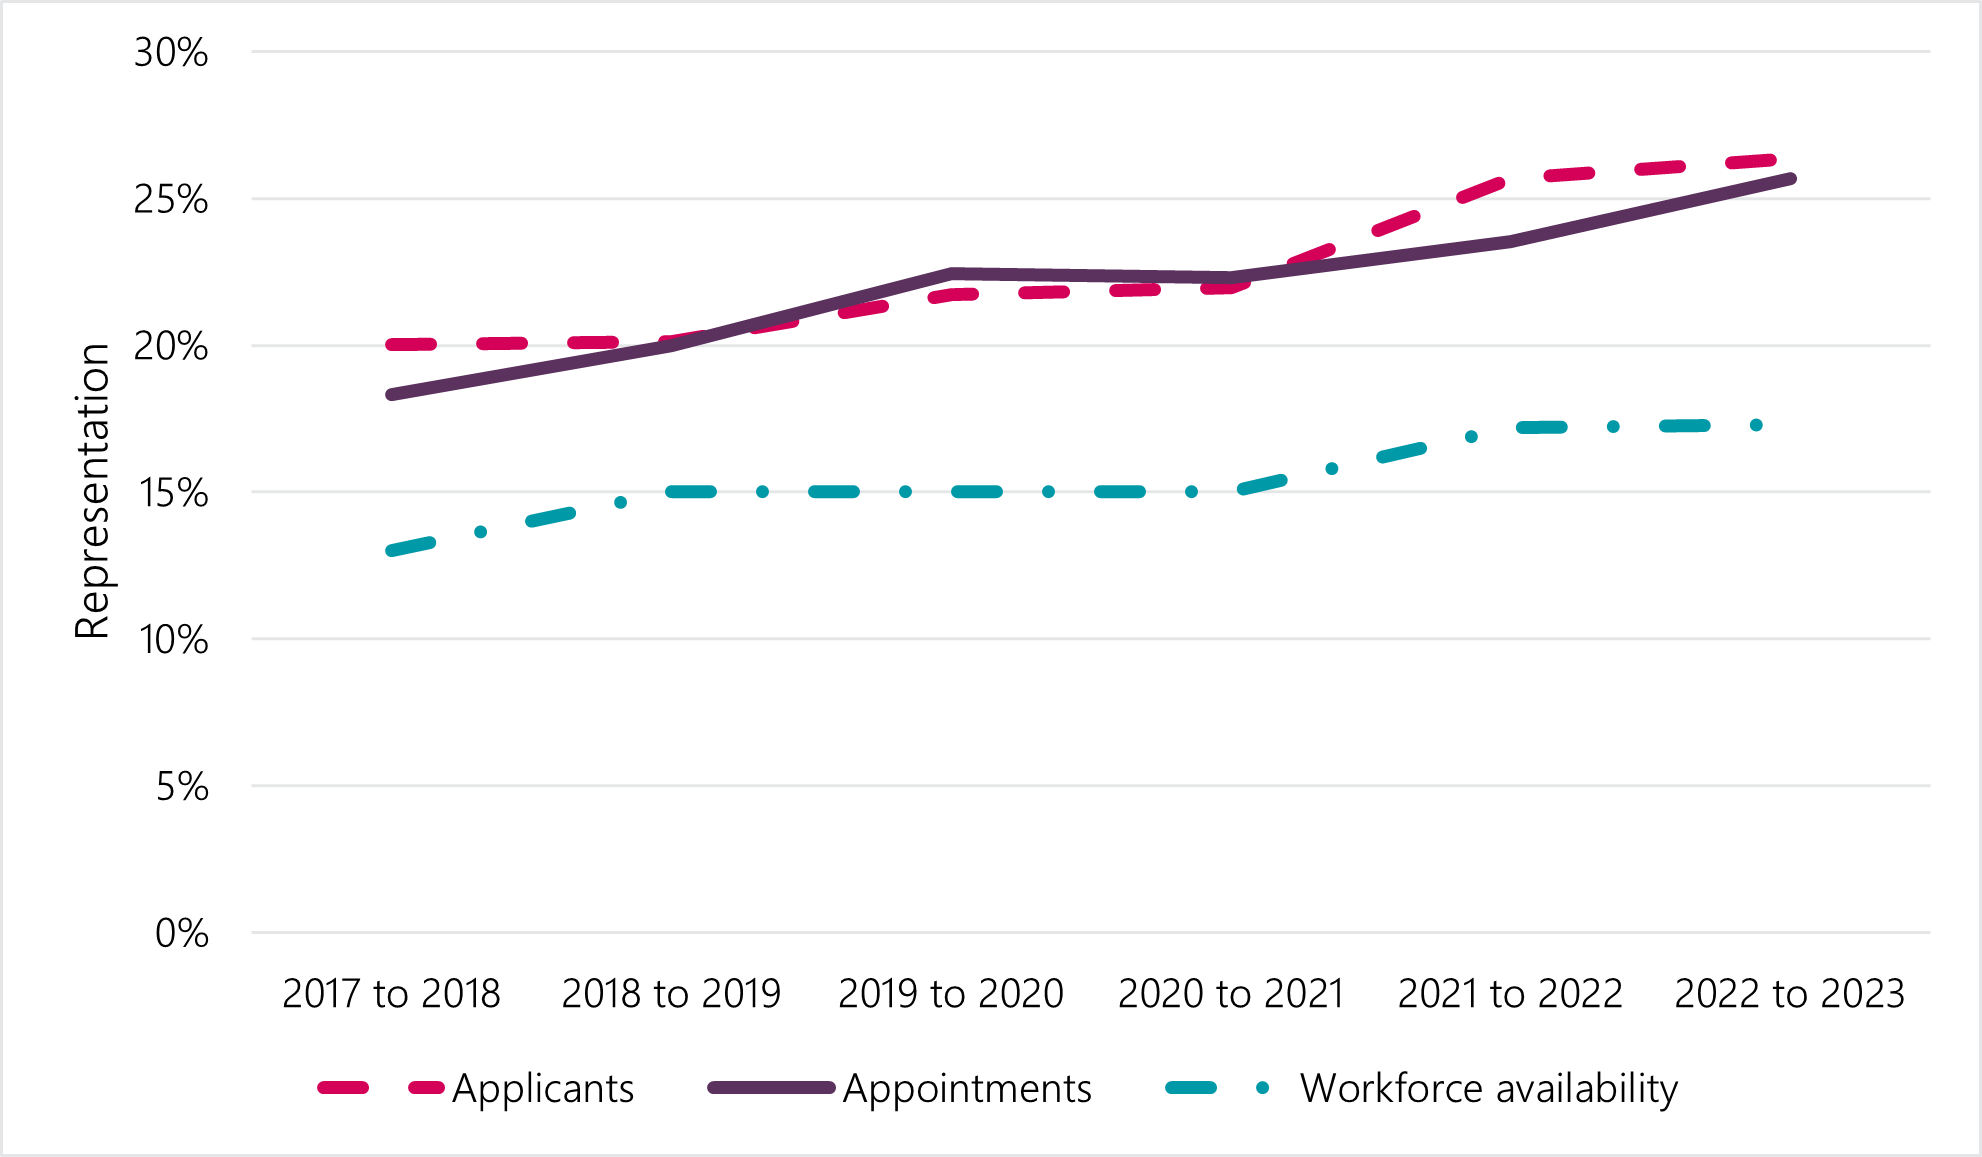
- In 2022 to 2023, 49.3% of permanent resident applicants to external job advertisements were visible minorities, compared to 26.3% for citizens and 32.5% for other non-citizens. This is an increase from 44.1%, 22.0% and 31.3%, respectively, in 2020 to 2021 (see Annex 2, Table A2-6 and Graph 3).Footnote 5
External Appointments
- Most non-citizen hires are permanent residents.
- Of the 7.8% of the non-citizens hires in 2022 to 2023, over 9 in 10 (1,769 hires) were permanent residents, while the remaining hires (172 hires) were other non-citizens.
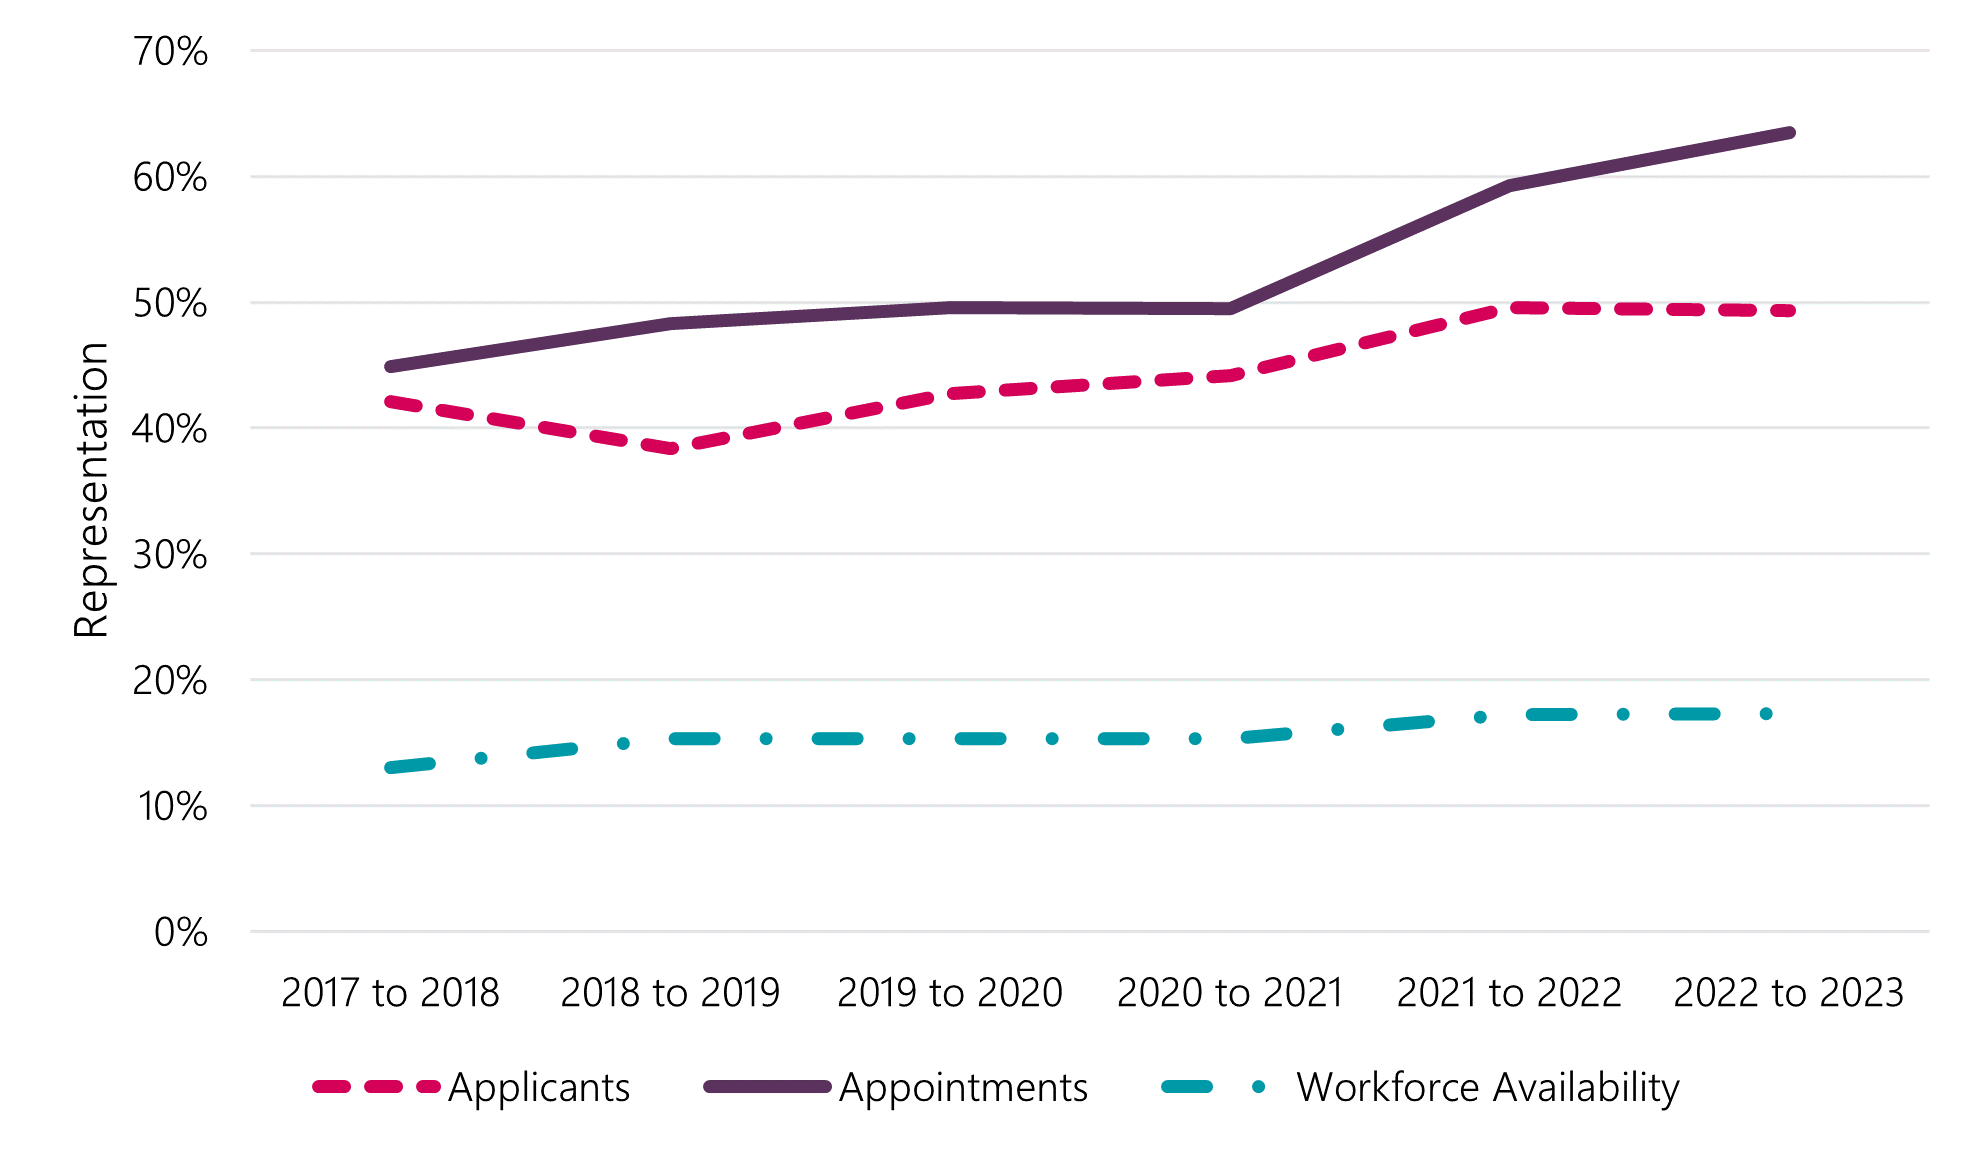
- Representation of visible minorities in external hires is highest among permanent residents (see Graph 4, Annex 2, Table A2-11).
- In 2022 to 2023, 63.5% of external hires among permanent residents were members of visible minorities, compared to 25.7% of citizens and 48.3% of other non-citizens.
Graph 3: Representation of members of visible minorities among applicants and external appointments, Canadian citizens (April 1, 2017 to March 31, 2023)
Text version
| Fiscal Year | 2017 to 2018 | 2018 to 2019 | 2019 to 2020 | 2020 to 2021 | 2021 to 2022 | 2022 to 2023 |
|---|---|---|---|---|---|---|
| Applicants | 20.0% | 20.1% | 21.7% | 22.0% | 25.7% | 26.3% |
| Appointments | 18.3% | 20.0% | 22.4% | 22.3% | 23.5% | 25.7% |
| Workforce Availability | 13.0% | 15.3% | 15.3% | 15.3% | 17.2% | 17.3% |
Graph 4: Members of visible minority representation among applicants and external appointments, permanent residents (April 1, 2017 to March 31, 2023)
Text version
| Representation type | 2017 to 2018 | 2018 to 2019 | 2019 to 2020 | 2020 to 2021 | 2021 to 2022 | 2022 to 2023 |
|---|---|---|---|---|---|---|
| Applicants | 42.1% | 38.4% | 42.7% | 44.2% | 49.6% | 49.3% |
| Appointments | 44.9% | 48.3% | 49.6% | 49.5% | 59.3% | 63.5% |
| Workforce Availability | 13.0% | 15.3% | 15.3% | 15.3% | 17.2% | 17.3% |
Graph 5: Members of visible minority representation among applicants and external appointments, other non-citizens (April 1, 2017 to March 31, 2023)
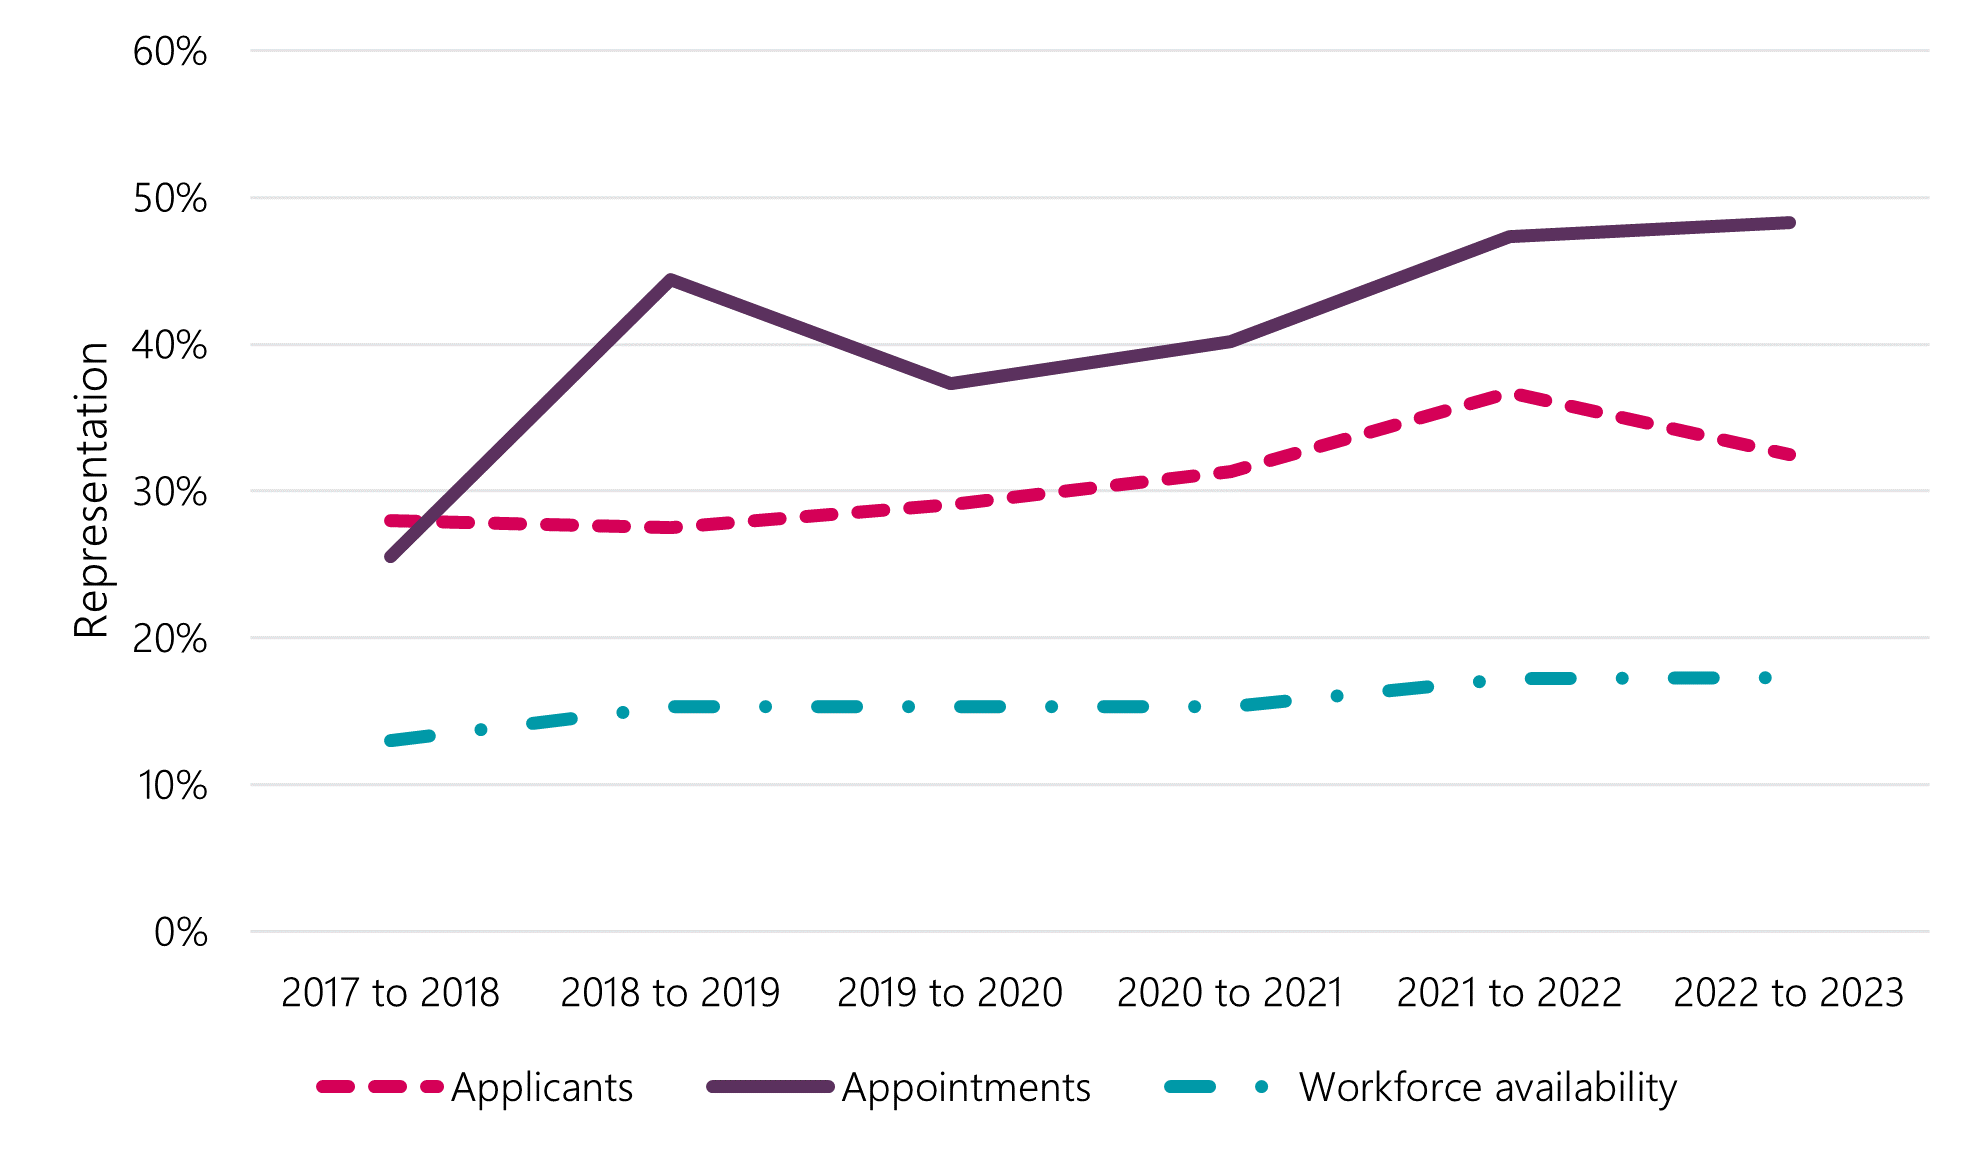
Text version
| Representation type | 2017 to 2018 | 2018 to 2019 | 2019 to 2020 | 2020 to 2021 | 2021 to 2022 | 2022 to 2023 |
|---|---|---|---|---|---|---|
| Applicants | 28.0% | 27.5% | 29.1% | 31.3% | 36.7% | 32.5% |
| Appointments | 25.5% | 44.4% | 37.3% | 40.2% | 47.3% | 48.3% |
| Workforce Availability | 13.0% | 15.3% | 15.3% | 15.3% | 17.2% | 17.3% |
Intersectionality with gender
Non-citizen men make up a higher percentage of applicants among employment equity groups than women (Annex 2, Table A2-12).
- 38.1% of visible minority men applicants were non-citizens. This compares to 35.0% amongst visible minority women. This is an increase from 30.9% and 26.4% in 2020 to 2021, respectively.
- As of 2022 to 2023, non-citizens accounted for 10.4% of men with disability applicants and 5.9% of women with disability applicants. In 2020 to 2021, these percentages were 7.9% and 4.1%, respectively.
There has been an increase in most of the appointment shares of non-citizen men and women who belong to an employment equity group between April 1, 2020 and March 31, 2023.
- Non-citizens represented 17.9% of visible minority men and 16.6% of visible minority women external hires in 2022 to 2023. Compared to 2020 to 2021, this represents an increase from 5.9% and 4.7%, respectively (see Annex 2, Table A2-13).Footnote 6
- Non-citizen represented 4.3% of men with disabilities and 3.8% of women with disabilities external hires. Again, this represents an increase since 2020 to 2021, from 1.7% and 0.2% respectively.
Conclusion
In this updated report, two more years of applicant and appointment data have been included. In line with our previous findings, there is an overall increase in non-citizens applying for jobs advertised to the public. Non-citizens continue to make up a greater proportion of visible minority applicants than among non-visible minorities, and this proportion increased between April 1, 2020 and March 31, 2023. Non-citizens remain less likely to be appointed than Canadian citizens, but their appointment share has increased from 2.5% in 2020 to 2021 to 7.8% in 2022 to 2023.
The notable increase in the share of non-citizens applying to jobs open to the public and subsequently appointed in the fiscal years 2021 to 2023 corresponds with the June 2021 amendments to the Public Service Employment Act to help identify and mitigate biases and barriers that disadvantage persons belonging to equity seeking groups in appointment processes.. The analysis of the impact of the amendments will be explored in a future report. The PSC will continue monitoring the impact of these legislative changes on permanent resident hiring.
Annex 1 - Methodology
For this analysis, all jobs open to the public for indeterminate and term positions for a duration of three months or greater, that closed between April 1, 2017, and March 31, 2023, were evaluated. Similarly, all external appointments for indeterminate and term positions for a duration of three months or greater between April 1, 2017, and March 31, 2023, are included. The report provides information on applications and appointments to positions in federal public service departments and agencies that rely on the Commission’s authority to make appointments as set out in the Public Service Employment Act.
We assess the citizenship of external appointments by matching existing public servants to the Public Service Resourcing System (PSRS) applications using a deterministic record linkage process.
We assess the employment equity status of applicants based on the self-declaration provided in their applications on the PSRS. For external appointments, we analyze employees’ self-identification for the four employment equity groups as collected by the Treasury Board Secretariat in the Employment Equity Data Bank (EEDB). The most recent available data from the EEDB is up to March 31, 2023.
The workforce availability is aligned with the figures published in the Treasury Board Secretariat’s Annual Employment Equity Report.
| Employment equity groups | 2017 to 2018 | 2018 to 2019 | 2019 to 2020 | 2020 to 2021 | 2021 to 2022 | 2022 to 2023 |
|---|---|---|---|---|---|---|
| Women | 52.5% | 52.7% | 52.7% | 52.7% | 53.3% | 53.7% |
| Persons with disabilities | 4.4% | 9.0% | 9.0% | 9.0% | 9.1% | 9.2% |
| Members of visible minorities | 13.0% | 15.3% | 15.3% | 15.3% | 17.2% | 17.3% |
Source: Treasury Board Secretariat, Employment Equity in the Public Service of Canada for Fiscal Year 2017 to 2023.
Annex 2 – Results
| Representation type | 2017 to 2018 | 2018 to 2019 | 2019 to 2020 | 2020 to 2021 | 2021 to 2022 | 2022 to 2023 |
|---|---|---|---|---|---|---|
| Applicants | 247,035 | 368,763 | 314,830 | 375,473 | 330,434 | 348,520 |
| Citizens | 217,078 (87.9%) | 315,161 (85.5%) | 264,973 (84.2%) | 311,289 (82.9%) | 268,574 (81.3) | 261,113 (74.9) |
| Non-citizens | 29,957 (12.1%) | 53,602 (14.5%) | 49,857 (15.8%) | 64,184 (17.1%) | 61,860 (18.7%) | 87,407 (25.1%) |
| Permanent residents | 20,666 | 37,716 | 33,606 | 43,135 | 41,787 | 55,113 |
| Other non-citizens | 9,291 | 15,886 | 16,251 | 21,049 | 20,073 | 32,294 |
| Representation type | 2017 to 2018 | 2018 to 2019 | 2019 to 2020 | 2020 to 2021 | 2021 to 2022 | 2022 to 2023 |
|---|---|---|---|---|---|---|
| Appointments | 16,628 | 20,012 | 20,427 | 19,065 | 22,303 | 24,727 |
| Citizens | 16,303 (98.0%) | 19,517 (97.5%) | 19,948 (97.7%) | 18,594 (97.5%) | 21,434 (96.1%) | 22,786 (92.15%) |
| Non-citizens | 325 (2.0%) | 495 (2.5%) | 479 (2.3%) | 471 (2.5%) | 869 (3.9%) | 1,941 (7.8%) |
| Permanent residents | 274 | 387 | 377 | 384 | 757 | 1,769 |
| Other non-citizens | 51 | 108 | 102 | 87 | 112 | 172 |
| Employment equity group | Citizenship Status | 2017 to 2018 | 2018 to 2019 | 2019 to 2020 | 2020 to 2021 | 2021 to 2022 | 2022 to 2023 |
|---|---|---|---|---|---|---|---|
| Members of visible minority | Citizen | 79.4% | 77.1% | 75.1% | 72.7% | 71.1% | 64.61% |
| Members of visible minority | Non-citizen | 20.6% | 22.9% | 24.9% | 27.3% | 28.9% | 35.4% |
| Not members of visible minorities | Citizen | 90.3% | 87.9% | 87.1% | 86.3% | 85.5% | 79.5% |
| Not members of visible minorities | Non-citizen | 9.7% | 12.1% | 12.9% | 13.7% | 14.5% | 20.5% |
| Representation type | 2017 to 2018 | 2018 to 2019 | 2019 to 2020 | 2020 to 2021 | 2021 to 2022 | 2022 to 2023 |
|---|---|---|---|---|---|---|
| All | 22.2% | 22.3% | 24.3% | 25.0% | 29.4% | 30.6% |
| Citizens | 20.0% | 20.1% | 21.7% | 22.0% | 25.7% | 26.3% |
| Non-citizens | 37.7% | 35.1% | 38.3% | 40.0% | 45.4% | 43.1% |
| Representation type | 2017 to 2018 | 2018 to 2019 | 2019 to 2020 | 2020 to 2021 | 2021 to 2022 | 2022 to 2023 |
|---|---|---|---|---|---|---|
| All | 18.8% | 20.7% | 23.0% | 22.9% | 24.9% | 28.5% |
| Citizens | 18.3% | 20.0% | 22.4% | 22.3% | 23.5% | 25.7% |
| Non-citizens | 41.8% | 47.5% | 47.0% | 47.8% | 57.8% | 62.2% |
| Representation type | 2017 to 2018 | 2018 to 2019 | 2019 to 2020 | 2020 to 2021 | 2021 to 2022 | 2022 to 2023 |
|---|---|---|---|---|---|---|
| Canadian citizens | 20.0% | 20.1% | 21.7% | 22.0% | 25.7% | 26.3% |
| Permanent residents | 42.1% | 38.4% | 42.7% | 44.2% | 49.6% | 49.3% |
| Other non-citizens | 28.0% | 27.5% | 29.1% | 31.3% | 36.7% | 32.5% |
| Representation type | 2017 to 2018 | 2018 to 2019 | 2019 to 2020 | 2020 to 2021 | 2021 to 2022 | 2022 to 2023 |
|---|---|---|---|---|---|---|
| Canadian citizens | 18.3% | 20.0% | 22.4% | 22.3% | 23.5% | 25.7% |
| Permanent residents | 44.9% | 48.3% | 49.6% | 49.5% | 59.3% | 63.5% |
| Other non-citizens | 25.5% | 44.4% | 37.3% | 40.2% | 47.3% | 48.3% |
| Citizenship Status | 2017 to 2018 | 2018 to 2019 | 2019 to 2020 | 2020 to 2021 | 2021 to 2022 | 2022 to 2023 |
|---|---|---|---|---|---|---|
| Citizens | 43.1% | 39.4% | 40.7% | 37.7% | 39.8% | 38.3% |
| Non-citizens | 31.1% | 26.0% | 26.1% | 24.6% | 25.9% | 22.4% |
| Employment equity group | Citizenship Status | 2017 to 2018 | 2018 to 2019 | 2019 to 2020 | 2020 to 2021 | 2021 to 2022 | 2022 to 2023 |
|---|---|---|---|---|---|---|---|
| Members of visible minorities | Citizen | 95.6% | 94.3% | 95.2% | 94.9% | 90.9% | 82.9% |
| Members of visible minorities | Non-citizen | 4.4% | 5.7% | 4.8% | 5.1% | 9.1% | 17.1% |
| Not members of visible minorities | Citizen | 98.6% | 98.4% | 98.4% | 98.3% | 97.8% | 95.8% |
| Not members of visible minorities | Non-citizen | 1.4% | 1.6% | 1.6% | 1.7% | 2.2% | 4.2% |
| Citizenship Status | 2017 to 2018 | 2018 to 2019 | 2019 to 2020 | 2020 to 2021 | 2021 to 2022 | 2022 to 2023 |
|---|---|---|---|---|---|---|
| Citizens | 41.5% | 37.7% | 39.5% | 36.5% | 37.7% | 35.9% |
| Non-citizens | 33.5% | 26.7% | 26.5% | 24.4% | 25.7% | 22.3% |
| Representation type | Citizenship Status | 2017 to 2018 | 2018 to 2019 | 2019 to 2020 | 2020 to 2021 | 2021 to 2022 | 2022 to 2023 |
|---|---|---|---|---|---|---|---|
| Persons with disabilities | Canadian Citizens | 3.1% | 3.0% | 3.4% | 3.7% | 5.6% | 6.3% |
| Persons with disabilities | Permanent Residents | 0.9% | 0.8% | 1.0% | 1.1% | 1.6% | 1.6% |
| Persons with disabilities | Other Non-Citizens | 1.1% | 0.8% | 1.0% | 0.8% | 1.4% | 1.3% |
| Members of visible minorities | Canadian Citizens | 20.0% | 20.1% | 21.7% | 22.0% | 25.7% | 26.3% |
| Members of visible minorities | Permanent Residents | 42.1% | 38.4% | 42.7% | 44.2% | 49.6% | 49.3% |
| Members of visible minorities | Other Non-Citizens | 28.0% | 27.5% | 29.1% | 31.3% | 36.7% | 32.5% |
| Women | Canadian Citizens | 55.4% | 57.0% | 57.6% | 59.5% | 59.3% | 58.6% |
| Women | Permanent Residents | 44.7% | 46.4% | 47.0% | 50.3% | 51.4% | 51.1% |
| Women | Other Non-Citizens | 36.8% | 38.8% | 37.4% | 44.2% | 44.2% | 41.6% |
| Employment equity group by gender | 2017 to 2018 | 2018 to 2019 | 2019 to 2020 | 2020 to 2021 | 2021 to 2022 | 2022 to 2023 |
|---|---|---|---|---|---|---|
| Members of visible minorities - Women | 20.1% | 22.2% | 23.6% | 26.4% | 28.1% | 35.0% |
| Members of visible minorities – Men | 24.4% | 26.7% | 29.0% | 30.9% | 32.4% | 38.1% |
| Not members of visible minorities - Women | 7.5% | 9.5% | 9.8% | 11.1% | 11.8% | 16.4% |
| Not members of visible minorities - Men | 13.6% | 16.6% | 18.0% | 18.2% | 19.1% | 27.0% |
| Persons with disabilities - Women | 3.5% | 3.3% | 4.0% | 4.1% | 4.8% | 5.9% |
| Persons with disabilities - Men | 5.8% | 6.8% | 7.4% | 7.9% | 8.4% | 10.4% |
| Persons without disabilities - Women | 10.3% | 12.5% | 13.4% | 15.2% | 17.1% | 23.0% |
| Persons without disabilities – Men | 16.3% | 19.2% | 21.1% | 21.9% | 23.8% | 31.4% |
| Employment equity group by gender | 2017 to 2018 | 2018 to 2019 | 2019 to 2020 | 2020 to 2021 | 2021 to 2022 | 2022 to 2023 |
|---|---|---|---|---|---|---|
| Members of visible minorities– Women | 3.3% | 5.2% | 4.1% | 4.7% | 7.7% | 16.6% |
| Members of visible minorities– Men | 5.7% | 6.4% | 5.7% | 5.9% | 10.9% | 17.9% |
| Not members of visible minorities – Women | 1.2% | 1.5% | 1.5% | 1.4% | 1.9% | 3.8% |
| Not members of visible minorities – Men | 1.7% | 1.8% | 1.8% | 2.1% | 2.6% | 4.7% |
| Persons with disabilities – Women | 0.3% | 0.7% | 1.1% | 0.2% | 1.1% | 3.8% |
| Persons with disabilities – Men | 0.8% | 0.9% | 0.5% | 1.7% | 1.3% | 4.3% |
| Persons without disabilities – Women | 1.6% | 2.3% | 2.2% | 2.2% | 3.5% | 7.6% |
| Persons without disabilities – Men | 2.5% | 2.8% | 2.8% | 3.1% | 4.9% | 9.0% |
| Representation type | Applicants versus appointments | 2017 to 2018 | 2018 to 2019 | 2019 to 2020 | 2020 to 2021 | 2021 to 2022 | 2022 to 2023 |
|---|---|---|---|---|---|---|---|
| Persons with disabilities | Applicants | 1.0% | 0.8% | 1.0% | 1.0% | 1.5% | 1.5% |
| Persons with disabilities | Appointments | 0.9% | 1.2% | 1.5% | 1.5% | 2.0% | 3.9% |
| Members of visible minorities | Applicants | 37.7% | 35.1% | 38.3% | 40.0% | 45.4% | 43.1% |
| Members of visible minorities | Appointments | 41.8% | 47.5% | 47.0% | 47.8% | 57.8% | 62.2% |
| Women | Applicants | 42.3% | 44.1% | 43.8% | 48.3% | 49.0% | 47.6% |
| Women | Appointments | 47.7% | 51.7% | 52.8% | 51.6% | 51.8% | 57.1% |
| Representation type | Citizenship status | 2017 to 2018 | 2018 to 2019 | 2019 to 2020 | 2020 to 2021 | 2021 to 2022 | 2022 to 2023 |
|---|---|---|---|---|---|---|---|
| Persons with disabilities | Canadian Citizens | 3.7% | 3.8% | 4.2% | 4.9% | 6.3% | 7.9% |
| Persons with disabilities | Permanent Residents | 0.7% | 1.0% | 1.9% | 1.8% | 2.1% | 4.0% |
| Persons with disabilities | Other Non-Citizens | 2.0% | 1.9% | 0.0% | 0.0% | 0.9% | 2.9% |
| Members of visible minorities | Canadian Citizens | 18.3% | 20.0% | 22.4% | 22.3% | 23.5% | 25.7% |
| Members of visible minorities | Permanent Residents | 44.9% | 48.3% | 49.6% | 49.5% | 59.3% | 63.5% |
| Members of visible minorities | Other Non-Citizens | 25.5% | 44.4% | 37.3% | 40.2% | 47.3% | 48.3% |
| Women | Canadian Citizens | 58.6% | 57.0% | 58.3% | 60.2% | 60.4% | 61.4% |
| Women | Permanent Residents | 47.4% | 53.5% | 54.1% | 54.2% | 52.0% | 57.7% |
| Women | Other Non-Citizens | 49.0% | 45.4% | 48.0% | 40.2% | 50.0% | 51.2% |
| Representation type | Citizenship | Gender | 2017 to 2018 | 2018 to 2019 | 2019 to 2020 | 2020 to 2021 | 2021 to 2022 | 2022 to 2023 |
|---|---|---|---|---|---|---|---|---|
| Members of visible minorities | Citizens | Women applicants | 10.3% | 10.8% | 11.9% | 12.5% | 14.8% | 14.7% |
| Members of visible minorities | Citizens | Men applicants | 9.1% | 8.8% | 9.5% | 9.2% | 10.8% | 11.6% |
| Members of visible minorities | Citizens | Women appointments | 10.7% | 11.6% | 13.2% | 13.2% | 14.1% | 15.4% |
| Members of visible minorities | Citizens | Men appointments | 7.6% | 8.4% | 9.2% | 9.1% | 9.3% | 10.2% |
| Members of visible minorities | Permanent Residents | Women applicants | 19.5% | 18.8% | 21.0% | 23.0% | 26.4% | 26.6% |
| Members of visible minorities | Permanent Residents | Men applicants | 22.4% | 19.5% | 21.7% | 21.4% | 23.4% | 23.0% |
| Members of visible minorities | Permanent Residents | Women appointments | 19.7% | 25.1% | 25.5% | 27.9% | 30.0% | 36.8% |
| Members of visible minorities | Permanent Residents | Men appointments | 25.2% | 23.1% | 24.1% | 21.6% | 29.3% | 26.8% |
| Members of visible minorities | Other non-citizens | Women applicants | 13.2% | 13.1% | 13.8% | 16.6% | 19.3% | 16.4% |
| Members of visible minorities | Other non-citizens | Men applicants | 14.6% | 14.2% | 15.2% | 14.8% | 17.6% | 16.4% |
| Members of visible minorities | Other non-citizens | Women appointments | 11.8% | 24.1% | 17.6% | 14.9% | 25.0% | 27.3% |
| Members of visible minorities | Other non-citizens | Men appointments | 13.7% | 19.4% | 19.6% | 25.3% | 22.3% | 20.9% |
| Representation type | Gender | 2017 to 2018 | 2018 to 2019 | 2019 to 2020 | 2020 to 2021 | 2021 to 2022 | 2022 to 2023 |
|---|---|---|---|---|---|---|---|
| Citizens | All | 43.1% | 39.4% | 40.7% | 37.7% | 39.8% | 38.3% |
| Citizens | Members of visible minorities | 41.5% | 37.7% | 39.5% | 36.5% | 37.7% | 35.9% |
| Citizens | Members of visible minorities - Men | 40.1% | 37.0% | 38.5% | 36.3% | 37.2% | 35.1% |
| Citizens | Members of visible minorities- Women | 41.6% | 37.0% | 39.4% | 36.0% | 37.6% | 35.8% |
| Non-citizens | All | 31.1% | 26.0% | 26.1% | 24.6% | 25.9% | 22.4% |
| Non-citizens | Members of visible minorities | 33.5% | 26.7% | 26.5% | 24.4% | 25.7% | 22.3% |
| Non-citizens | Members of visible minorities- Men | 33.9% | 26.7% | 27.3% | 24.7% | 26.3% | 23.6% |
| Non-citizens | Members of visible minorities- Women | 32.2% | 25.8% | 25.1% | 23.8% | 25.1% | 20.9% |
| Employment equity group | 2017 to 2018 | 2018 to 2019 | 2019 to 2020 | 2020 to 2021 | 2021 to 2022 | 2022 to 2023 |
|---|---|---|---|---|---|---|
| Members of visible minorities | 20.6% | 22.9% | 24.9% | 27.3% | 28.3% | 35.4% |
| Not members of visible minorities | 9.7% | 12.1% | 12.9% | 13.7% | 14.5% | 20.5% |
| Persons with disabilities | 4.1% | 4.4% | 5.1% | 5.4% | 5.9% | 7.3% |
| Persons without disabilities | 12.4% | 14.8% | 16.2% | 17.5% | 19.4% | 26.0% |
| Women | 10.1% | 12.2% | 13.1% | 14.8% | 16.5% | 22.0% |
| Men | 16.1% | 18.9% | 20.8% | 21.5% | 23.1% | 30.5% |
| Members of visible minorities – Gender | Representation type | Citizens | Non-citizens | Total |
|---|---|---|---|---|
| Women | Applicants | 10.9% | 5.9% | 16.8% |
| Women | Appointments | 14.2% | 2.8% | 17.0% |
| Men | Applicants | 8.6% | 5.3% | 13.9% |
| Men | Appointments | 9.4% | 2.1% | 11.5% |
Page details
- Date modified: