
Original quantitative research – Socioeconomic factors and substances involved in poisoning-related emergency department visits in British Columbia, Canada

HPCDP Journal Home

Published by: The Public Health Agency of Canada
Date published: August 2021
ISSN: 2368-738X
Submit a manuscript
About HPCDP
Browse
Previous | Table of Contents | Next
Samantha Pawer, BScAuthor reference footnote 1; Fahra Rajabali, MScAuthor reference footnote 1; Alex Zheng, MScAuthor reference footnote 1; Ian Pike, PhDAuthor reference footnote 1Author reference footnote 2; Roy Purssell, MD, FRCPCAuthor reference footnote 3Author reference footnote 4; Atousa Zargaran, BScAuthor reference footnote 5; Shelina Babul, PhDAuthor reference footnote 1Author reference footnote 2Author reference footnote 5
https://doi.org/10.24095/hpcdp.41.7/8.02
This article has been peer reviewed.
Author references
Correspondence
Atousa Zargaran, F509-4480 Oak Street, Vancouver, BC V6H 3V4; Tel: 604-875-3044; Email: atousa.zargaran@cw.bc.ca
Suggested citation
Pawer S, Rajabali F, Zheng A, Pike I, Purssell R, Zargaran A, Babul S. Socioeconomic factors and substances involved in poisoning-related emergency department visits in British Columbia, Canada. Health Promot Chronic Dis Prev Can. 2021;41(7/8):211-21. https://doi.org/10.24095/hpcdp.41.7/8.02
Abstract
Introduction: Canada’s opioid crisis has taken thousands of lives, increasing awareness of poisoning-related injuries as an important public health issue. However, in British Columbia (BC), where overdose mortality rates are the highest in Canada, studies have not yet identified which demographic populations most often visit emergency departments (ED) due to all poisonings, nor which substances are most commonly involved. The aim of this study was to explore these gaps, after developing a methodology for calculating ED visit rates in BC.
Methods: Poisoning-related ED visit rates during fiscal years 2012/13 to 2016/17, inclusive, were calculated by sex, age group, poisoning substance and socioeconomic status, using a novel methodology developed in this study. ED data were sourced from the National Ambulatory Care Reporting System and population data from Statistics Canada’s 2016 (or 2011) census profiles.
Results: During the study period, there were an estimated 81 463 poisoning-related ED visits (351.2 per 100 000 population). Infants, toddlers, youth and those aged 20–64 years had elevated risks of poisoning-related ED visits. Rates were highest among those in neighbourhoods with the greatest material (607.8 per 100 000 population) or social (484.2 per 100 000 population) deprivation. Over time, narcotics and psychodysleptics became increasingly common poisoning agents, while alcohol remained problematic.
Conclusion: A methodology for estimating ED visit rates in BC was developed and applied to determine poisoning-related ED visit rates among various demographic groups within BC. British Columbians most vulnerable to poisoning have been identified, emphasizing the need for efforts to limit drug overdoses and excessive alcohol intoxication to reduce rates of these preventable injuries.
Keywords: poisoning, emergency service, social class, drug overdose, alcohol intoxication, adolescent
Highlights
- Between 1 April, 2012 and 31 March, 2017, there were about 81 463 poisoning-related emergency department visits in British Columbia, Canada.
- The highest poisoning-related emergency department visit rates were among individuals aged 25 to 44 years for males and 15 to 19 years for females, while for both sexes the lowest rate was among children aged 5 to 9 years.
- Broken down by age group and substance, the highest poisoning-related emergency department visit rate resulted from alcohol consumption among those aged 15 to 19 years.
- Poisoning-related emergency department visits were highest among those living in neighbourhoods with the greatest material and social deprivation.
- Overall, alcohol was the substance that most commonly resulted in poisoning-related emergency department visits; however, in 2016/17, narcotics and psychodysleptics surpassed alcohol as the substance type associated with the highest rate of poisoning-related emergency department visits.
Introduction
Many emergency department (ED) presentations in Canada are due to preventable injuries. In Ontario, Alberta and the Yukon, there were nearly 2 million injury-related ED visits in the 2017/18 fiscal year, 43 678 of which were unintentional poisonings.Footnote 1 In British Columbia (BC), unintentional and self-harm poisonings are both significant concerns,Footnote 2 though poisonings in BC have often been described by mortalities and hospitalizations, rather than by ED visits. For example, the most recent analysis of all-cause poisonings in BC looked at poisoning-related mortalities and hospitalizations, finding that they differed by cause and intent.Footnote 3
It is often posited that many patients seen in the ED for poisonings are middle-aged illicit drug users from marginalized communities such as Vancouver’s Downtown Eastside.Footnote 4 Supporting this supposition is evidence that residing in more deprived BC neighbourhoods increases the risk of drug overdose mortality.Footnote 5 Notably, 90% of those overdose deaths in 2016 involved opioids.Footnote 5 Similarly, opioid poisoning hospitalization rates across Canada were highest among those who were unemployed, resided in single-parent households or had the lowest income or education level.Footnote 6
Although socioeconomic status has been assessed for poisoning mortality and hospitalizations, since no relationship between deprivation and poisoning-related ED visits has yet been explored, we chose to include socioeconomic status in this study. Due to the current opioid crisis,Footnote 7 much of the recent poisoning work conducted in BC has focussed on opioids. However, because literature from other jurisdictions has found alcohol, rather than opioids, to be responsible for the greatest number of poisoning-related ED visits,Footnote 8 we selected poisoning substance as another variable of interest. These knowledge gaps highlight the need for determining not only the quantity of poisoning-related ED visits, but also how socioeconomic status may be involved and which substances most often lead to these visits.
The ability to compare ED utilization among different BC populations is limited. While a national database, the National Ambulatory Care Reporting System (NACRS), exists, there is currently no systematic approach to using this data to calculate ED visit rates in BC. This is because many hospitals in BC do not report to NACRS and therefore the data are underestimated and incomplete. Accordingly, we developed a method for estimating ED visit rates in BC, aiming to inform poisoning prevention efforts by identifying subpopulations at high risk for poisoning ED presentations, including the socioeconomic characteristics of high-risk neighbourhoods, and the substances that commonly result in these presentations.
Methods
Study design
In this retrospective study, we analyzed trends in poisoning-related ED visits in BC for five fiscal years between 1 April, 2012 and 31 March, 2017. Poisoning-related ED visits were defined as visits to the ED by patients for whom the most responsible or primary diagnosis was poisoning, which includes overdoses or ingesting substances in error. There may have been instances in which patients were suffering from a chronic condition due to substance use or substance disorder, and overdosed. These patients were included in the study, but further analysis of these patients was beyond scope of this study. The rates of poisoning-related ED visits were calculated by year, sex, age group and poisoning substance, as well as by material and social deprivation, according to dissemination area (DA) of residence. This study was approved by the UBC Children’s and Women’s Research Ethics Board (#H13-01321).
Data sources
ED data were obtained from NACRS, which began reporting in BC during the 2012/13 fiscal year, for the period 1 April, 2012 to 31 March, 2017, inclusive. BC hospitalization data were extracted from the Discharge Abstract Database, BC Ministry of Health, for the same period. For every patient in the NACRS system, demographic, administrative and clinical characteristics were collected. NACRS data are collected while patients are treated in the ED, and this information is held to a high standard by the internationally recognized Canadian Institute for Health Research’s Data and Information Quality Program. However, this dataset is limited because not all EDs in BC report to NACRS, resulting in the underrepresentation of certain regions and demographic groups. Discharge diagnosis in NACRS is captured using the International Statistical Classification of Diseases and Related Health Problems, 10th Revision, Canada (ICD-10-CA).Footnote 9 NACRS data were accessed via the Ministry of Health, and ICD-10-CA poisoning codes T36 to T65 were extracted. These codes cover a variety of substances, for example poisoning by drugs, medicaments and biological substances (T36–T50), toxic effect of alcohol (T51), toxic effect of organic solvents (T52), toxic effect of soaps and detergents (T55) and toxic effect of pesticides (T60).
Material and social deprivation quintiles obtained from Statistics Canada’s 2016 Census Profile (or from the 2011 profile if 2016 information was missing), the source from which BC population data were also obtained, were assigned to each patient according to their DA of residence.
Deprivation interpretation
In Canada, DAs are geographic regions inhabited by approximately 400 to 700 individuals.Footnote 10 Each DA is associated with a quintile on the deprivation index, which was developed and validatedFootnote 11 by the Institut national de santé publique du Québec (INSPQ). The index is divided into metrics describing material and social deprivation of those living within a DA. We selected a composite scoring system over individual measures of socioeconomic status, as this is favoured in the literature.Footnote 12 Material deprivation reflects the ownership of everyday goods and commodities, while social deprivation reflects social connectedness.Footnote 13 The index is based on six measurements for those aged 15 years or older that relate to health and either material or social deprivation. Metrics describing material deprivation include (1) the proportion of people without a high school diploma; (2) the employment-to-population ratio; and (3) average income. Metrics describing social deprivation include (4) the proportion of individuals living alone; (5) the proportion of people separated, divorced or widowed; and (6) the proportion of single-parent households.Footnote 13
Material and social deprivation quintiles range between one and five, each representing approximately 20% of the BC population. The first and fifth quintiles represent the least and most deprived neighbourhoods, respectively.
Poisoning-related ED visit rate calculations
Since many BC hospitals do not report to NACRS, our poisoning-related ED visit rate calculations included the number of poisonings at EDs that do report (NACRS hospitals) and estimates for those that do not (non-NACRS hospitals). Using the concept of the injury pyramid,Footnote 14 these estimates for non-NACRS hospitals were calculated using hospitalization numbers at all BC hospitals extracted from the Discharge Abstract Database.
First, the ratio of poisoning ED visits to poisoning hospitalizations was determined for NACRS hospitals (Figure 1, equation 1). For rate calculations throughout BC by year, sex, age group and deprivation quintile, one ratio encompassing all poisoning cases was used. Unique ratios were applied in calculations for each poisoning substance, as the ratios greatly varied among substances (from 0.43 for antiepileptic, sedative-hypnotic, antiparkinsonism and psychotropic drugs to 38.22 for alcohol).
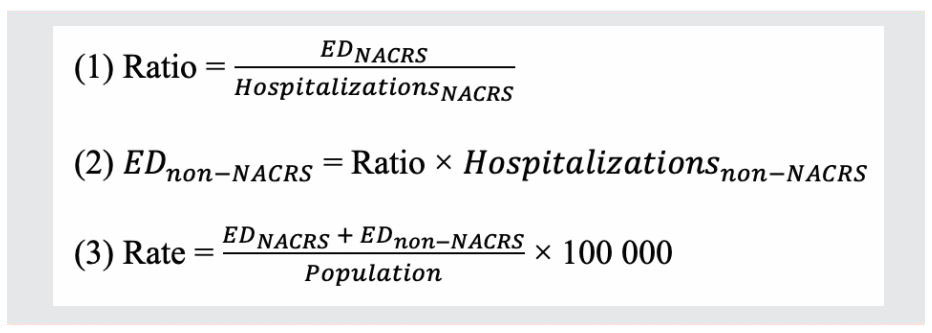
Figure 1 - Text description
This figure shows 3 formulas for calculating poisoning-related emergency department visit rates. They are the following:
- Ratio = EDNACRS ÷ HospitalizationsNACRS
- EDnon-NACRS = Ratio × Hospitalizationsnon-NACRS
- Rate = [(EDNACRS + EDnon-NACRS) ÷ Population] × 100 000
Abbreviations: ED, emergency department; EDNACRS, number of poisoning ED visits at hospitals reporting to NACRS; HospitalizationsNACRS, number of poisoning hospitalizations at hospitals reporting to NACRS; Hospitalizationsnon-NACRS, number of poisoning hospitalizations at hospitals not reporting to NACRS; NACRS, National Ambulatory Care Reporting System.
Note: This figure shows the equations used for calculating (1) the ratio of poisoning-related ED visits to poisoning-related hospitalizations at NACRS hospitals; (2) the estimated number of poisoning-related ED visits at non-NACRS hospitals (EDnon-NACRS); and (3) the rate per 100 000 population of poisoning-related ED visits in all British Columbia EDs.
Second, estimates for the number of ED visits at non-NACRS hospitals were generated using these ratios (Figure 1, equation 2). Finally, poisoning-related ED visit rates per 100 000 population were determined (Figure 1, equation 3). Currently, about 30% of hospital emergency departments report to NACRS in BC. Using this subset of hospitals that do report to NACRS (for which we know the actual number of ED visits), we determined the robustness and accuracy of the estimates using simulations in which only 30% of hospitals in this subset were reporting to NACRS. The hospitals were chosen at random for each simulation. Ten thousand simulations were conducted, and 95% of simulations resulted in estimates that fell within 40% of the actual number of ED visits.
Data analysis
We calculated annual and total poisoning ED visit rates per 100 000 population, along with Wald 95% confidence intervals. Non-BC residents were excluded from analyses, as were patients whose age or sex information was missing. When DAs were missing information from 2016, data from the 2011 Census Profile were used. For deprivation analyses, patients were excluded when information was missing from both the 2016 and 2011 census profiles.
Results
Total poisoning incidences
Between 1 April, 2012 and 31 March, 2017, there were approximately 81 463 (Table 1) poisoning-related ED visits in BC (351.2 per 100 000 population). Of these poisoning-related ED visits, 61 647 were at NACRS hospitals and an estimated 19 816 were at non-NACRS hospitals. For ED visits at NACRS hospitals, 2 and 25 patients were excluded due to missing age-group or sex information, respectively, resulting in a sample size of 81 436 patients.
| Characteristic | Total | 2012/13 | 2013/14 | 2014/15 | 2015/16 | 2016/17 | ||||||
|---|---|---|---|---|---|---|---|---|---|---|---|---|
| n | % | n | % | n | % | n | % | n | % | n | % | |
| Overall | 81 436 | 100.00 | 10 557 | 12.96 | 13 667 | 16.78 | 18 132 | 22.27 | 20 318 | 24.95 | 18 762 | 23.04 |
| Age group (years) | ||||||||||||
| 0–4 | 2 197 | 2.70 | 259 | 2.45 | 321 | 2.35 | 485 | 2.67 | 604 | 2.97 | 528 | 2.82 |
| 5–9 | 654 | 0.80 | 48 | 0.45 | 62 | 0.45 | 159 | 0.88 | 206 | 1.01 | 180 | 0.96 |
| 10–14 | 1 954 | 2.40 | 264 | 2.50 | 312 | 2.28 | 411 | 2.27 | 509 | 2.50 | 458 | 2.44 |
| 15–19 | 7 948 | 9.76 | 1 074 | 10.17 | 1 401 | 10.25 | 1 894 | 10.45 | 1 846 | 9.08 | 1 734 | 9.24 |
| 20–24 | 8 332 | 10.23 | 1 085 | 10.28 | 1 423 | 10.41 | 1 782 | 9.83 | 2 102 | 10.35 | 1 940 | 10.34 |
| 25–44 | 29 746 | 36.53 | 3 712 | 35.16 | 4 699 | 34.38 | 6 344 | 34.99 | 7 697 | 37.88 | 7 294 | 38.88 |
| 45–64 | 23 540 | 28.91 | 3 149 | 29.82 | 4 178 | 30.57 | 5 357 | 29.54 | 5 652 | 27.82 | 5 204 | 27.74 |
| 65–74 | 4 132 | 5.07 | 521 | 4.93 | 721 | 5.28 | 1 015 | 5.60 | 999 | 4.92 | 877 | 4.67 |
| 75+ | 2 933 | 3.60 | 446 | 4.23 | 550 | 4.02 | 686 | 3.78 | 704 | 3.47 | 547 | 2.92 |
| Sex | ||||||||||||
| Female | 34 949 | 42.92 | 5 030 | 47.64 | 6 056 | 44.31 | 7 755 | 42.77 | 8 413 | 41.41 | 7 695 | 41.02 |
| Male | 46 487 | 57.08 | 5 528 | 52.36 | 7 611 | 55.69 | 10 377 | 57.23 | 11 905 | 58.59 | 11 066 | 58.98 |
| Poisoning substance | ||||||||||||
| Alcohol | 28 017 | 43.44 | 3 982 | 49.40 | 5 594 | 49.98 | 7 409 | 51.82 | 6 870 | 43.07 | 4 162 | 27.77 |
| Unspecified drugs, medicaments and biological substances | 15 902 | 24.66 | 1 743 | 21.62 | 2 539 | 22.68 | 2 910 | 20.35 | 4 569 | 28.65 | 4 140 | 27.63 |
| Narcotics and psychodysleptics | 12 975 | 20.12 | 1 383 | 17.15 | 1 689 | 15.09 | 1 983 | 13.87 | 2 897 | 18.16 | 5 024 | 33.52 |
| Nonopioid analgesics, antipyretics and antirheumatics | 4 073 | 6.32 | 406 | 5.04 | 739 | 6.60 | 1 300 | 9.09 | 813 | 5.10 | 816 | 5.44 |
| Antiepileptic, sedative-hypnotic, antiparkinsonism and psychotropic drugs | 3 524 | 5.46 | 547 | 6.78 | 631 | 5.64 | 697 | 4.87 | 803 | 5.03 | 846 | 5.65 |
| Material quintile | ||||||||||||
| 1 | 10 629 | 14.03 | N/A | N/A | N/A | N/A | N/A | |||||
| 2 | 12 088 | 15.95 | ||||||||||
| 3 | 15 603 | 20.59 | ||||||||||
| 4 | 17 097 | 22.56 | ||||||||||
| 5 | 20 362 | 26.87 | ||||||||||
| Social quintile | ||||||||||||
| 1 | 14 542 | 19.19 | N/A | N/A | N/A | N/A | N/A | |||||
| 2 | 13 230 | 17.46 | ||||||||||
| 3 | 11 930 | 15.74 | ||||||||||
| 4 | 13 902 | 18.35 | ||||||||||
| 5 | 22 174 | 29.26 | ||||||||||
Data sources: Emergency department data were obtained from the National Ambulatory Care Reporting System; population data were obtained from Statistics Canada. |
||||||||||||
Analyses by year, sex and age group
Throughout the study period, the overall poisoning-related ED visit rate was 406.6 and 296.5 per 100 000 population among males and females, respectively. The highest rates were among individuals aged 25 to 44 years for males and 15 to 19 years for females. For both sexes, the lowest rate was among children aged 5 to 9 years (Table 2).
| Characteristic | Overall rate (95% CI) | Male rate (95% CI) | Female rate (95% CI) |
|---|---|---|---|
| Fiscal year | |||
| 2012/13 | 232.2 (227.8–236.6) | 244.7 (238.2–251.1) | 219.9 (213.8–226.0) |
| 2013/14 | 300.4 (295.3–305.4) | 339.7 (332.1–347.3) | 262.2 (255.6–268.8) |
| 2014/15 | 390.2 (384.6–395.9) | 449.7 (441.0–458.3) | 331.6 (324.2–339.0) |
| 2015/16 | 432.8 (426.8–438.7) | 511.0 (501.8–520.1) | 355.8 (348.2–363.3) |
| 2016/17 | 394.3 (388.7–400.0) | 468.7 (460.0–477.4) | 321.1 (313.9–328.3) |
| Age group (years) | |||
| 0–4 | 196.9 (188.7–205.2) | 207.0 (195.3–218.8) | 186.2 (174.7–197.7) |
| 5–9 | 57.4 (53.0–61.8) | 63.9 (57.4–70.3) | 50.5 (44.6–56.4) |
| 10–14 | 169.9 (161.1–176.1) | 80.1 (73.0–87.3) | 262.7 (249.3–276.1) |
| 15–19 | 569.2 (556.8–581.7) | 403.7 (389.1–418.3) | 748.4 (727.8–769.0) |
| 20–24 | 538.4 (526.9–549.9) | 556.9 (540.3–573.3) | 519.6 (503.5–535.7) |
| 25–44 | 475.2 (469.9–480.6) | 601.8 (593.1–610.4) | 350.8 (344.3–357.3) |
| 45–64 | 353.7 (349.2–358.2) | 452.9 (445.6–460.1) | 256.8 (251.4–262.2) |
| 65–74 | 187.2 (181.5–192.9) | 212.4 (203.7–221.1) | 162.9 (155.4–170.3) |
| 75+ | 170.8 (164.7–177.0) | 205.6 (195.3–215.8) | 143.9 (136.3–151.4) |
Data sources: Emergency department data were obtained from the National Ambulatory Care Reporting System; population data were obtained from Statistics Canada. |
|||
Yearly rates increased 1.9-fold from 2012/13 to 2015/16, levelling off in 2016/17 (Table 2). From 2012/13 to 2016/17, the rates among males and females significantly increased 1.9-fold and 1.5-fold, respectively (Table 2).
Annually, rates for males were higher than those for females within all age groups, except those aged 10 to 14 and 15 to 19 years. From 2012/13 to 2015/16, rates increased for every age group, before slightly decreasing in 2016/17. The increases of largest magnitude were among infants, toddlers and young children (aged 0–9 years), youth (aged 15–19 years) and those aged 20–64 years (Table 3).
| Age group (years) | 2012/13 rate (95% CI) |
2013/14 rate (95% CI) |
2014/15 rate (95% CI) |
2015/16 rate (95% CI) |
2016/17 rate (95% CI) |
|---|---|---|---|---|---|
| 0–4 | 116.2 (102.0–130.4) | 144.7 (128.9–160.5) | 218.6 (199.2–238.1) | 270.7 (249.1–292.3) | 233.5 (213.6–253.4) |
| 5–9 | 21.6 (15.5–27.7) | 27.5 (20.7–34.4) | 69.7 (58.9–80.6) | 89.2 (77.0–101.3) | 76.8 (65.6–88.0) |
| 10–14 | 119.0 (105.1–133.0) | 134.8 (119.8–149.7) | 178.4 (161.2–195.7) | 221.1 (201.9–240.3) | 197.2 (179.1–215.2) |
| 15–19 | 377.4 (354.9–400.0) | 496.4 (470.4–522.3) | 676.4 (646.1–706.8) | 666.5 (636.2–696.8) | 635.9 (606.1–665.7) |
| 20–24 | 352.7 (331.7–373.6) | 523.0 (495.9–550.1) | 558.7 (532.9–584.6) | 653.2 (625.4–681.0) | 593.1 (566.8–619.4) |
| 25–44 | 299.3 (289.7–308.9) | 377.7 (367.0–388.5) | 506.7 (494.2–519.1) | 613.1 (599.4–626.7) | 575.6 (562.4–588.8) |
| 45–64 | 239.3 (230.9–247.6) | 316.1 (306.5–325.7) | 402.6 (391.8–413.3) | 422.3 (411.3–433.2) | 386.0 (375.5–396.4) |
| 65–74 | 131.6 (120.3–142.9) | 171.8 (159.2–184.3) | 229.4 (215.3–243.5) | 215.0 (201.6–228.3) | 181.0 (169.0–192.9) |
| 75+ | 138.2 (125.4–151.0) | 165.3 (151.5–179.2) | 200.2 (185.2–215.2) | 199.3 (184.6–214.0) | 149.7 (137.2–162.2) |
Data sources: Emergency department data were obtained from the National Ambulatory Care Reporting System; population data were obtained from Statistics Canada. |
|||||
Analyses by deprivation index
Because DA information was missing for some patients, 0.28% (174/61 647) of poisonings were excluded when calculating poisoning-related ED visit rates by deprivation. Among the remaining patients, DA reconfiguration led to missing quintile information, resulting in the exclusion of 7.93% (4873/61 473) of poisoning-related ED visits in 7.86% (599/7617) of DAs. Of the deprivation cases that were included, 94.74% (53 625/56 600) were calculated using data from the 2016 Census Profile, while the remaining 5.26% (2975/56 600) were calculated using data from the 2011 Census Profile.
For material deprivation, there was no significant difference in rates from the first to the second quintile. There were significant increases between each of the subsequent quintiles, the largest being between the fourth and fifth quintiles, with a significant 1.6-fold increase (383.4 [95% CI: 370.6–396.2] to 607.8 [589.2–626.4] per 100 000 population; Figure 2A).
Figure 2. Poisoning-related emergency department visit rates per 100 000 population, by (A) material quintile, (B) social quintile and (C) material quintile, controlling for social quintile, British Columbia, 2012/13 to 2016/17
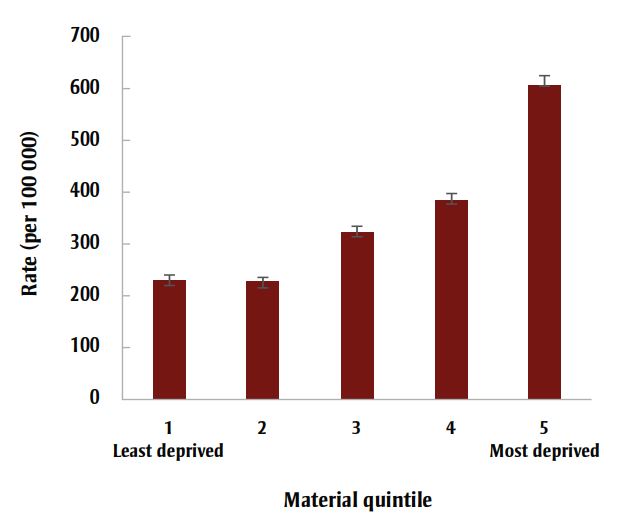
Figure 2A - Text description
| Material quintile | Poisoning-related emergency department visit rates per 100 000 population | |
|---|---|---|
| Rate | +/− 95% CI | |
| 1 (Least deprived) | 229.4 | 9.7 |
| 2 | 226.9 | 9 |
| 3 | 322.3 | 11.3 |
| 4 | 383.4 | 12.8 |
| 5 (Most deprived) | 607.8 | 18.6 |

Figure 2B - Text description
| Social quintile | Poisoning-related emergency department visit rates per 100 000 population | |
|---|---|---|
| Rate | +/− 95% CI | |
| 1 (Least deprived) | 323.1 | 11.7 |
| 2 | 272.4 | 10.4 |
| 3 | 273.8 | 11 |
| 4 | 322.2 | 12 |
| 5 (Most deprived) | 484.2 | 14.2 |

Figure 2C - Text description
| Material quintile | Social quintile | Poisoning-related emergency department visit rates per 100 000 population | |
|---|---|---|---|
| Rate | +/− 95% CI | ||
| 1 | 1 | 169.1 | 22.5 |
| 2 | 161.4 | 20.1 | |
| 3 | 179 | 21.3 | |
| 4 | 251.9 | 24 | |
| 5 | 297 | 18.7 | |
| 2 | 1 | 177.9 | 18.4 |
| 2 | 187.9 | 17.6 | |
| 3 | 192.4 | 18.3 | |
| 4 | 249.6 | 20.5 | |
| 5 | 341.2 | 26.8 | |
| 3 | 1 | 206.6 | 22 |
| 2 | 261.4 | 21.4 | |
| 3 | 268.7 | 21.3 | |
| 4 | 336.8 | 26 | |
| 5 | 572.8 | 36.2 | |
| 4 | 1 | 301.1 | 26.4 |
| 2 | 342.1 | 25 | |
| 3 | 323.7 | 27.3 | |
| 4 | 387.8 | 27.2 | |
| 5 | 591.5 | 38.8 | |
| 5 | 1 | 476.4 | 27.5 |
| 2 | 430.5 | 32.5 | |
| 3 | 509.4 | 42.8 | |
| 4 | 482.3 | 48.9 | |
| 5 | 1102 | 67.9 | |
Data sources: Emergency department data were obtained from the National Ambulatory Care Reporting System; population data were obtained from Statistics Canada.
Note: Error bars display 95% confidence intervals.
For social deprivation, rates were significantly higher among those living in the least connected neighbourhoods (484.2 [470.0–498.4] per 100 000 population), followed by the most connected neighbourhoods (323.1 [311.3–334.8] per 100 000 population). There were significant reductions in rates from the first to the second and third quintiles, leading to a slight parabolic relationship between poisoning ED visits and increasing social deprivation (Figure 2B).
When assessing patients simultaneously by material and social deprivation, individuals in the fifth material and social quintiles (i.e. most deprived) had the highest rate (1102.0 [1034.1–1169.8] per 100 000 population). The lowest rate was among people in the first material quintile and second social quintile (161.4 [141.3–181.5] per 100 000 population; Figure 2C).
Analyses by poisoning substance
Throughout the study period, the five most common poisoning substances resulting in ED visits were: (1) alcohol; (2) unspecified drugs, medicaments and biological substances (e.g. appetite depressants); (3) narcotics and psychodysleptics (e.g. opioids); (4) nonopioid analgesics, antipyretics and antirheumatics (e.g. acetaminophen); and (5) antiepileptic, sedative-hypnotic, antiparkinsonism and psychotropic drugs (e.g. central nervous system depressants; Table 4). Compared with females, males demonstrated higher rates for all substances except nonopioid analgesics, antipyretics and antirheumatics (Table 4).
| Characteristic | Alcohol rate (95% CI) |
Unspecified drugs, medicaments and biological substances rate (95% CI) | Narcotics and psychodysleptics rate (95% CI) |
Nonopioid analgesics, antipyretics and antirheumatics rate (95% CI) |
Antiepileptic, sedative-hypnotic, antiparkinsonism and psychotropic drugs rate (95% CI) |
|---|---|---|---|---|---|
| Overall | 120.8 (119.4–122.2) | 68.5 (67.4–69.6) | 55.9 (54.9–56.8) | 17.6 (17.0–18.1) | 15.1 (14.6–15.6) |
| Sex | |||||
| Male | 164.7 (162.3–167.0) | 69.4 (67.9–70.9) | 72.7 (71.2–74.3) | 12.7 (12.0–13.3) | 17.0 (16.3–17.8) |
| Female | 77.6 (76.0–79.2) | 67.6 (66.1–69.1) | 39.3 (38.2–40.5) | 22.4 (21.5–23.2) | 13.3 (12.6–13.9) |
| Age group (years) | |||||
| 0–4 | 1.4 (0.7–2.1) | 69.5 (64.7–74.4) | 6.2 (4.7–7.6) | 36.1 (32.5–39.6) | 2.2 (1.3–3.1) |
| 5–9 | – | 9.6 (7.8–11.4) | – | 2.0 (1.2–2.8) | 0.5 (0.1–0.9) |
| 10–14 | 40.7 (37.0–44.3) | 43.1 (39.3–46.8) | 2.7 (1.8–3.7) | 19.7 (17.1–22.2) | 4.2 (3.0–5.4) |
| 15–19 | 168.2 (161.4–175.0) | 133.7 (127.6–139.8) | 40.4 (37.0–43.7) | 54.7 (50.8–58.6) | 20.5 (18.1–22.9) |
| 20–24 | 156.9 (150.6–163.1) | 123.8 (118.3–129.3) | 104.0 (99.0–109.1) | 32.3 (29.4–35.1) | 29.8 (27.0–32.5) |
| 25–44 | 155.5 (152.4–158.6) | 89.6 (87.2–91.9) | 99.3 (96.9–101.8) | 17.3 (16.3–18.3) | 25.8 (24.5–27.0) |
| 45–64 | 162.5 (159.4–165.5) | 52.8 (51.0–54.5) | 53.5 (51.8–55.3) | 11.6 (10.8–12.4) | 12.9 (12.0–13.7) |
| 65–74 | 71.8 (68.2–75.3) | 33.4 (31.0–35.8) | 27.3 (25.2–29.5) | 7.7 (6.6–8.9) | 5.4 (4.4–6.4) |
| 75+ | 36.3 (33.4–39.1) | 50.5 (47.2–53.9) | 17.6 (15.6–19.6) | 7.8 (6.5–9.1) | 5.8 (4.7–6.9) |
Data sources: Emergency department data were obtained from the National Ambulatory Care Reporting System; population data were obtained from Statistics Canada. |
|||||
Common poisoning substances varied by age group. Rates among those aged 0 to 14 and over 75 years were greatest for unspecified drugs, medicaments and biological substances. Among those aged 15 to 74 years, rates were greatest for alcohol (Table 4).
Over the study period, rates followed different trends for the five most common substances (Figure 3A). Alcohol resulted in the highest rate from 2012/13 to 2015/16, reaching a peak in 2014/15 at 159.5 per 100 000 population (Figure 3A). In the 2014/15 fiscal year, the rate of alcohol-related poisoning ED visits was over 3.7-fold greater than that for narcotics and psychodysleptics (42.7 per 100 000 population); however, in 2016/17, narcotics and psychodysleptics became the most common substance resulting in poisoning ED visits (Figure 3A). Throughout the study period, the greatest increase was observed for narcotics and psychodysleptics poisonings, which had a 3.5-fold increase from 30.4 per 100 000 population in 2012/13 to 105.6 per 100 000 population in 2016/17 (Figure 3A).
Figure 3. Poisoning-related emergency department visit rates per 100 000 population, by (A) poisoning substance and fiscal year, (B) poisoning substance and material quintile and (C) poisoning substance and social quintile, British Columbia, 2012/13 to 2016/17

Figure 3A - Text description
| Substance by fiscal year | Poisoning-related emergency department visit rates per 100 000 population | |
|---|---|---|
| Rate | +/− 95% CI | |
| Alcohol | ||
| 2012/13 | 87.6 | 2.7 |
| 2013/14 | 122.9 | 3.2 |
| 2014/15 | 159.5 | 3.6 |
| 2015/16 | 146.3 | 3.5 |
| 2016/17 | 87.5 | 2.7 |
| Unspecified drugs, medicaments and biological substances | ||
| 2012/13 | 38.3 | 1.8 |
| 2013/14 | 55.8 | 2.2 |
| 2014/15 | 62.6 | 2.3 |
| 2015/16 | 97.3 | 2.8 |
| 2016/17 | 87.0 | 2.6 |
| Narcotics and psychodysleptics | ||
| 2012/13 | 30.4 | 1.6 |
| 2013/14 | 37.1 | 1.8 |
| 2014/15 | 42.7 | 1.9 |
| 2015/16 | 61.7 | 2.2 |
| 2016/17 | 105.6 | 2.9 |
| Nonopioid analgesics, antipyretics and antirheumatics | ||
| 2012/13 | 8.9 | 0.9 |
| 2013/14 | 16.2 | 1.2 |
| 2014/15 | 28.0 | 1.5 |
| 2015/16 | 17.3 | 1.2 |
| 2016/17 | 17.1 | 1.2 |
| Antiepileptic, sedative-hypnotic, antiparkinsonism and psychotropic drugs | ||
| 2012/13 | 12.0 | 1.0 |
| 2013/14 | 13.9 | 1.1 |
| 2014/15 | 15.0 | 1.1 |
| 2015/16 | 17.1 | 1.2 |
| 2016/17 | 17.9 | 1.2 |

Figure 3B - Text description
| Material quintile | Substance | Poisoning-related emergency department visit rates per 100 000 population | |
|---|---|---|---|
| Rate | +/− 95% CI | ||
| 1 | Alcohol | 55.1 | 4.8 |
| Unspecified drugs | 55.0 | 4.8 | |
| Narcotics and psychodysleptics | 39.4 | 4.0 | |
| Nonopioid analgesics, antipyretics and antirheumatics | 10.9 | 2.1 | |
| Antiepileptic, sedative-hypnotic, antiparkinsonism and psychotropic drugs | 13.5 | 2.4 | |
| 2 | Alcohol | 73.0 | 5.1 |
| Unspecified drugs | 47.3 | 4.1 | |
| Narcotics and psychodysleptics | 27.4 | 3.1 | |
| Nonopioid analgesics, antipyretics and antirheumatics | 13.6 | 2.2 | |
| Antiepileptic, sedative-hypnotic, antiparkinsonism and psychotropic drugs | 8.4 | 1.7 | |
| 3 | Alcohol | 104.1 | 6.4 |
| Unspecified drugs | 63.0 | 5.0 | |
| Narcotics and psychodysleptics | 50.9 | 4. 5 | |
| Nonopioid analgesics, antipyretics and antirheumatics | 16. 5 | 2.6 | |
| Antiepileptic, sedative-hypnotic, antiparkinsonism and psychotropic drugs | 13.3 | 2.3 | |
| 4 | Alcohol | 137.9 | 7.7 |
| Unspecified drugs | 72.9 | 5.6 | |
| Narcotics and psychodysleptics | 50. 3 | 4.7 | |
| Nonopioid analgesics, antipyretics and antirheumatics | 20.4 | 3.0 | |
| Antiepileptic, sedative-hypnotic, antiparkinsonism and psychotropic drugs | 13.0 | 2.4 | |
| 5 | Alcohol | 222.4 | 11.3 |
| Unspecified drugs | 92.1 | 7.3 | |
| Narcotics and psychodysleptics | 76.8 | 6.6 | |
| Nonopioid analgesics, antipyretics and antirheumatics | 25.6 | 3.8 | |
| Antiepileptic, sedative-hypnotic, antiparkinsonism and psychotropic drugs | 17.5 | 3.2 | |

Figure 3C - Text description
| Social quintile | Substance | Poisoning-related emergency department visit rates per 100 000 population | |
|---|---|---|---|
| Rate | +/− 95% CI | ||
| 1 | Alcohol | 125.4 | 7.3 |
| Unspecified drugs | 49.3 | 4.6 | |
| Narcotics and psychodysleptics | 25.6 | 3.3 | |
| Nonopioid analgesics, antipyretics and antirheumatics | 14.1 | 2.4 | |
| Antiepileptic, sedative-hypnotic, antiparkinsonism and psychotropic drugs | 6.7 | 1.7 | |
| 2 | Alcohol | 92.8 | 6.1 |
| Unspecified drugs | 53.7 | 4.6 | |
| Narcotics and psychodysleptics | 32.2 | 3. 6 | |
| Nonopioid analgesics, antipyretics and antirheumatics | 15.8 | 2.5 | |
| Antiepileptic, sedative-hypnotic, antiparkinsonism and psychotropic drugs | 8.4 | 1.8 | |
| 3 | Alcohol | 80.8 | 6.0 |
| Unspecified drugs | 56.5 | 5.0 | |
| Narcotics and psychodysleptics | 37.3 | 4.1 | |
| Nonopioid analgesics, antipyretics and antirheumatics | 15.8 | 2.6 | |
| Antiepileptic, sedative-hypnotic, antiparkinsonism and psychotropic drugs | 10.0 | 2.1 | |
| 4 | Alcohol | 109.3 | 7.0 |
| Unspecified drugs | 62.6 | 5.3 | |
| Narcotics and psychodysleptics | 45.0 | 4.5 | |
| Nonopioid analgesics, antipyretics and antirheumatics | 16.1 | 2.7 | |
| Antiepileptic, sedative-hypnotic, antiparkinsonism and psychotropic drugs | 12.3 | 2.3 | |
| 5 | Alcohol | 146.0 | 7.8 |
| Unspecified drugs | 97.6 | 6.4 | |
| Narcotics and psychodysleptics | 93.5 | 6.3 | |
| Nonopioid analgesics, antipyretics and antirheumatics | 22.0 | 3.0 | |
| Antiepileptic, sedative-hypnotic, antiparkinsonism and psychotropic drugs | 26.3 | 3.3 | |
Data sources: Emergency department data were obtained from the National Ambulatory Care Reporting System; population data were obtained from Statistics Canada.
Note: Error bars display 95% confidence intervals.
As material deprivation increased, high poisoning-related ED visit rates were largely attributable to alcohol intoxication (Figure 3B). Of all material or social quintiles, the fifth (most deprived) material quintile had the highest rate of alcohol poisoning ED visits (222.4 per 100 000 population), while the fifth social quintile had the highest rate due to unspecified drugs, medicaments and biological substances (97.6 per 100 000 population), as well as narcotics and psychodysleptics (93.5 per 100 000 population; Figure 3C). Within the social quintiles, the highest rate resulted from alcohol intoxication of those living in the least connected neighbourhoods (146.0 per 100 000 population).
Discussion
This study identified demographic characteristics and poisoning substances associated with increased poisoning-related ED visits in BC for the five fiscal years from 2012/13 to 2016/17. Poisoning-related ED visit rates for males and females appeared to diverge throughout the study period, with males having significantly higher rates over time, as is consistent with existing literature.Footnote 15
Rates of poisoning-related ED visits increased significantly for both sexes between 2012/13 and 2015/16, especially for infants, toddlers and young children (aged 0–9 years), youth (aged 15–19 years) and those aged 20–64 years. A marked increase in poison centre calls in the United States was noted from 2000 to 2010 concerning children aged 0 to 5 years, largely due to increasing numbers of prescription and nonprescription drug ingestions,Footnote 16 which could help explain the findings in this study. The growing number of opioid overdoses has also contributed to increasing ED visits in other jurisdictions,Footnote 17 which may offer an explanation for the increased rate among those aged 15 to 64 years.
Opioids are narcotics, the substances that increased most in frequency throughout the study period, particularly in the two fiscal years 2015/16 and 2016/17, coinciding with the emergence of the opioid crisis in BC. Narcotics and psychodysleptics surpassed alcohol as the leading cause of poisoning-related ED visits for the first time in 2016/17. At that time, a decrease in alcohol-related poisoning ED visits may have resulted from a liquor policy review that gradually reformed BC liquor laws between 2014 and 2017.Footnote 18 Nevertheless, alcohol is a key poisoning substance resulting in ED visits in BC, where alcohol-related hospitalizations are higher than in all other Canadian provinces,Footnote 19 highlighting the lack of attention to safe alcohol consumption in BC. Meanwhile, existing alcohol regulation policies at the federal level in Canada fail to target the most vulnerable populations.Footnote 20
Alcohol was the substance most commonly involved in poisoning-related ED visits over the study period, particularly among youth. This is of great concern, as youth aged 15 to 19 years demonstrated the highest rates of alcohol-related ED visits compared with all other age groups. Youth aged 15 to 19 years also had the highest rate for all poisoning-related ED visits, regardless of substance, identifying youth poisoning prevention as an important public health focus.
Individuals in their teenage years are susceptible to the influences of peer pressure when choosing to participate in underage alcohol consumption and illicit drug use,Footnote 21Footnote 22 raising concerns that as more adolescents engage in such activities, the number of poisoning-related patients may continue to increase. The increase in poisonings among youth aged 15 to 19 years is worrisome, not only because of the harm caused to young lives, but also because poisoned youth require more health care resources relative to peers with other health concerns.Footnote 23
A large portion of this burden can be attributed to youth living in families of lower socioeconomic status, as evidence supports that these individuals are at higher risk for engaging in substance use.Footnote 24 For context, the per capita hospital care cost in Manitoba was 73% higher for those living in neighbourhoods with the lowest socioeconomic statuses, compared to those with the highest.Footnote 25
Such findings help to explain our results that poisoning-related ED visit rates generally increased with material deprivation. However, there was a less prominent relationship between poisoning-related ED visit rates and social deprivation. Counterintuitively, rates were significantly higher for those in the most socially connected quintile (the first one) than those in the second and third quintiles. While this result was unexpected, previous work identified a significant positive association between social capital and binge drinking among high school students,Footnote 26 aligning with our findings that high poisoning-related ED visit rates resulted from alcohol consumption among youth and all age groups living in the most socially connected neighbourhoods. This evidence may assist in identifying demographic populations that would benefit from poisoning prevention initiatives, particularly those related to alcohol. Given the high rates of alcohol-related ED visits among youth aged 15 to 19 years, additional policies to restrict those under the age of majority from accessing alcohol may be useful to decrease the number of poisoning events in BC.
As hinted at by the increasing rate of poisoning-related ED visits attributed to narcotics and psychodysleptics throughout the study period, efforts to reduce the severity of the opioid crisis in BC may in turn decrease ED burden. Accordingly, the province could implement opioid prescription monitoring programs, to help reduce the likelihood of opioid prescriptions leading to overdoses. An alternative approach may be to continue pursuing the decriminalization of illicit drugs, which was shown to decrease drug-related morbidity and mortality in Portugal since being implemented in 2001.Footnote 27
Future studies may focus on developing a multivariable modelling methodology to improve calculations of ED visit rates in BC. Such a methodology could be used in the future to further identify demographic groups in BC at high risk for poisoning-related ED visits, by conducting analyses that consider additional factors such as ethnicity or psychometric properties. As well, the need still exists to identify regional poisoning-related ED visit rates in the province. This additional information would contribute to a better understanding of which BC areas and demographic groups would benefit the most from poisoning prevention strategies.
It is important to continue to enhance efforts to prevent poisonings, which are a leading cause of hospitalization and death in BC.Footnote 3 Evidence from public health and injury prevention literature suggests that much can be done to prevent poisonings at all ages, including the positive impact that physicians can have in direct patient counselling and as a credible voice in the community.Footnote 28Footnote 29 The importance of prevention efforts to reduce the social and economic burden of these injuries, and in particular, to help reduce ED wait times to improve patient care, cannot be understated.
Strengths and limitations
One strength of this study is that it explored the relationships between deprivation and all causes of poisoning-related ED visits, topics that were lacking in the existing Canadian literature. Additionally, we developed and used a methodology for estimating ED visit rates using NACRS data in BC.
Although this study explored novel public health issues, it is not without limitations. NACRS data are neither systematically nor comprehensively collected by BC hospitals. Because the number of ED visits at hospitals not reporting to NACRS had to be estimated, ED visit rates were influenced by the number of poisoning ED visits and admissions at NACRS hospitals, which may disproportionately represent certain regions and demographics. This effect may be more pronounced when comparing rates by sex, because hospitalizations and ED visit trends differed; while poisoning ED visits were greater for males, hospitalizations were greater for females.
The ED visit rate calculation methodology requires a statistical assumption that the ED-to-hospitalization ratio for poisonings is the same (or very similar) at NACRS and non-NACRS hospitals. Without accessible ED data from non-NACRS hospitals, it is impossible to compare the two ratios empirically. This methodology has not been formally validated, although in our assessment of its robustness, we found that 95% of simulations produced estimates within 40% of the actual number of ED visits, which by itself is a limitation. In addition, the method used to calculate poisoning-related ED visits is not a multivariable modelling approach, and does not adjust rates for important covariates such as ethnicity or geography.
An additional limitation is that external causes of injury are not reported to NACRS in BC. This means that ED visits relating to poisoning by intent could not be assessed.
Material and social deprivation quintiles were assigned to each patient based on their DA of residence, creating an ecological fallacy that applies neighbourhood characteristics to individuals. The deprivation index measures household material and social factors, but does not account for external support. Additionally, patients with missing DAs that could not be matched to their associated deprivation quintiles were excluded from the analyses.
Finally, because de-identified data were used, events with multiple ED visits may have been double counted.
Conclusion
Poisoning-related ED visit rates in BC increased dramatically in the five fiscal years from 2012/13 to 2016/17. High-risk groups include infants, toddlers, youth, those aged 20 to 64 years, those with high material deprivation and those with the least or greatest social connectedness. While the opioid crisis is a BC public health emergency, alcohol intoxication, as suggested by this study, is also a problematic public health issue for local EDs. This study indicates the need for future research and consideration of the role that physicians can play regarding poisoning prevention strategies targeted at vulnerable demographic populations in BC, including specific messages focussed on safe alcohol consumption, particularly among teenagers and young adults.
Conflicts of interest
None.
Authors’ contributions and statement
SB and AZ conceptualized the study. FR led data curation. AZ developed the rate calculation methodology. SP conducted data analysis and visualization, guided by FR, AZ and IP. SP drafted the manuscript. All authors contributed to reviewing the manuscript and read and approved the final manuscript.
The content and views expressed in this article are those of the authors and do not necessarily reflect those of the Government of Canada.
Page details
- Date modified: