
Tuberculosis drug resistance in Canada

 Download this article as a PDF (574 KB - 6 pages)
 Published by: The Public Health Agency of Canada
Issue: Volume 43-11: Antimicrobial resistance and One Health
Date published: November 2, 2017
ISSN: 1481-8531
Submit a manuscript
About CCDR
Browse
Volume 43-11, November 2, 2017: Antimicrobial resistance and One Health
Surveillance
Tuberculosis drug resistance in Canada: 2006–2016
V Gallant1, J Vachon1*, W Siu1
Affiliation
1 Centre for Communicable Disease and Infection Control, Public Health Agency of Canada, Ottawa, ON
Correspondence
Suggested citation
Gallant V, Vachon J, Siu W. Tuberculosis drug resistance in Canada: 2006–2016. Can Commun Dis Rep. 2017;43(11):236-41. https://doi.org/10.14745/ccdr.v43i11a05
Abstract
Background: Drug-resistant strains of tuberculosis (TB) pose a serious threat to TB prevention and control efforts. The Canadian Tuberculosis Laboratory Surveillance System (CTBLSS) was created in 1998 to monitor emerging trends and patterns in TB drug resistance in Canada.
Objective: To present a descriptive overview of TB drug resistance data collected through the CTBLSS for the years 2006 to 2016 in Canada, with a focus on 2016.
Methods: The CTBLSS is an isolate-based surveillance system designed to collect data on TB drug resistance across Canada. Each year, data are collected and analyzed by the Public Health Agency of Canada (PHAC) and then validated by the submitting laboratory.
Results: In 2016, anti-tuberculosis drug susceptibility test results were reported for 1,452 isolates. The proportion of TB drug-resistant strains remained relatively stable with 108 (7.4%) of the isolates classified as monoresistant, five (0.3%) isolates as polyresistant and 17 (1.2%) as multidrug-resistant TB (MDR-TB) strains. In 2016, there were no extensively drug-resistant TB (XDR-TB) isolates identified. Males accounted for 792 (54.5%) of all reported isolates and 64 (49.2%) of the resistant strains and females accounted for 11 (64.7%) of the MDR-TB strains. Between 2006 and 2016, individuals between 15 and 44 years of age comprised 47.4% of all reported isolates, 54.0% of isolates showing any resistance and 72.3% of MDR-TB strains.
Conclusion: TB drug resistance levels have been relatively low and stable over the past 11 years and have remained below the global average since national surveillance began. However, with growing worldwide concern about drug resistance and the emergence of XDR-TB, the CTBLSS will remain vital to the monitoring of TB drug resistance in Canada.
Introduction
Tuberculosis (TB), an airborne infectious disease caused by the bacterium Mycobacterium tuberculosis, remains a major cause of morbidity and mortality in many parts of the world. In 2015, there were an estimated 10.4 million new TB cases worldwide, and 1.8 million people died from this curable diseaseFootnote 1. While the majority of TB cases are caused by strains that are susceptible to the best available TB drugs, drug resistance is a major concern for TB control. Whereas the average length of time to treat a person with fully susceptible TB is between six and nine months, treatment of drug-resistant TB may require 12 to 18 months (and possibly longer) with drugs that are more expensive but less effective and potentially more toxicFootnote 2.
Drug-resistant strains of tuberculosis (TB) pose a serious threat to TB prevention and control efforts. Although it has not been a major public health issue in Canada, drug resistance has the potential to become one as Canadians frequently travel abroad and many individuals immigrate to Canada from countries with high TB rates and associated drug resistance.
The Canadian Tuberculosis Laboratory Surveillance System (CTBLSS) was established in 1998. It is a collaboration between federal, provincial and territorial governments and the Canadian Tuberculosis Laboratory Technical Network (CTLTN), a pan-Canadian network of technical and scientific heads of provincial and territorial TB laboratories. The CTBLSS is managed by the Centre for Communicable Diseases and Infection Control (CCDIC) within the Public Health Agency of Canada (PHAC).
The primary objective of the CTBLSS is to monitor emerging trends and patterns in TB drug resistance in Canada. This surveillance report presents a descriptive overview of data for the years 2006 to 2016, with a focus on 2016, on resistance to first- and second-line TB drugs in Canada. The results are disaggregated by province/territory and, where feasible, by sex and/or age group. The CTBLSS captures minimal demographic information (age, sex and province or territory only). Therefore, no direct observations about drug resistance related to other demographic factors, including ethnicity, are made. As the primary source of national data on TB drug resistance in Canada, the data presented here are intended to inform public health action as well as policy and program development and assessment.
Previously, these data were published annually in a stand-alone report entitled Tuberculosis: Drug Resistance in Canada. This is the first iteration of the report to be published in the Canada Communicable Disease Report (CCDR). The data presented in this report are the most up-to-date at the time of publication and replace those previously published. Supplementary data tables are available onlineFootnote 3.
Methods
The CTBLSS is an isolate-based surveillance system designed to collect data on TB drug resistance across Canada. TB drug resistance is identified through susceptibility testing of biological specimens (isolates) collected from individuals with culture-positive TBFootnote 2. Details on the CTBLSS methods of data collection, data management and other laboratory processes have been previously describedFootnote 4. As well, a list of recommended first- and second-line anti-tuberculosis drugs and the recommended critical concentrations to be used for routine testing are presentedFootnote 4.
All participating laboratories tested for resistance to the four first-line antibiotics (isoniazid, ethambutol, rifampin and pyrazinamide) except for the Public Health and Microbiology Reference Laboratory in British Columbia, which did not routinely test for resistance to pyrazinamide. If resistance to any of the other three first-line drugs was detected, British Columbia subsequently tested the isolate for resistance to pyrazinamide. For all laboratories, results for second-line drug susceptibility testing were submitted for isolates showing resistance to isoniazid and rifampin in order to identify extensively drug-resistant TB (XDR-TB) isolates. Table 1 describes TB drug resistance patterns as defined in the Canadian Tuberculosis StandardsFootnote 2.
| Resistance pattern | Definition |
|---|---|
| Monoresistance | Resistance to one first-line anti-tuberculosis drug only (isoniazid, rifampin, ethambutol or pyrazinamide). |
| Polyresistance | Resistance to more than one first-line anti-tuberculosis drug, not including the combination of isoniazid and rifampin. |
| Multidrug-resistant tuberculosis (MDR-TB) | Resistance to isoniazid AND rifampin with or without resistance to other anti-tuberculosis drugs. |
| Extensively drug-resistant tuberculosis (XDR-TB) | Resistance to isoniazid AND rifampin AND any fluoroquinolone AND at least one of the three injectable second-line drugs (amikacin, capreomycin or kanamycin). |
Drug susceptibility test (DST) results (sensitive/resistant/not done) for all Mycobacterium tuberculosis complex (MTBC) isolates demonstrated on culture, specifically M. tuberculosis, M. africanum, M. canetti, M. caprae, M. microti, M. pinnipedii or M. bovis, were voluntarily submitted to PHAC by provincial TB laboratories for inclusion in the CTBLSS. Data were submitted to PHAC either through the manual completion of a standard reporting form (M. tuberculosis Complex Antimicrobial Susceptibility Reporting Form) or electronicallyFootnote 5.
Standardized data recoding procedures were applied to all data to create a national dataset. All raw data (paper forms and electronic datasets) were retained in compliance with PHAC's directive for the collection, use and dissemination of information relating to public health.
No statistical procedures were used for comparative analyses, nor were any statistical techniques applied to account for missing data. Data in tables with small cell sizes (n=<5) were not suppressed, since disclosure was not deemed to pose any risk of identifying individual cases. These procedures were in line with the directive for the collection, use and dissemination of information relating to public health. The data presented in this report were extracted from the CTBLSS database on March 2017 and have been validated by the reporting laboratories. Microsoft Excel 2010 and SAS Enterprise Guide (SAS EG) v5.1 software were used for data cleaning and analysis.
Results
In 2016, anti-tuberculosis DST results for 1,463 isolates were reported to PHAC. Of these, 11 (0.8%) isolates were identified as M. bovis Bacillus Calmette–Guerin and were excluded from further analyses. Of the remaining 1,452 isolates analyzed, 843 (58.1%) were reported as MTBC where the species were known (830 were M. tuberculosis, nine were M. africanum and four were M. bovis) and 609 (41.9%) were MTBC of an unknown species (data not shown) (Supplementary Table 1).
TB drug resistance patterns
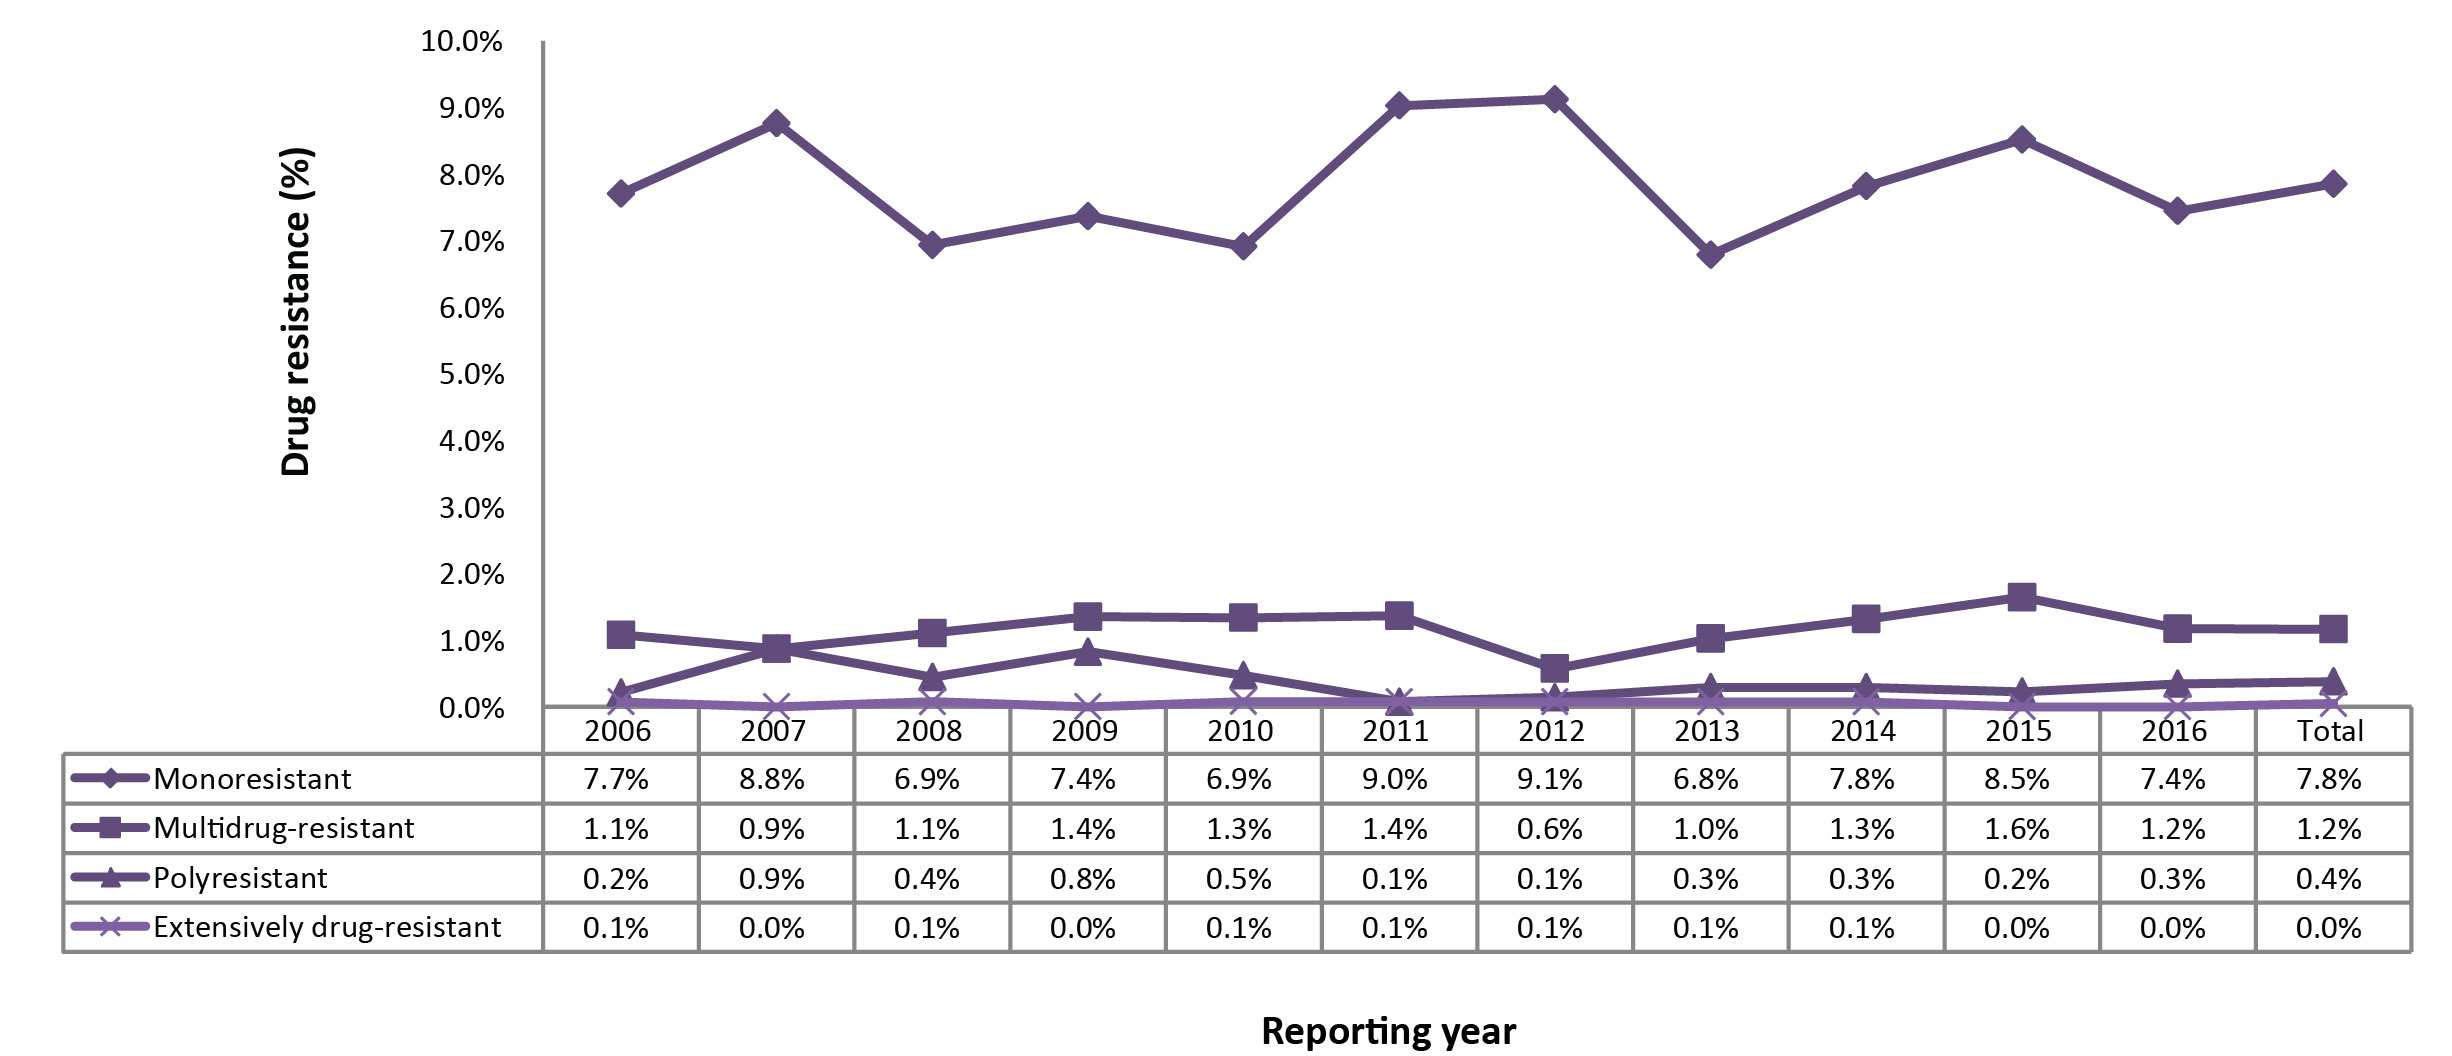
In 2016, 1,322 (91.0%) of the tested isolated were sensitive to all four first-line TB drugs. The proportion of TB drug-resistant isolates remained low with 108 (7.4%) of the isolates classified as monoresistant, five (0.3%) as polyresistant and 17 (1.2%) as multidrug-resistant TB (MDR-TB) strains (Figure 1).
Figure 1: Tuberculosis drug resistance patterns as a percentage of isolates tested, Canada, 2006 to 2016
Text description: Figure 1
Figure 1: Tuberculosis drug resistance patterns as a percentage of isolates tested, Canada, 2006 to 2016
| Drug Resistance | 2006 | 2007 | 2008 | 2009 | 2010 | 2011 | 2012 | 2013 | 2014 | 2015 | 2016 | Total |
|---|---|---|---|---|---|---|---|---|---|---|---|---|
| Monoresistant | 7.70% | 8.80% | 6.90% | 7.40% | 6.90% | 9.00% | 9.10% | 6.80% | 7.80% | 8.50% | 7.40% | 7.80% |
| Multidrug-resistant | 1.10% | 0.90% | 1.10% | 1.40% | 1.30% | 1.40% | 0.60% | 1.00% | 1.30% | 1.60% | 1.20% | 1.20% |
| Polyresistant | 0.20% | 0.90% | 0.40% | 0.80% | 0.50% | 0.10% | 0.10% | 0.30% | 0.30% | 0.20% | 0.30% | 0.40% |
| Extensively drug-resistant | 0.10% | 0.00% | 0.10% | 0.00% | 0.10% | 0.10% | 0.10% | 0.10% | 0.10% | 0.00% | 0.00% | 0.00% |
For the period 2006 to 2016, DST results were reported for 14,872 isolates (Supplementary Table 1). Monoresistance was the most frequent pattern reported, representing approximately 1,167 (7.8%) of all the isolates tested over the period. In total, 173 (1.2%) of the isolates were identified as MDR-TB (excluding XDR-TB) and seven (<0.1%) of the isolates were identified as XDR-TB. While there have been small fluctuations in the proportion of isolates showing various resistance patterns, the results have remained consistent during the 11-year period from 2006 to 2016 (Figure 2; Supplementary Table 2).
Figure 2: Percentage of isolates tested with any resistance to isoniazid, pyrazinamide, rifampin or ethambutol, Canada, 2006 to 2016

Text description: Figure 2
Figure 2: Percentage of isolates tested with any resistance to isoniazid, pyrazinamide, rifampin or ethambutol, Canada, 2006 to 2016
| Reporting year | Any resistance to isoniazid | Any resistance to rifampin | Any resistance to ethambutol | Any resistance to pyrazinamide |
|---|---|---|---|---|
| 2006 | 7.30% | 1.70% | 0.90% | 1.50% |
| 2007 | 8.70% | 1.00% | 1.80% | 2.70% |
| 2008 | 7.50% | 1.40% | 1.00% | 2.10% |
| 2009 | 8.50% | 1.60% | 1.30% | 1.70% |
| 2010 | 7.90% | 1.40% | 0.80% | 2.40% |
| 2011 | 9.20% | 1.60% | 0.70% | 2.30% |
| 2012 | 7.90% | 0.70% | 0.30% | 2.80% |
| 2013 | 6.80% | 1.20% | 0.70% | 2.20% |
| 2014 | 7.70% | 1.80% | 0.40% | 2.60% |
| 2015 | 8.20% | 1.80% | 0.70% | 3.40% |
| 2016 | 7.80% | 1.20% | 0.70% | 3.00% |
| Total | 7.90% | 1.40% | 0.80% | 2.50% |
Any first-line drug resistance
In 2016, ethambutol, isoniazid and rifampin susceptibility results were available for all 1,452 isolates. The drug susceptibility test results to pyrazinamide were reported for 1,254 (86.4%) isolates. As a proportion of those tested, 113 (7.8%) were resistant to isoniazid, 38 (3.0%) were resistant to pyrazinamide, 18 (1.2%) were resistant to rifampin and 10 (0.7%) were resistant to ethambutol (Supplementary Table 2). Overall, 130 (9.0%) of the isolates were resistant to at least one of the first-line drugs. Between 2006 and 2016, the proportion of reported isolates with resistance to at least one of the four first-line tuberculosis medications was stable over time (Figure 2). Resistance to isoniazid alone or in combination with other drugs varied between 7.5 and 9.2% of isolates tested. Resistance to ethambutol, rifampin or pyrazinamide remained below 3.5% (Figure 2).
Monoresistance
In 2016, 130 (9.0%) of the total TB isolates were reported to be resistant to at least one of the four first-line drugs. Of those, 108 (83.1%) were monoresistant. Of the monoresistant isolates, 91 (84.3%) were resistant to isoniazid, 16 (14.8%) were resistant to pyrazinamide and one (0.9%) was resistant to rifampin. No isolates were found to be monoresistant to ethambutol (Supplementary Table 3 - Table 15; data not tabulated across tables).
Between 2006 and 2016, 1,167 (7.8%) isolates were found to be monoresistant to one of the four first-line TB drugs. Of these, isoniazid resistance was the most frequently reported with 946 (81.1%) of the isolates (Figure 3). During this period, 29 (2.5%) of the monoresistant isolates were found to be resistant to rifampin. On average, one to three rifampin monoresistant isolates were reported each year from 2006 to 2016 (Figure 3; Supplementary Table 3 - Table 15; data not tabulated across tables).
Figure 3: Percentage of monoresistant isolates resistant to isoniazid, pyrazinamide, rifampin, or ethambutol, Canada, 2006 to 2016

Text description: Figure 3
Figure 3: Percentage of monoresistant isolates resistant to isoniazid, pyrazinamide, rifampin, or ethambutol, Canada, 2006 to 2016
| Isolates | 2006 | 2007 | 2008 | 2009 | 2010 | 2011 | 2012 | 2013 | 2014 | 2015 | 2016 | Total |
|---|---|---|---|---|---|---|---|---|---|---|---|---|
| Isoniazid (INH) | 76.60% | 80.20% | 85.10% | 85.70% | 87.50% | 85.70% | 78.10% | 79.60% | 77.60% | 74.60% | 84.30% | 81.10% |
| Rifampin (RMP) | 7.50% | 1.80% | 3.20% | 3.10% | 0.00% | 1.70% | 0.80% | 2.20% | 4.70% | 1.80% | 0.90% | 2.50% |
| Ethambutol (EMB) | 2.80% | 4.50% | 1.10% | 1.00% | 1.10% | 0.00% | 0.80% | 0.00% | 0.00% | 0.00% | 0.00% | 1.00% |
| Pyrazinamide (PZA) | 13.10% | 13.50% | 10.60% | 10.20% | 11.40% | 12.60% | 20.30% | 18.30% | 17.80% | 23.70% | 14.80% | 15.30% |
Polyresistant, multidrug-resistant and extensively drug-resistant TB
In 2016, five (0.2%) of the isolates were resistant to two or more of the first-line drugs (excluding the combination of isoniazid and rifampin) and were therefore classified as polyresistant. Two isolates were resistant to isoniazid and ethambutol and three were resistant to isoniazid and pyrazinamide.
Between 2006 and 2016, 54 (0.4%) of the isolates were identified as polyresistant. Of these, 23 (42.6%) were resistant to isoniazid and ethambutol, 24 (44.4%) were resistant to isoniazid and pyrazinamide and one was resistant to ethambutol and pyrazinamide. The remaining six (11.1%) isolates were resistant to isoniazid, ethambutol and pyrazinamide (Supplementary Table 3 - Table 15; data not tabulated across tables).
In 2016, 17 (1.2%) of the isolates tested were resistant to isoniazid and rifampin. Of these, six (35.3%) were resistant to only isoniazid and rifampin, four (23.5%) were resistant to isoniazid, rifampin and ethambutol, and three (17.6%) were resistant to isoniazid, rifampin and pyrazinamide. Finally, four (23.5%) of the isolates were resistant to all four of the first-line drugs (Figure 4; Supplementary Table 17).
For the period 2006 to 2016, 180 (1.2%) of the isolates tested were resistant to both isoniazid and rifampin. During that time, 73 (40.6%) were resistant only to isoniazid and rifampin, 27 (15.0%) were also resistant to ethambutol and an additional 27 (15.0%) were resistant to pyrazinamide. The remaining 53 (29.4%) isolates were resistant to all four of the first-line TB medications (Figure 4; Supplementary Table 3 - Table 15; data not tabulated across tables).
Figure 4: Number and percentage of isolates resistant to isoniazid and rifampin with or without resistance to ethambutol and/or pyrazinamide, Canada, 2006 to 2016

Text description: Figure 4
Figure 4: Number and percentage of isolates resistant to isoniazid and rifampin with or without resistance to ethambutol and/or pyrazinamide, Canada, 2006 to 2016
| Isolates | 2006 | 2007 | 2008 | 2009 | 2010 | 2011 | 2012 | 2013 | 2014 | 2015 | 2016 | Total |
|---|---|---|---|---|---|---|---|---|---|---|---|---|
| INH & RMP | 9 | 0 | 6 | 9 | 6 | 6 | 4 | 6 | 10 | 11 | 6 | 73 |
| INH, RMP & EMB | 5 | 3 | 1 | 5 | 3 | 1 | 0 | 3 | 2 | 0 | 4 | 27 |
| INH, RMP & PZA | 1 | 1 | 3 | 2 | 4 | 4 | 2 | 1 | 3 | 3 | 3 | 27 |
| INH, RMP, EMB & PZA | 1 | 7 | 6 | 2 | 5 | 8 | 3 | 5 | 4 | 8 | 4 | 53 |
To determine XDR-TB, all isolates that were found to be resistant to both isoniazid and rifampin were subsequently tested for resistance to select second-line drugs. In 2016, of the 17 isolates identified as resistant to both isoniazid and rifampin, one was resistant to at least one of the injectable agents (amikacin, capreomycin or kanamycin) but susceptible to the fluoroquinolones, and two isolates were resistant to at least one fluoroquinolone but susceptible to all of the injectable agents. The remaining 14 isolates were all susceptible to both the injectable agents and the fluoroquinolones. As none of the 17 isoniazid- and rifampin-resistant isolates were resistant to both an injectable agent and a fluoroquinolone, no isolates were classified as XDR-TB. 2016 was the second year in a row with no reported XDR-TB isolates.
Between 2006 and 2016, of the 180 isolates resistant to both isoniazid and rifampin, 141 (78.3%) were found to be sensitive to both the injectable agents and the fluoroquinolones (Figure 5). Additionally, 18 (10.0%) were resistant to the injectable agents but susceptible to the fluoroquinolones and 14 (7.8%) were resistant to the fluoroquinolones but susceptible to the injectable agents. Finally, seven (3.9%) of the isolates were found to be resistant to both the fluoroquinolones and the injectable agents, identifying them as XDR-TB (Figure 5).
Figure 5: Number and percentage of isolates resistant to isoniazid and rifampin with or without resistance to fluoroquinolones and/or injectable agents, Canada, 2006 to 2016

Text description: Figure 5
Figure 5: Number and percentage of isolates resistant to isoniazid and rifampin with or without resistance to fluoroquinolones and/or injectable agents, Canada, 2006 to 2016
| Resistant to both (isoniazid and rifampin), with or without resistance to fluoroquinolones and/or injectable agents | Number of isolates and the reporting year | TOTAL | ||||||||||
|---|---|---|---|---|---|---|---|---|---|---|---|---|
| 2006 | 2007 | 2008 | 2009 | 2010 | 2011 | 2012 | 2013 | 2014 | 2015 | 2016 | ||
| Sensitive to both | 12 | 8 | 14 | 15 | 12 | 16 | 4 | 12 | 16 | 18 | 14 | 141 |
| Resistance to injecitable agent | 2 | 2 | 1 | 1 | 2 | 1 | 3 | 1 | 1 | 3 | 1 | 18 |
| Resistance to Flouroquinolone | 1 | 1 | 0 | 2 | 3 | 1 | 1 | 1 | 1 | 1 | 2 | 14 |
| Resistance to both | 1 | 0 | 1 | 0 | 1 | 1 | 1 | 1 | 1 | 0 | 0 | 7 |
| Total | 16 | 11 | 16 | 18 | 18 | 19 | 9 | 15 | 19 | 22 | 17 | 180 |
Geographical distribution
In 2016, 1,314 (90.4%) of the isolates originated from five provinces: Ontario, Quebec, British Columbia, Alberta and Manitoba (Figure 6; Supplementary Table 16). Saskatchewan accounted for fewer than 5% of reported isolates while the northern territories (Northwest Territories, Nunavut and Yukon) and the Atlantic provinces (New Brunswick, Newfoundland and Labrador, Nova Scotia and Prince Edward Island) together accounted for 5% of the reported isolates. In 2016, all isolates reported from Nunavut, the Northwest Territories, Yukon, Newfoundland and Labrador, New Brunswick and Prince Edward Island were susceptible to all first-line drugs tested. Of the 17 MDR-TB isolates, seven (41.2%) originated from Ontario, four (23.5%) from Alberta and two (11.8%) each from British Columbia, Quebec and Manitoba.
Figure 6: Number of Mycobacterium tuberculosis complex isolates reported, by province or territory of origin and as a percentage of all isolates reported in Canada, 2016

Text description: Figure 6
Figure 6: Number of Mycobacterium tuberculosis complex isolates reported, by province or territory of origin and as a percentage of all isolates reported in Canada, 2016
| Province | Number of isolates reported | Percentage of all reported isolates for Canada |
|---|---|---|
| Ontario | 505 | 34.8 |
| Québec | 218 | 15 |
| British-Columbia | 217 | 14.9 |
| Alberta | 206 | 14.2 |
| Manitoba | 168 | 11.6 |
| Saskatchewan | 65 | 4.5 |
| Nunavut | 33 | 2.3 |
| Newfoundland & Labrador | 18 | 1.2 |
| New Brunswick | 9 | 0.6 |
| Prince Edward Island | 4 | 0.3 |
| Northwest Territories | 4 | 0.3 |
| Nova Scotia | 3 | 0.2 |
| Yukon & Territories | 2 | 0.1 |
| Canada | 1452 | 100 |
Between 2006 and 2016, the 173 MDR-TB isolates originated from seven provinces: Alberta, British Columbia, Manitoba, New Brunswick, Ontario, Quebec and Saskatchewan. Ontario accounted for 97 (56.1%) of all reported MDR-TB isolates and has reported an average of nine MDR-TB isolates per year (range: 6-14) (Supplementary Table 11). Alberta accounted for 24 (13.9%) of the reported MDR-TB isolates, of which more than 10 (41.6%) were reported between 2014 and 2016 (Supplementary Table 3).
Between 2006 and 2016, both British Columbia and Quebec consistently reported, on average, fewer than two MDR-TB isolates per year. Manitoba reported seven MDR-TB isolates over the past 11 years, averaging less than one per year. New Brunswick and Saskatchewan reported one and two MDR-TB isolates respectively, between 2006 and 2016 (Supplementary Table 18).
Between 2006 and 2016, there were seven XDR-TB isolates reported. Of the seven, five originated from Ontario, one from Manitoba and one from Quebec (Supplementary Table 18).
Demographic information
In 2016, sex was known for 1,450 (99.9%) of the 1,452 individuals from whom isolates were collected (Supplementary Table 19). While males accounted for 732 (54.5%) of all reported isolates and 64 (49.2%) of the resistant isolates, females represented 11 (64.7%) of the MDR-TB isolates.
Between 2006 and 2016, males accounted for 8,265 (56.3%) of all the isolates reported, 726 (53.1%) of isolates with any resistance and 85 (50.0%) of the MDR-TB isolates (data not shown). Although there were only seven XDR-TB isolates reported between 2006 and 2016, five were from females. The proportion of females whose TB showed any drug resistance increased slightly during the 11-year period (from 8.1% in 2006 to 10.0% in 2016) and was higher than males (at 8.1%) in 2016 (Figure 7).
Figure 7: Percentage of isolates showing any resistance among all isolates tested, by sex, Canada, 2006 to 2016

Text description: Figure 7
Figure 7: Percentage of isolates showing any resistance among all isolates tested, by sex, Canada, 2006 to 2016
| Reporting year | Males | Females |
|---|---|---|
| 2006 | 9.20% | 8.10% |
| 2007 | 10.20% | 9.90% |
| 2008 | 8.00% | 9.60% |
| 2009 | 9.70% | 8.20% |
| 2010 | 8.60% | 8.50% |
| 2011 | 9.30% | 12.10% |
| 2012 | 10.60% | 8.90% |
| 2013 | 6.50% | 10.30% |
| 2014 | 8.00% | 11.50% |
| 2015 | 8.60% | 12.40% |
| 2016 | 8.10% | 10.00% |
| Total | 8.80% | 9.90% |
In 2016, age and/or date of birth was reported for all 1,452 individuals from whom isolates were collected (Supplementary Table 19). Of the 130 drug-resistant isolates, 26 (20.0%) of those with any resistance were from individuals between 25 and 34 years of age and 25 (19.2%) were among those between 15 and 24 years of age (Supplementary Table 19). Five isolates with any resistance were from individuals under the age of 15 years. In 2016, of the 17 MDR-TB cases, 16 (94.1%) were among individuals aged between 15 and 64 years of age and only one case was found in an individual between five and 14 years of age (Supplementary Table 19).
Between 2006 and 2016, individuals between 15 and 44 years of age accounted for 7,045 (47.4%) of all reported isolates, 757 (54.0%) of the isolates showing any resistance and 125 (72.3%) of MDR-TB isolates (Figure 8).
Figure 8: Proportion of reported isolates by resistance pattern and age group, Canada, 2006 to 2016

Text description: Figure 8
Figure 8: Proportion of reported isolates by resistance pattern and age group, Canada, 2006 to 2016
| Age group (years) | All isolates reported | Isolates showing any resistance | MDR-TB isolates |
|---|---|---|---|
| <1 | 0.20% | 0.10% | 0.00% |
| 04-Jan | 0.70% | 0.60% | 0.60% |
| 14-May | 1.70% | 1.10% | 0.60% |
| 15-24 | 13.50% | 14.70% | 22.50% |
| 25-34 | 17.90% | 21.20% | 31.80% |
| 35-44 | 15.90% | 18.10% | 17.90% |
| 45-54 | 13.60% | 14.00% | 9.80% |
| 55-64 | 10.50% | 10.50% | 8.10% |
| 65-74 | 10.50% | 9.20% | 4.00% |
| 75+ | 14.80% | 9.60% | 3.50% |
| Unknown | 0.50% | 0.90% | 1.20% |
| Total | 100% | 100% | 100% |
Discussion
In Canada, between 2006 and 2016, trends in TB drug resistance remained relatively low and stable. In 2016, although there was a slight increase in the number of isolates reported as compared with previous years, this did not translate into an increased proportion of drug resistance. Of the results submitted in 2016, 9.0% of all isolates tested were resistant to at least one of the four first-line drugs; the majority (83.1%) of those were resistant to only one drug. Of isolates tested, MDR-TB was identified in only 1.2% and XDR-TB was not identified among any results reported in 2016.
Isoniazid monoresistance was the most commonly reported pattern in Canada. Rifampin, along with isoniazid, is one of the most effective first-line medications; fortunately, rifampin monoresistance remains low but ongoing surveillance will continue to be important to identify any changes in resistance patterns to this drug.
In 2016, the data showed some regional variation, including slightly increased levels of MDR-TB in Alberta. As well, the proportion of females with resistance appeared to slightly increase over time and was higher than the proportion of males with resistance.
In many parts of the world, drug resistance is a major challenge to preventing and controlling TB. Eastern Europe and Central Asia continue to have the world's highest proportion of MDR-TB casesFootnote 1. Such cases pose a considerable challenge to treatment and prevention efforts because the availability of effective anti-tuberculosis drugs becomes limited.
As reported in Tuberculosis in Canada - Summary 2015, foreign-born individuals continued to account for the majority of reported cases, at 71% of active TB cases diagnosed in CanadaFootnote 6 and it is likely that these individuals acquired the infection outside of Canada. Therefore, although data on country of origin is not collected in the CTBLSS, TB drug-resistance patterns in Canada are probably affected by drug-resistance patterns elsewhere in the world.
Data published by the World Health Organization show that, globally, in 2015, about 3.9% (95% CI: 2.7%–5.1%) of new TB cases and 21% (95% CI: 15%–28%) of previously-treated TB cases were MDR-TBFootnote 1. Although the data captured through the CTBLSS do not distinguish between isolates from new versus previously-treated cases of TB, it is reassuring that only 1.2% of isolates tested in 2016 were MDR-TB (which is considerably lower than global estimates). In addition, only seven XDR-TB cases were identified between 2006 and 2016 indicating that XDR-TB in Canada remains rare.
A few limitations should be considered. Although efforts were made to ensure that multiple records for any one individual in a given year were removed, given the minimal identifying information available for each isolate (age and sex), it is possible that multiple isolates from one individual were included in the database. This bias is likely minimal given the validation process with provincial and territorial data providers.
Demographic and clinical data collected through the CTBLSS were limited, and no data were collected on the ethnic origin, diagnostic/clinical status or treatment outcome of the individual from whom the sample was collected. Additional demographic and clinical information would facilitate a more in-depth epidemiological assessment of drug resistance patterns in Canada. Differentiation between primary and acquired drug resistanceFootnote 1 and differing resistance patterns among new cases in comparison to re-treatment cases was not possible based on data collected through this surveillance system. However, the Tuberculosis in Canada—Summary 2015Footnote 6 and Tuberculosis in Canada 2012Footnote 7 surveillance reports provide an overview of the overall reported active TB cases and corresponding incidence rates in Canada by select demographic and clinical characteristics, and present case-based (vs. isolate-based) data on primary and acquired drug resistance in Canada that were not presented here. Together, these reports provide a comprehensive overview of TB case and drug resistance surveillance data from a national perspective.
Typically, only MDR-TB isolates or other extensive resistance patterns will undergo select second-line drug sensitivity testing. Although the Clinical and Laboratory Standards Institute (CLSI) recommends that isoniazid-monoresistant isolates as well as other polyresistant non-MDR isolates be tested for second-line drug resistanceFootnote 8 this is not universally reported in Canada. Other isolates that are not MDR-TB may be resistant to fluoroquinolones because of the widespread use of these antibiotics for other respiratory infections. To some extent, this limits our understanding of the emergence of second-line drug resistance within Canada.
The Public Health Agency of Canada continues to work with its provincial and territorial partners to achieve the goal of TB elimination in Canada. With the growing worldwide concern about drug resistance and the emergence of XDR-TB, the CTBLSS remains vital to the monitoring of TB drug resistance in Canada.
Authors' statement
- VG – Conceptualization, Methodology, Software, Validation, Formal Analysis, Writing – Original Draft
- JV – Conceptualization, Writing – Review & Editing
- WS – Writing – Review & Editing, Supervision
Conflict of interest
None.
Acknowledgements
The Surveillance and Epidemiology Division, Centre for Communicable Diseases and Infection Control at the Public Health Agency of Canada would like to acknowledge the members of the Canadian Tuberculosis Laboratory Technical Network and their teams as well as colleagues at The National Microbiology Laboratory for their contribution to and participation in the Canadian Tuberculosis Laboratory Surveillance System.
Funding
This work was supported by the Public Health Agency of Canada as part of its core mandate.
References
Page details
- Date modified: