
Community level phenology of plant pollinator interactions in four arctic ecosystems near Cambridge Bay, Victoria Island, Nunavut
Authors
- J. Wagner, Polar Knowledge Canada, Canadian High Arctic Research Station, Ottawa, Ontario, Canada, johann.wagner@polar.gc.ca
- T. Roslin, Department of Ecology, Swedish University of Agricultural Sciences, Uppsala, Sweden
- N.M. Schmidt, Department of Bioscience, Aarhus University, Roskilde, Denmark
- A. Grunsky, Department of Earth and Ocean Sciences, Department of Biology, University of Victoria, Victoria, British Columbia, Canada
- D. McLennan, Polar Knowledge Canada, Canadian High Arctic Research Station, Ottawa, Ontario, Canada
- I.D. Hogg, Polar Knowledge Canada, Canadian High Arctic Research Station, Ottawa, Ontario, Canada
Citation information
Wagner, J., Roslin, T., Schmidt, N.M., Grunsky, A., McLennan, D. and Hogg, I.D. 2020. Community-level phenology of plant-pollinator interactions in four arctic ecosystems near Cambridge Bay, Victoria Island, Nunavut. Polar Knowledge: Aqhaliat Report, volume 3, Polar Knowledge Canada, p. 41–47. DOI: 10.35298/pkc.2020.11.eng
Article
In the brief growing season of the Arctic, plants need to flower within a short time frame. Such "flush flowering" may lead to pollinator limitation, and to competition among plants for pollinators. At the level of individual flowers, this can translate into both intra- and interspecific competition. Within plant species, a higher abundance of conspecific flowers can result in less pollinator visits per flower, resulting in reduced seed set for individuals flowering during the peak season. Among plant species, a higher abundance of heterospecific flowers can also result in fewer pollinator visits per flower, with similar consequences. The realized strength of intra- and interspecific competition at a given time is therefore affected by three factors: the contemporary abundance of conspecific and heterospecific flowers, the availability of pollinating insects, and the pollen carrying capacity of these insects.
This study attempts to resolve the strength of competition as a result of these factors, and to measure its impact on net seed set. During the growing season of 2019, four study sites were established in ecosystems corresponding to dry upland, mesic tundra, shrub fen, and snow bed. The phenology of insect-pollinated plant species was recorded by direct observations in these four sites, while the availability and phenology of pollinators was determined by malaise traps deployed in each site. To determine flower abundance, flowers were counted along predetermined transects. Pollen-carrying capacity of individual pollinators was determined by pollen counting on captured insects. For establishing how the above-mentioned three factors translate to pollinator visits per flower, and the impact of these visits on seed formation, a set of experiments were performed on Dryas integrifolia (mountain avens). This genus was selected as being the most abundant vascular plant in many circumpolar Arctic terrestrial ecosystems.
To determine pollinator visits per individual flower, insect traps mimicking Dryas flowers were deployed in the field for set periods of time during early, peak, and late flowering periods, including two weeks after flower senescence. These artificial "sticky flowers" (Figure 1) were manufactured from white and yellow sticky paper mounted on wire stalks and placed among Dryas plants in order to capture pollinators seeking to visit these flowers. To generate a baseline for determining the impact of insect visits on seed set in Dryas, pollinator exclosure cages were installed over floral buds using the same timing as the deployment of the "sticky flowers." At the end of the season, seed set inside and outside of these exclosure cages was determined by counting the flowers falling into various categories of seed formation (Figure 2). Preliminary counts of insects on the "sticky flowers" indicate that by far the most abundant taxonomic group are the flies and their relatives, while the most pollinator visits happened in mid-July, regardless of the Dryas phenology in all four ecosystems (Figures 3-6).
The project will be continued over multiple years, thereby providing direct insight into how climatic variations, and climate change, may affect insect-plant interactions. From a community perspective, a plant-insect timing mismatch due to climate change in the Arctic could significantly affect the berry production of species that are valued as local food sources.
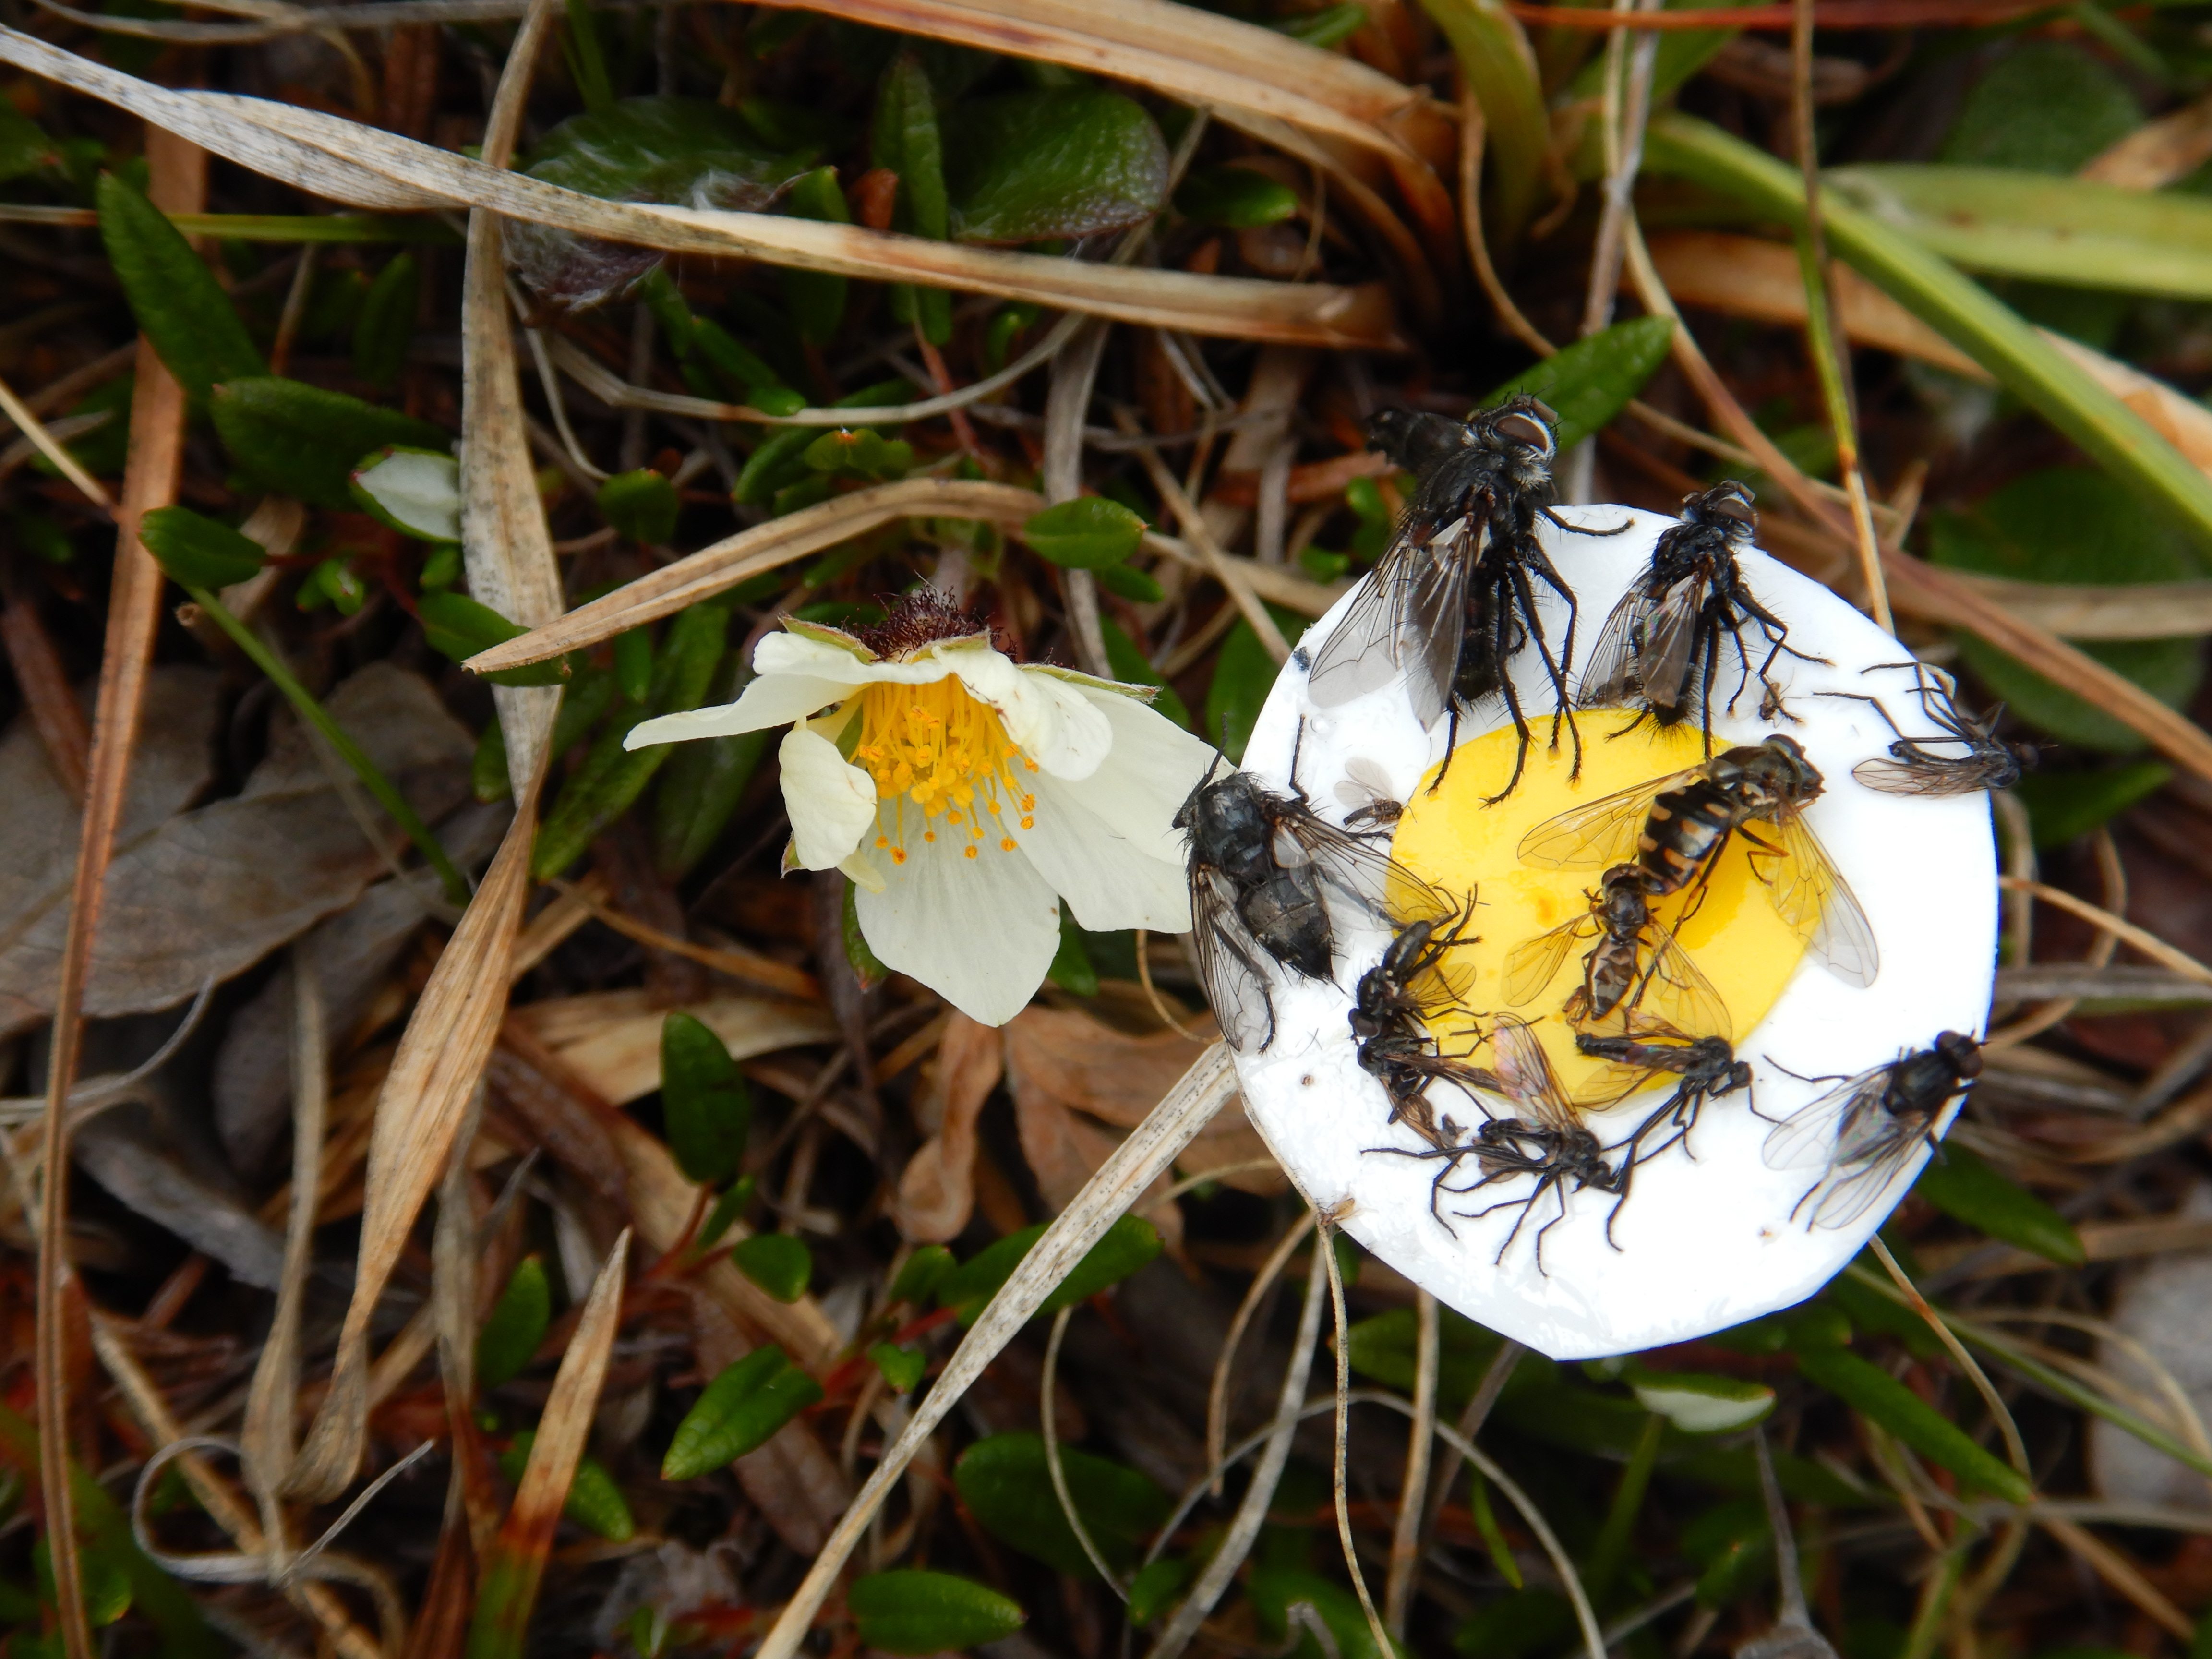
Figure 1: "Sticky flower" insect traps were deployed in the field in order to determine pollinator visits per individual flower.
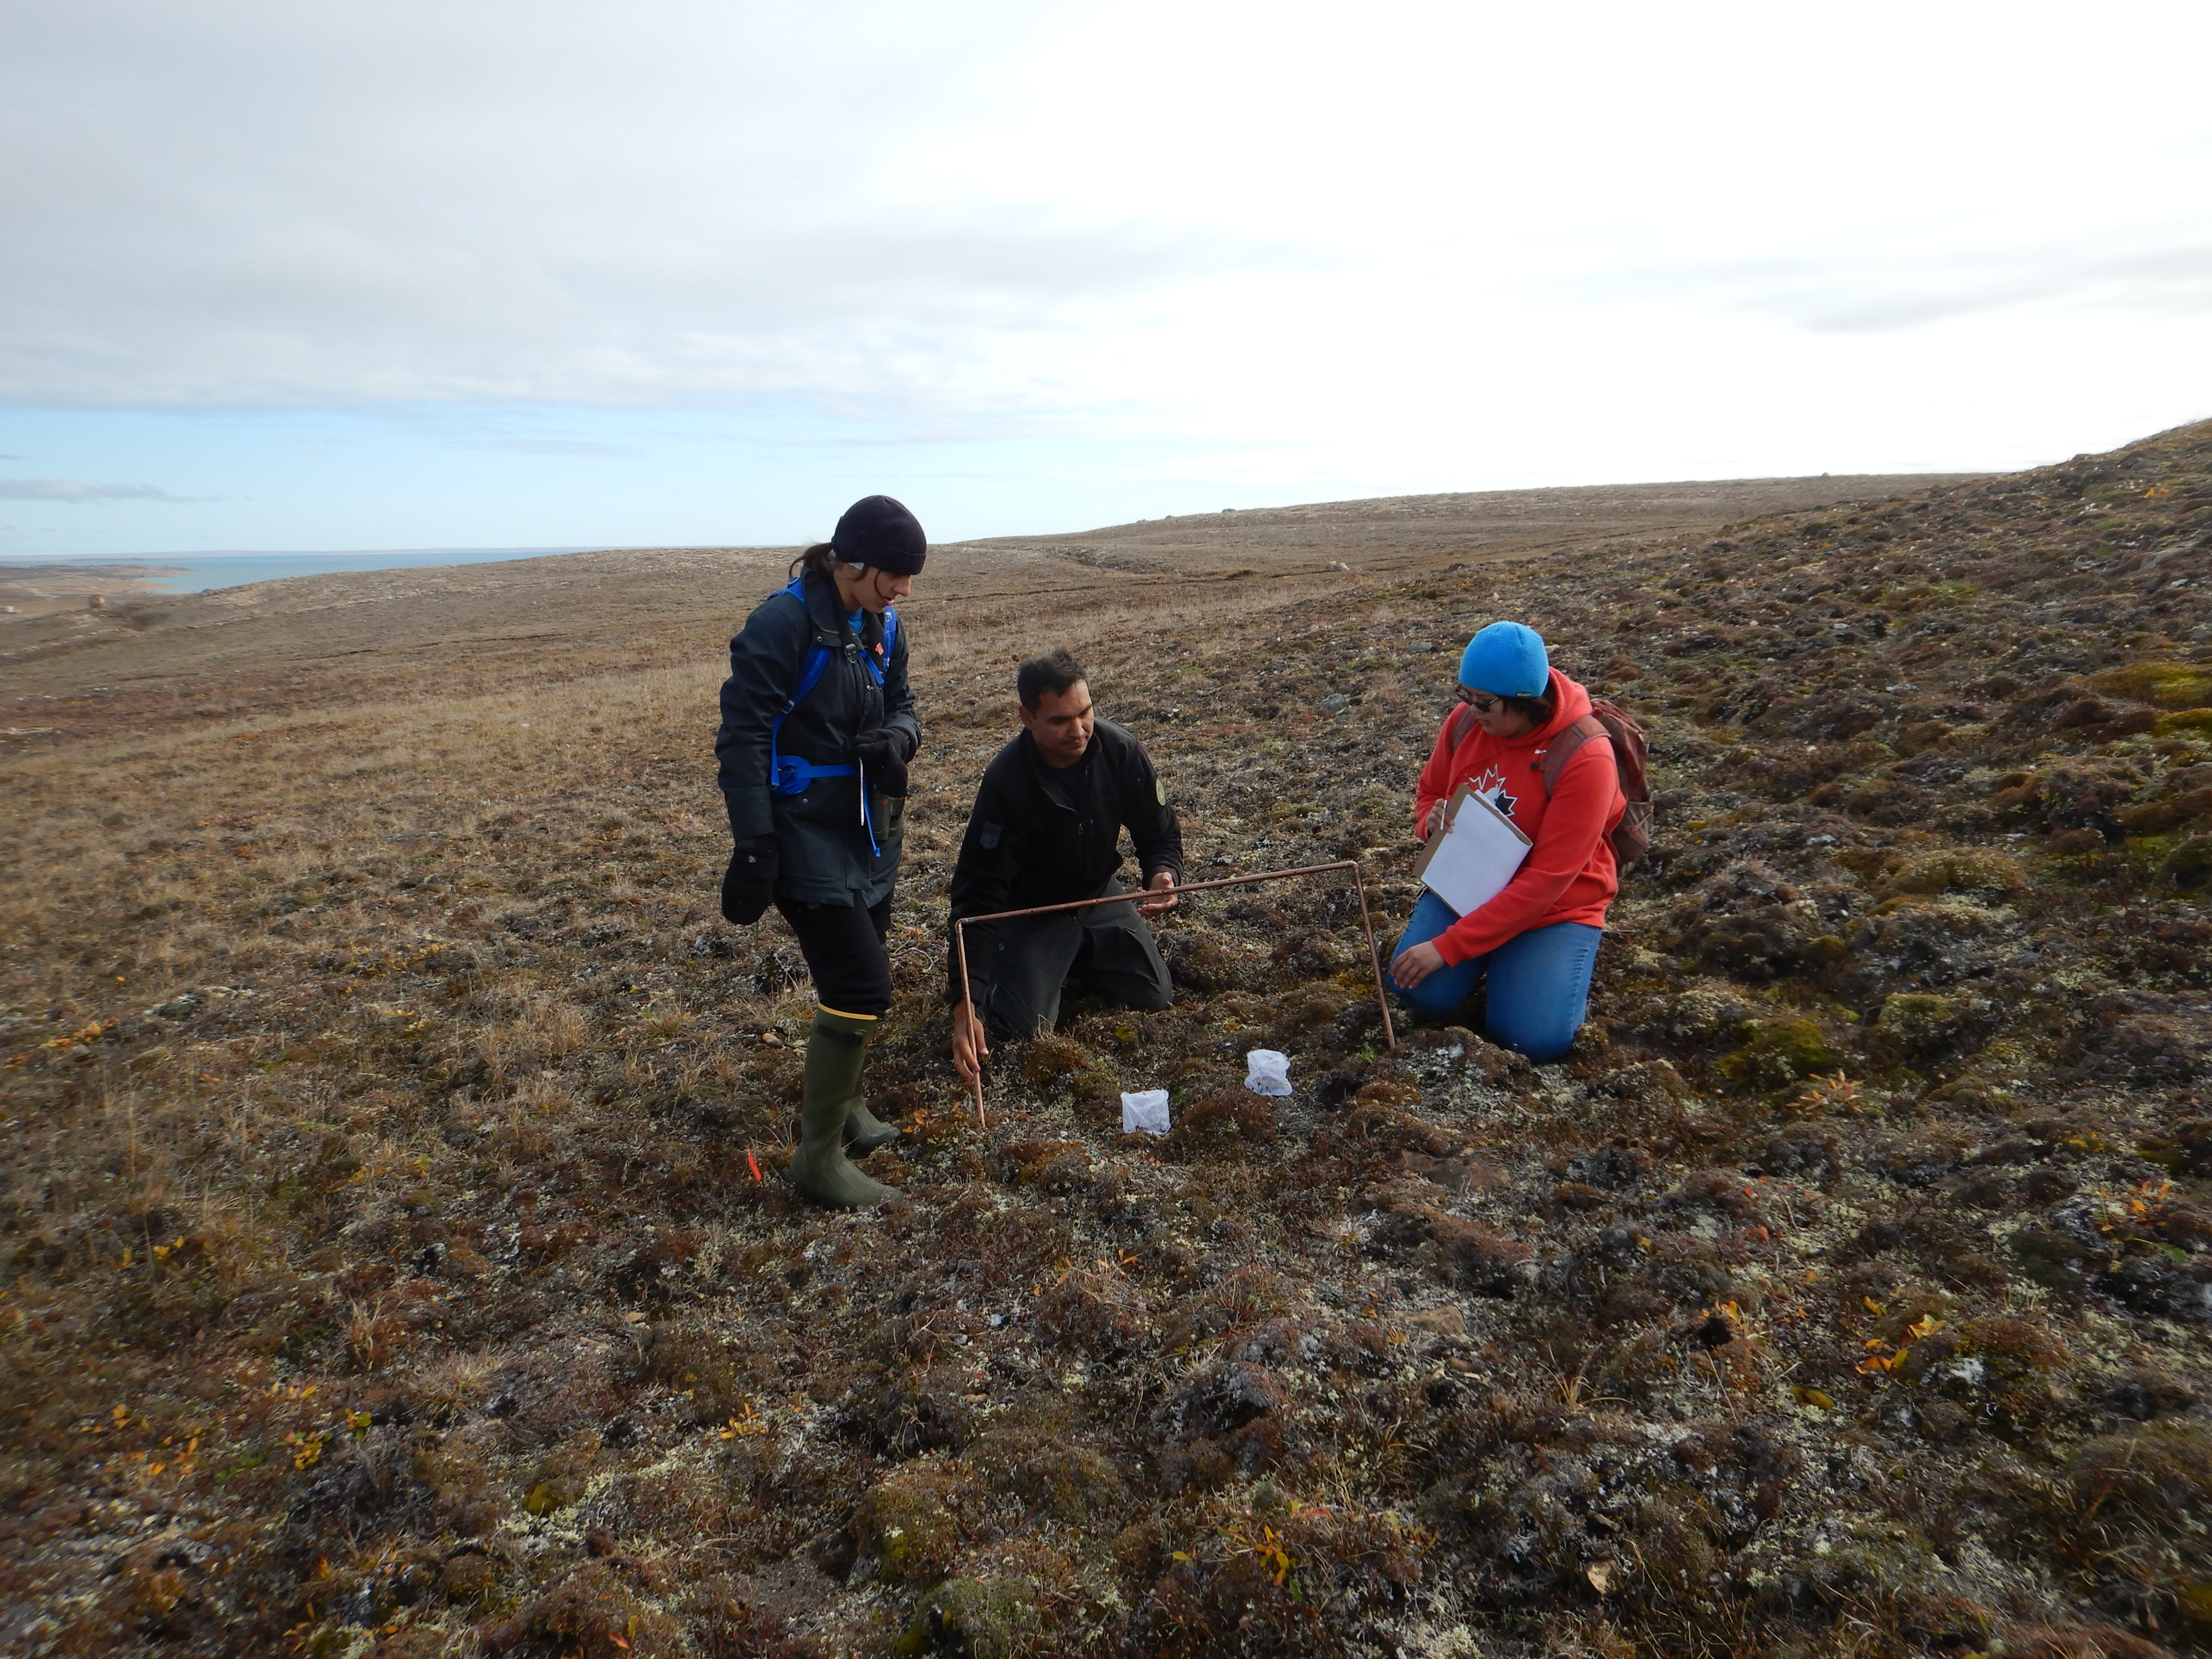
Figure 2: Seed set assessment for Dryas integrifolia in the snow bed ecosystem at the end of the growing season of 2019.

Figure 3: Arthropod counts per flower per day in the dry upland site during the summer of 2019, as related to the flowering phenology of insect-pollinated plants. Due to their high abundance, dipterans are represented on a different scale than other arthropods. The phenological diagram depicts flowering timing and duration, as well as flower colour and relative abundance.
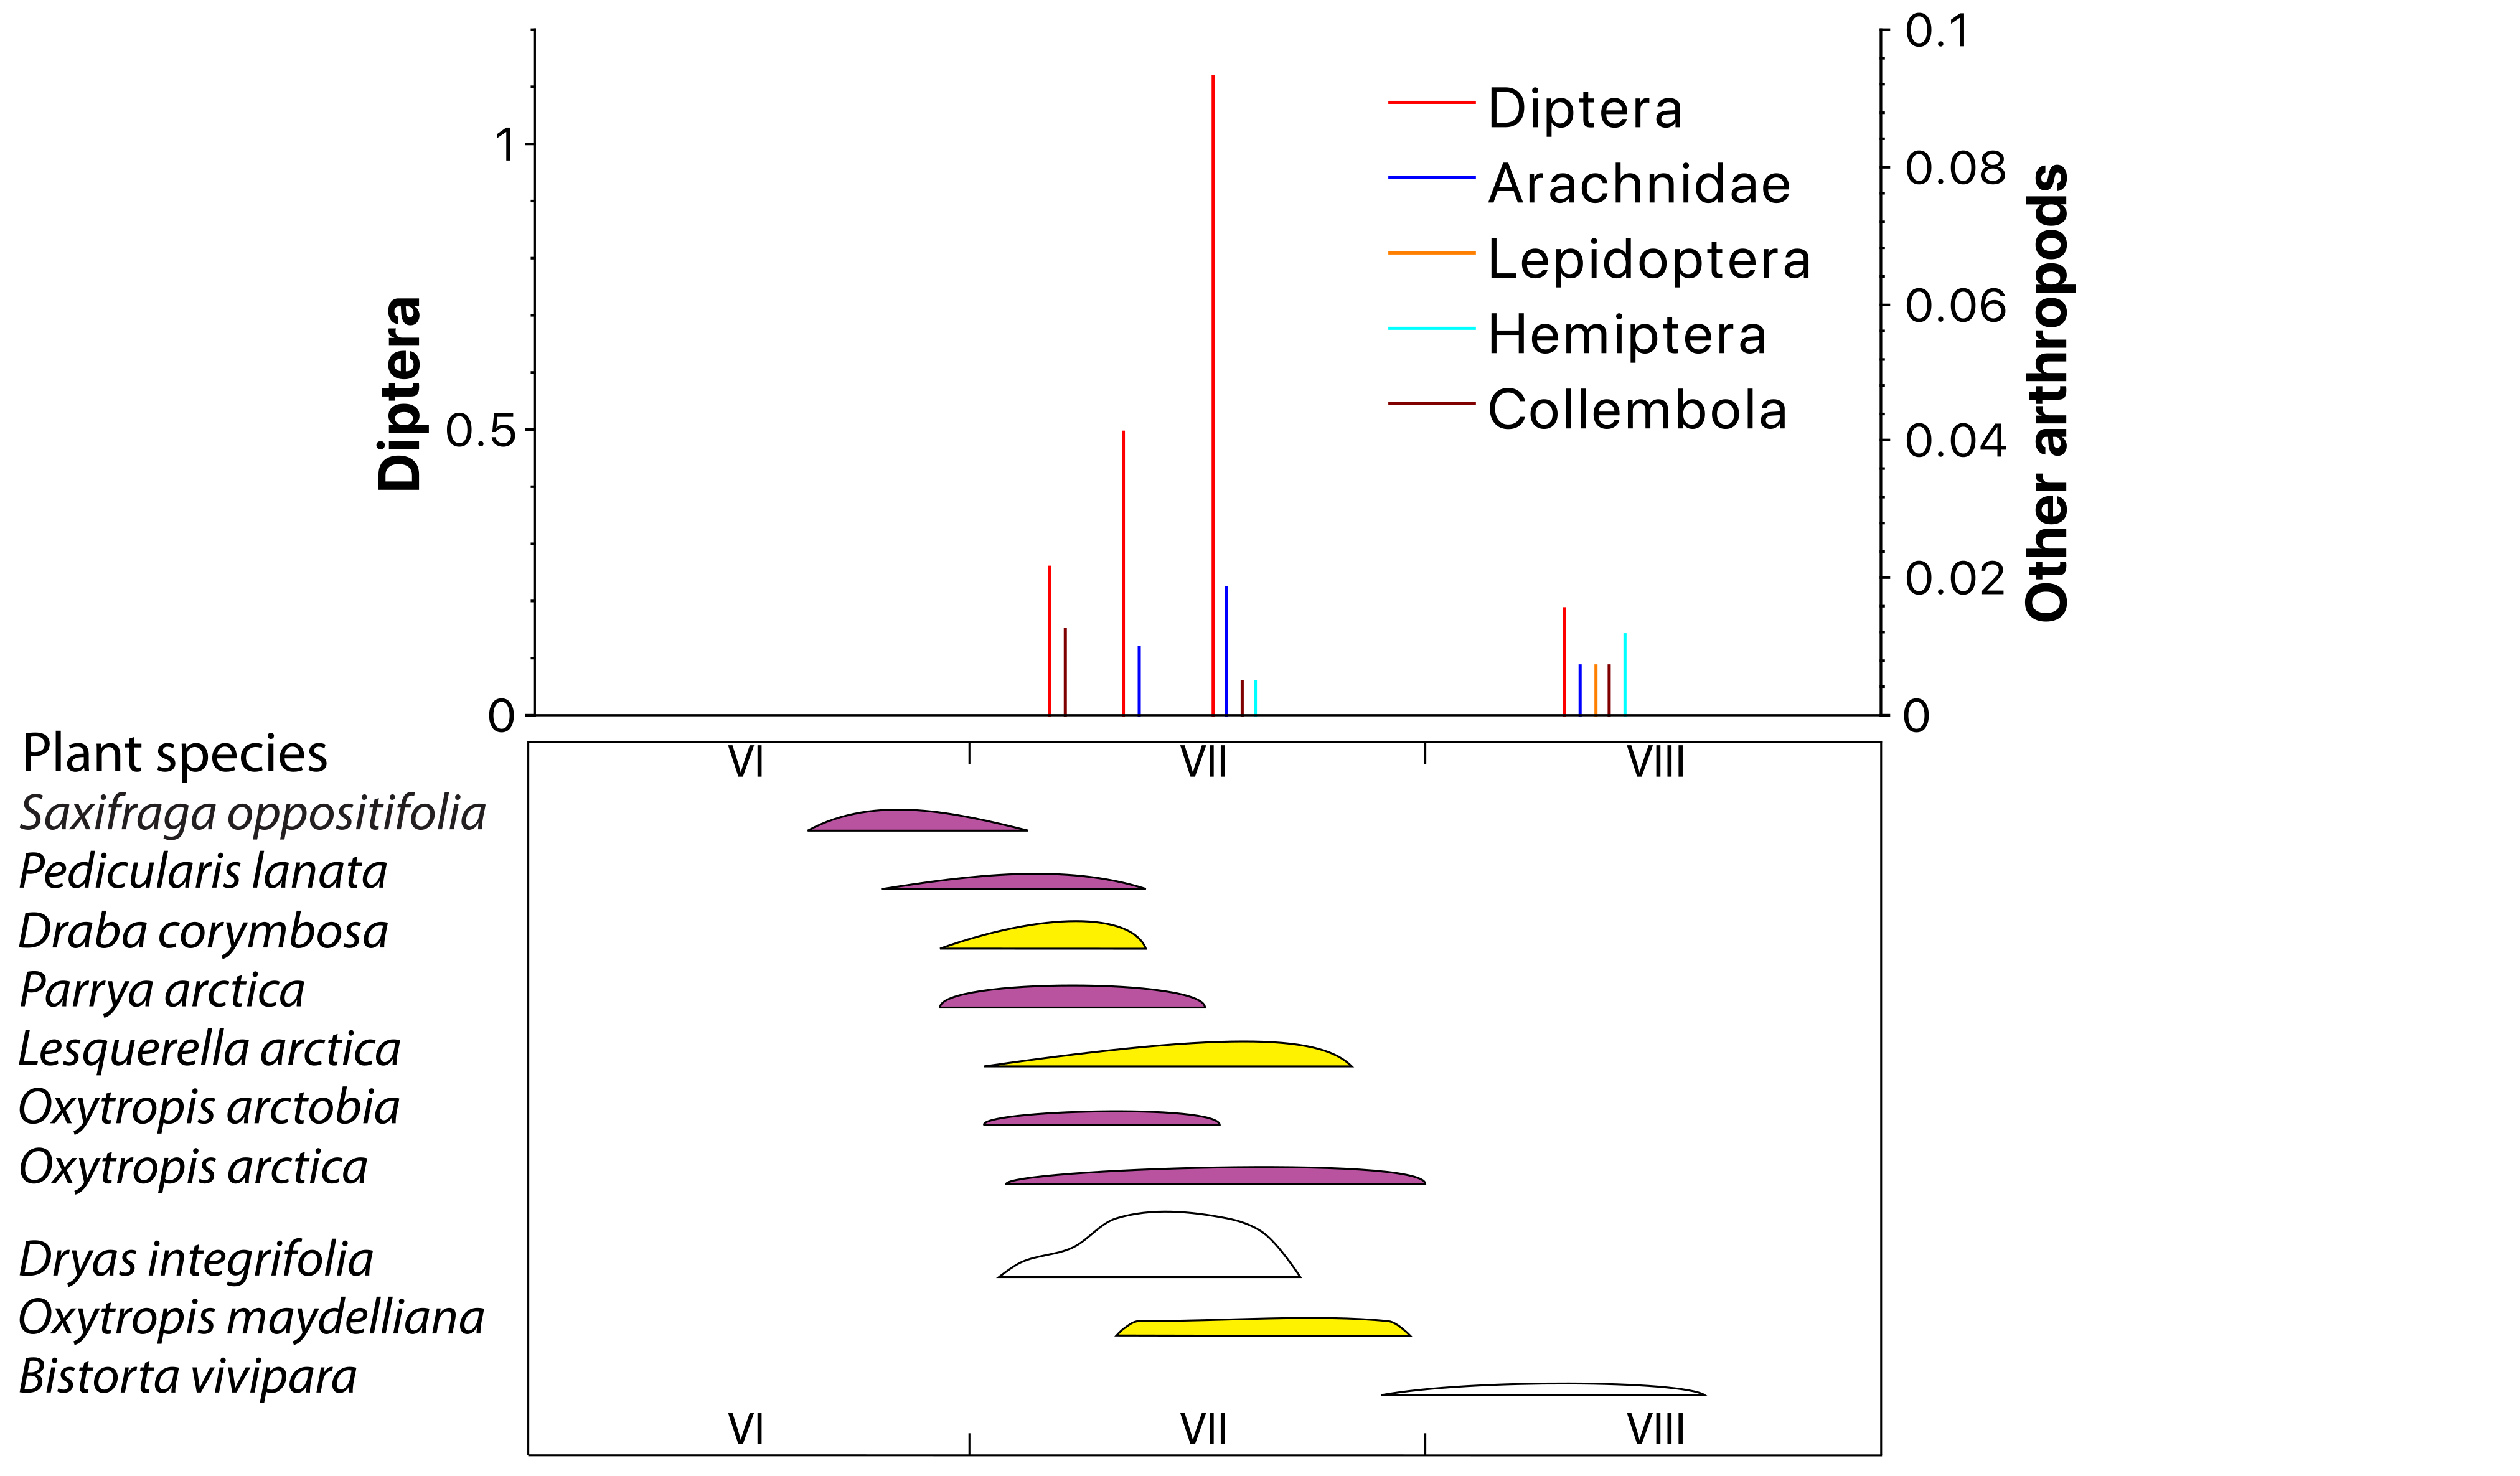
Figure 4: Arthropod counts per flower per day in the mesic tundra site during the summer of 2019, as related to the flowering phenology of insect-pollinated plants. Due to their high abundance, dipterans are represented on a different scale than other arthropods. The phenological diagram depicts flowering timing and duration, as well as flower colour and relative abundance.

Figure 5: Arthropod counts per flower per day in the shrub fen site during the summer of 2019, as related to the flowering phenology of insect-pollinated plants. Due to their high abundance, dipterans are represented on a different scale than the other arthropods. The phenological diagram depicts flowering timing and duration, as well as flower colour and relative abundance.

Figure 6: Arthropod counts per flower per day in the snow bed site during the summer of 2019, as related to the flowering phenology of insect-pollinated plants. Due to their high abundance, dipterans are represented on a different scale than other arthropods. The phenological diagram depicts flowering timing and duration, as well as flower colour and relative abundance.
Polar Knowledge Canada
For media inquiries, contact:
communications@polar-polaire.gc.ca
Page details
- Date modified: