How to Scan Reflective Objects Using a Flatbed Scanner
Ern Bieman
Disclaimer
The information in this document is based on the current understanding of the issues presented. It does not necessarily apply in all situations, nor do any represented activities ensure complete protection as described. Although reasonable efforts have been made to ensure that the information is accurate and up to date, the publisher, Canadian Heritage Information Network (CHIN), does not provide any guarantee with respect to this information, nor does it assume any liability for any loss, claim or demand arising directly or indirectly from any use of or reliance upon the information. CHIN does not endorse or make any representations about any products, services or materials detailed in this document or on external websites referenced in this document; these products, services or materials are, therefore, used at your own risk.
Table of contents
- List of abbreviations
- Introduction
- Reflective objects that can be scanned using a flatbed scanner
- Imaging concepts
- Equipment selection
- Other equipment required for flatbed scanning
- Workflow
- Step 1: Select materials
- Step 2: Evaluate condition
- Step 3: Catalogue and create metadata
- Step 4: Prepare for digitization
- Step 5: Digitize
- Step 6: Post-processing
- Step 7: Quality review
- Step 8: Archive
- Step 9: Publish
- Common flatbed scanning issues
- Acknowledgements
- Appendix A: How to set and use a colour profile
- Appendix B: Colour sampling
- Appendix C: Scanning oversized documents
- Glossary
- Bibliography
- Endnote
List of abbreviations
- AIIM
- Association for Intelligent Information Management
- BAnQ
- Bibliothèque et Archives nationales du Québec
- BNF
- Bibliothèque nationale de France
- CCD
- charged coupling device
- CCI
- Canadian Conservation Institute
- CHIN
- Canadian Heritage Information Network
- CIE
- International Commission on Illumination
- CMH
- Canadian Museum of History
- CMS
- collections management system
- CMYK
- cyan, magenta, yellow, black
- DPI
- dots per inch
- EXIF
- exchangeable image file format
- FADGI
- Federal Agencies Digital Guidelines Initiative
- ICC
- International Color Consortium
- IPTC
- International Press Telecommunications Council
- IT8
- set of American National Standard Institute standards for colour communications and control specifications
- NDSA
- National Digital Stewardship Alliance
- OCR
- optical character recognition
- PPI
- pixels per inch
- RGB
- red, green, blue
- UNESCO
- United Nations Educational, Scientific and Cultural Organization
- XMP
- extensible metadata platform
Introduction
The Canadian Heritage Information Network (CHIN) has produced this guide to provide technical information for the flatbed scanning of reflective flat objects. Such objects include documents, newsprint and photographic prints. Objects with texture or relief, such as coins, fabrics or embossed materials, are not covered, as they are best digitized using photographic equipment. Although the information in the guide may prove useful for members of the gallery, library and archive communities, sections such as those on cataloguing, metadata and archiving were written with museums in mind.
The guide focuses on technical issues surrounding the use of flatbed scanners and the manipulation of scanned images. It adheres and refers to existing imaging standards. It also refers to the United States Federal Agencies Digital Guidelines Initiative (FADGI) Technical Guidelines for Digitizing Cultural Heritage Materials (PDF Format).
Reflective objects that can be scanned using a flatbed scanner
Flatbed scanners can scan the following reflective objects:
- unbound general collection items, such as paper documents
- oversized items
- newspapers
- all photographs and prints
Flatbed scanners are not recommended for the following types of objects:
- objects having relief, such as embossed materials
- objects with translucency that is meant to be captured in the scan, such as onion paper
- bound items, such as books
For these objects and all other materials not listed, please review FADGI’s Technical Guidelines (PDF Format) to determine which equipment is recommended.
Some flatbed scanners, namely, those with backlighting in the lid, can also scan transparent objects such as photographic negatives. If your scanner does not have a backlighting feature, do not assume that it can be adapted to scan transparencies. If you are thinking about acquiring a flatbed scanner to scan both reflective objects and transparencies, please review the scanner selection criteria in the supplement guide How to Scan Photographic Transparencies and Photographic Negatives.
Imaging concepts
Before looking at scanners and scanning processes, we need to review some basic imaging concepts. These include modes of image capture and storage, image bit depth, colour space, colour distance and colour gamuts.
Modes of image capture and storage
There are three main modes of recording and saving digital images.
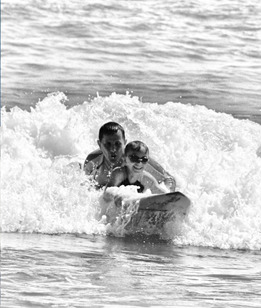
- RGB colour: colour scans, typically done using a red, green, blue (RGB) colour model, are necessary to capture both image fidelity and colour information. Such scans are used for colour objects and for most historic objects (including monochrome) where a faithful replication of the original object’s appearance is valued, for example, a wine stain, a coffee ring or the discoloration of paper.
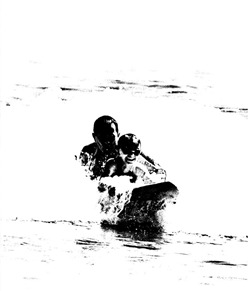
- Greyscale: while not as space efficient as bitonal scans, greyscale is valuable where image fidelity is important, but colour is not. Greyscale is sometimes used for monochrome documents, monochrome images, transparencies and newsprint. However, full colour digitization of monochrome objects is also becoming a common practice. A greyscale image file is roughly one-third the size of a colour image file.
- Bitonal: this is a space-efficient way of capturing and storing information from general, monochrome office documents. Each pixel has exactly one bit of luminance information, meaning that for a black and white bitonal image, the pixel is either pure black or pure white. Thus, gradients in tone are lost. Despite space efficiency, modern scanning standards typically do not recommend bitonal imaging, and it is not a recommended method for flatbed scanning.

© Photo courtesy of a private individual
Figure 1a. Full colour image.
© Government of Canada, Canadian Heritage Information Network. 133967-0002
Figure 1b. Greyscale image.
© Government of Canada, Canadian Heritage Information Network. 133967-0003
Figure 1c. Bitonal image.
FADGI recommends the following modes of capture:
- Unbound general collection items: greyscale or colour
- Oversized items: greyscale or colour
- Newspapers: greyscale or colour as required
- Prints and photographs: greyscale or colour
Image bit depth
This refers to the number of bits (binary digits) that are used to represent light intensity in any one pixel of a digital image. An image with a bit depth of 1 would produce only two values (“0” or “1”) for any given pixel, yielding a bitonal image such as black or white. A bit depth of 2 is capable of representing four values (“00,” “01,” “10” and “11”), and so on.

© Government of Canada, Canadian Heritage Information Network. 133967-0015
Figure 2. Eight bits is usually sufficient to provide the full gamut of tones visible to humans in one colour channel, although some systems work in as many as 16 bits.
Nearly all imaging equipment and software can manage images at 8 bits per channel, meaning 8 bits are assigned to each of the red, green and blue shades in a colour image. The 3 channels in total contain 24 bits of information (referred to as 24-bit imaging), which yields 224 (or 16.7 million) distinct colours. This is considerably more than most human eyes can detect. However, some software and equipment can work to a bit depth of 16 per channel (referred to as 48-bit imaging), and an argument can be made for recording and storing this additional information. Colour information can be lost as an image is moved from one format to another, through either editing in various applications or migration to various formats for preservation or access copies. The effects, which can be visible, are covered in more detail later in this guide.
For all items that can be scanned by flatbed, FADGI recommends using the following bit depth:
- 8 bits per channel as acceptable
- 16 bits per channel as ideal
Colour space, colour models and colour gamuts
A colour space is a collection of colours that, in turn, can be numerically expressed using a colour model. CIELAB and CIEXYZ are colour spaces, devised to contain all colours visible to the human eye, onto which most colour models are mapped. Without this mapping, the colours produced by any colour model are unknown, and the model is simply a collection of numeric values without any colour attribution.
Once mapped onto a colour space, a colour model yields a subset of colours equal to or less than those in the original colour space. This subset is known as a colour gamut. The gamut is sometimes incorrectly referred to as a colour space, but strictly speaking, the gamut is a subset of a colour space.
When an image is captured, edited or rendered, it is converted through various colour models, and potentially colour spaces. Printing technologies use light subtractive colour models such as the cyan, magenta, yellow and black (CMYK) model. Mapping that model onto the same colour space will not yield the same gamut as an RGB model that is used for scanners or video screens. Likewise, a colour model with a lower bit depth will yield a gamut with fewer colours than it would if it had a greater bit depth. Invariably, colour gamuts, and thus an image’s appearance, differ across technologies. A loss of colour information can result in the following:
- colour banding, which is visible in areas where colour should appear to change evenly across a region, but does not; and
- in more extreme cases, posterization, where colour information is lost to a point where image details disappear.

© Photo courtesy of a private individual
Figure 3a. Image without colour banding. In this example, the bit depth is high enough that banding is not visible.

© Government of Canada, Canadian Heritage Information Network. 133967-0005
Figure 3b. Image with colour banding. As the bit depth is reduced or as the image is migrated through colour models, banding appears. In this example, the banding becomes noticeable in the sky and water.

© Photo courtesy of a private individual
Figure 4a. Image without posterization.

© Government of Canada, Canadian Heritage Information Network. 133967-0007
Figure 4b. Image with posterization, now a rare occurrence unless deliberately produced. It is an extreme consequence of low bit depth or of image migration using low bit depths.
The ideal solution is to minimize migration. In other words, use the same colour model and colour space when possible, and maintain a high bit level so that variances are less visible to the human eye. Consult the Image bit depth section for information on bit levels.
Colour accuracy and colour distance
Many of the steps in this guide involve measuring colour. The purpose of measuring is to ensure that the colours, illuminance and contrast in the original object are faithfully reproduced in the scanned image. Detailed steps on how to sample and measure colour will be covered in Appendix B, but the theory is introduced here. It is important to understand what colour distance is and how to measure it, as it will be used in various ways later in this guide to verify the accuracy of your scanner. Understanding colour accuracy and distance will also help ensure that your scans meet FADGI standards.
The distance between any two colour samples is referred to as “Delta E.” The method used to determine distance can be thought of as similar to the Euclidean geometry used to determine the distance between points in a Cartesian system. For instance, a colour space that uses an RGB colour model could be expressed in a 3D Cartesian grid, with red on one axis, green on the second and blue on the third.

© Government of Canada, Canadian Heritage Information Network. 133967-0016
Figure 5. A 3D Cartesian grid showing the distance between two points in the grid. Grid numbers run from 0 to 255 based on the value that can be produced by 8 bits in each colour channel.
The distance between two samples in such a model could then be thought of as the physical distance between the two points in the 3D space.
A Euclidean equation (Equation 1) for calculating the distance between two points in a 3D space is simpler than the actual calculation for colour distance.
However, using this basic formula to calculate the distance would yield different results for samples represented in an 8-bit model than for the same samples represented in a 16-bit model. In addition, because a Delta E of 1 is defined as the smallest difference in colour visible to the human eye, the distances must be normalized to that definition. These and other factors increase the complexity of the actual Delta E calculation. The formula is also constantly updated. Therefore, it is best to use a Delta E calculator to determine the colour distance between two samples. There are free calculators available online. Once the colours have been sampled (refer to Appendix B), the following web service can be used to establish the distance between results: CIE2000 Calculator.

© Government of Canada, Canadian Heritage Information Network. 133967-0017
Figure 6. Illustration of colour distance (Delta E) between pairs of blue colour swatches.
The ability to measure colour distance can be used, along with a printed image containing known colours, to verify your scanner’s colour accuracy. By scanning the target and using the CIE colour distance calculator to compare scanned results with anticipated results, you can establish the colour accuracy of your scan. This process will be covered in detail in Appendix B.
FADGI recommends the following mean colour distances:
- For general collection documents, less than 10 is acceptable and less than 3 is ideal.
- For all other objects that can be scanned with a flatbed scanner, less than 8 is acceptable and less than 3 is ideal.
Equipment selection
The following subsections will help you select the correct scanning equipment.
Understanding how a flatbed scanner works
Flatbed scanners typically consist of a glass plate (platen) on which the item to be scanned is placed face down. A lid covers the object, blocking out ambient light, and the image is then scanned via a movable light source located below the platen. The light source spans the width of the platen and can move the platen’s length. Light reflected from the source onto the object is then redirected by a mirror into a prism. The prism then breaks down the light into components of the visible spectrum. RGB sections of the light are then detected by a charged coupling device (CCD) array, which interprets the light intensity at each point along the array as a digital numeric value for its RGB components. In this manner, reflective objects on the platen can be converted to a digital image using an RGB colour model, one line at a time.

© Government of Canada, Canadian Heritage Information Network. 133967-0018
Figure 7. Cross-section view of main components inside a flatbed scanner.
Scanner resolution
The scan resolution indicates the number of pixels per inch (ppiFootnote 1) at which the scanner is able to digitize. For flatbed scanners, resolution is typically cited as two numbers, for example, 2400 x 4800. The first number is the scanner’s optical resolution, which is determined by the density of photo receptors located on the CCD array. An optical density of 2400, for instance, indicates that the array contains 2400 individual photo receptors every inch (actually three rows of 2400 receptors per inch for colour scanners). Because the CCD spans the scanner’s platen, it defines the scanner’s resolution along the shorter edge of the platen. Optical resolution is typically the limiting factor in a device’s scanning resolution, for cost reasons. As photo receptor density increases, the cost of the CCD increases.
The second number is the scanner’s hardware resolution. A hardware resolution of 4800 means that the scanner is able to move its light source and mirror down the platen to 4800 distinct locations per inch. The ability to increase the number of distinct locations per inch is limited only by the device’s stepper motor and gearing. As these are more affordable to optimize than a CCD, hardware resolution is typically greater than optical resolution in any flatbed scanner. Regardless of which number is higher, the lower of two values represents the limiting resolution at which your device is able to scan.
Another form of resolution is “interpolated” or “software-enhanced” resolution. This specification, sometimes used by vendors, should be ignored, as it simply refers to the scanner’s firmware or accompanying software, guessing at image information between the pixels that were scanned. This guesswork may or may not be accurate.
FADGI recommends the following scanning resolutions for various paper objects:
- For high-quality photographic prints and similar detailed images, resolutions as high as 600 ppi.
- For all other documents, resolutions as high as 400 ppi.
Consult FADGI’s Technical Guidelines (PDF Format) for more recommendations on spatial resolution.
Another method of prescribing scan resolution is the AIIM Quality Index formula. This formula focuses on the number of pixels needed to capture text for readability, rather than fidelity to the original object. For non-text, the formula proposes that the smallest detail should be captured by at least two pixels in the scan. However, for reflective objects, it consistently calculates lower resolutions than what is recommended by FADGI. Equipment should always be chosen according to the most stringent recommendation, within the institution’s budget.
Note that scanning at higher resolutions results in larger file size and slower scan rates. Although file size is becoming less of an issue as the cost of storage continues to decrease, scan time will affect workflow, which should be taken into account when planning a digitization project.
Bit depth
A second important specification is the scanner’s bit depth. As previously mentioned, FADGI recommends 24-bit colour imaging as acceptable, and 48-bit colour as ideal. Increasingly, scanners at every price point are said to have a bit depth of 48. This seems ideal; however, with lower-end equipment, the quality of the CCD array may not allow sufficient nuance in light capture to use the additional 8 bits per channel that are provided in 48-bit colour models. Measuring the signal-to-noise ratio of a scanner’s CCD, that is, determining its ability to consistently capture the same colours in successive scans of the same object, is beyond the scope of this guide. As a rule of thumb, note that lower-end, consumer-grade scanners running in 48-bit mode may yield no more colour information than higher-end scanners running in 24-bit mode.
For all objects that can be scanned by a flatbed, FADGI recommends the following bit depths:
- 24-bit RGB colour is acceptable.
- 48-bit RGB colour is ideal.
Other relevant features
No standards or recommendations exist for the features that follow, though they are important when selecting an appropriate scanner.
Scanning speed
Speed is particularly important when scanning large volumes of material. It is usually quoted as the amount of time it takes for the scanner to pass over a single document. It does not include preview scan time or any other component of the scanning activity. When checking manufacturer specifications, make sure the quoted speed is associated with a specific resolution and document size; higher resolutions and larger documents will yield lower scanning speeds.
Maximum document size
It is important to verify the maximum document size, as the quoted size may be equal to or smaller than the platen’s dimensions.
Dynamic range
This is a feature of flatbed scanners that are able to scan transparencies. It need not be considered for scanners that scan reflective objects only. This feature is covered in more detail in the supplement to this guide, How to Scan Photographic Transparencies and Photographic Negatives.
Other scanner features to consider
You may also want to consider power requirements if you are ordering from a seller outside your global region, as well as warranty and energy certification. Many imaging features cited by a manufacturer, such as image correction or optical character recognition, are not actually scanner features. Rather, they are properties of software accompanying that scanner. Features that modify the scan to change the essence of the scanned object, for example, grain correction that “improves” the appearance of the original object, are to be avoided. This guide gives examples using third-party scan software (a professional copy of VueScan costs about CAN$120). If you choose to use third-party software rather than the vendor-supplied software, keep in mind that imaging features cited by the scanner manufacturer may not be available to you. When choosing vendor software or third-party software, start by identifying the features you must have for your scanning projects and those you would like to have. Then, perform a comparative analysis to identify which software best suits your needs.
Unwanted scan properties
There are some unwanted scan properties that you should look out for when selecting a scanner. These exist particularly in lower-end consumer-grade equipment. Unfortunately, apart from consumer reviews, the only way to determine if a scanner produces unwanted properties is to test the equipment. A summary of these unwanted properties and how to test for them follows.
Streaking
Streaking involves local non-uniformities, typically in a perfectly vertical or horizontal line. These can result from individual photo receptors in the CCD not functioning properly, or from an entire line of information being incorrectly recorded by the CCD array. These problems are readily visible. If the scanner has been cleaned, then the cause is likely the CCD or a malfunction in the movable scan components. In that case, it is not correctable. Do not use the scanner.

© Photo courtesy of a private individual
Figure 8. Streaking.
Illuminance non-uniformity
Illuminance non-uniformity is unwanted stray light cast onto a captured image. It is most common in large format cameras but can also be detected in scanners. Common causes include stray light from a source external to the scanner, or poor scanner design/construction that causes light from brighter sections of an object to “leak” into darker sections of the scanned image.
An effective way to test for illuminance non-uniformity is to scan a greyscale target, then sample for variations in illuminance in darker sides of a high-contrast edge (where white and black meet, for example), as well as around portions of the target that are placed near the edge of the platen. Consult Appendix B for an example of this process.
Because illuminance non-uniformity may result from ambient light entering the scan surface, make sure the scanner cover is properly closed and minimize ambient light sources. The cause may also be poor scanner design: if illuminance non-uniformity cannot be eliminated by removing ambient light, do not use the scanner.

© Government of Canada, Canadian Heritage Information Network. 133967-0020
Figure 9. Illuminance non-uniformity. Light from an illuminated section of an image bleeds into darker sections.
To prevent illuminance non-uniformity, FADGI recommends the following for objects that can be scanned by flatbed:
- For special collections and rare materials, less than 5% is acceptable, and less than 1% is ideal.
- For general collections and documents, less than 8% is acceptable, and less than 1% is ideal.
Colour misregistration
Colour misregistration results from misaligned RGB colour plans that cause colours not to appear exactly where they should. It is most obvious where a sharp edge occurs between light and dark. The effect is becoming more common as increasingly affordable scanners use lower-end components.

© Photo courtesy of a private individual
Figure 10a. Cat image. No colour misregistration is apparent.
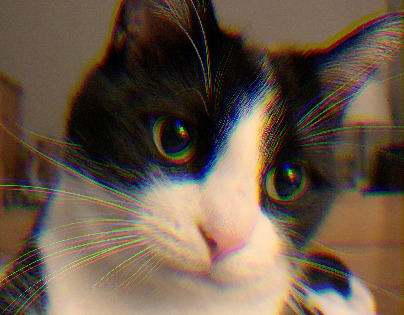
© Government of Canada, Canadian Heritage Information Network. 133967-0010
Figure 10b. Cat image with colour misregistration. Note the “rainbow” effect in longer whiskers and reflection in the eyes. The effect has been exaggerated in this example. It is usually limited to a few pixels or less.
Colour misregistration can be detected by scanning high contrast borders, for example, black and white edges. The degree of misregistration can be counted in pixels by zooming in on the scanned image in border areas.
To limit colour misregistration, FADGI recommends the following:
- For special collections and rare materials, no more than .8 pixels is acceptable, and no more than .33 pixels is ideal.
- For general collections and documents, no more than 1.2 pixels is acceptable, no more than .33 pixels is ideal.
Calculating misregistration of less than one pixel is beyond the scope of this document. Suffice it to say, if any border pixel displays a clear RGB imbalance, do not use the scanner.
Other equipment required for flatbed scanning
In addition to the flatbed scanner, you will need the following equipment.
- A computer with an optical (CD) drive to read files associated with the IT8 colour targets. This guide gives examples for a laptop using a Windows 10 operating system.
- Scanning software
- Most scanners come with some form of scanning software. There are also many third-party options, as well as image editing packages that will import an image directly from a scanner. Ideally, you want to select scanning software with features such as setting scan resolutions; accepting scans in both 24-bit and 48-bit colour depth and in both 8-bit and 16-bit greyscale; being able to set and use a colour profile, as described in Appendix A; and saving to a recommended file format, as described in the Digitize section. The ability to manage image components in a single scan, in other words, to select, edit and save individual sections of an image, is also useful for batch scanning small objects. Other features sometimes found in scanning software are also available in image post-processing software. They include optical character recognition, image de-skew and embedded metadata entry. Infrared dust and scratch removal is also a useful feature, but it applies only to scanning transparencies. That process is described in the supplement guide How to Scan Photographic Transparencies and Photographic Negatives.
With the exception of infrared scanning, these features are to be used in post-processing. For more information, consult the Workflow section that follows.
- Image editing software
- This software should at least be able to import common format images, import and convert an image with a colour profile (consult Appendix A), work in both 24-bit and 48-bit colour depths and allow for an image’s pixels to be tested for colour and illuminance properties. The ability to inspect image metadata is also useful. The examples in this document use GIMP, a free open-source image editing application. However, other applications, such as Adobe PhotoShop or Corel Photo-Paint, also work well.
- IT8 scanning targets (consult Appendix A and Appendix B for details)
- These are necessary for colour calibration, grey patch testing and inspection for colour misregistration. Although these targets are available from various sources, the targets used in this guide were purchased for about $12 each from IT 8.7 Scanner Calibration Targets at Coloraid. Note that the targets include an optical disk with colour information.
- Air blower
- An air blower with a manually operated squeeze bulb is preferred to canned compressed air, as compressed air can, on occasion, eject its contents in liquid state. Some manually operated air blowers are equipped with a filter to help reduce the possibility of dust being blown onto the surface being cleaned.
- Lint-free cloth suitable for cleaning optics, to clean the scanner platen.
- Reagent grade isopropyl alcohol or a dedicated lens cleaner, to clean the scanner platen.
- Gloves. The Canadian Conservation Institute (CCI) recommends lint-free nylon or cotton gloves for handling photographic prints, and archival gloves or washed hands for all other forms of paper.
Workflow
Workflows will differ for each environment. Before designing the workflow for your institution’s digitization project, you may want to refer to other project planning documents, for example, Capture Your Collections: A Guide for Managers Who Are Planning and Implementing Digitization Projects. Figure 11 summarizes the key components in a typical digitization workflow, as identified by FADGI.

© Government of Canada, Canadian Heritage Information Network. 133967-0021
Figure 11. Digitization workflow diagram.
This is a sound basis for developing your institution’s workflow, but feel free to modify it to suit your needs. If your institution has assigned more than one staff member to the digitization process, consider adding or moving resources (labour and equipment) to balance the workflow. For example, a team managing a larger collection with disparate material may divide work by artifact type so that some steps can be completed concurrently. The workflow steps are described in detail as follows.
Step 1: Select materials
Generally speaking, you will select your materials before beginning any digitization.
The UNESCO/PERSIST Guidelines for the selection of digital heritage for long-term preservation (PDF format) can help you prioritize what to digitize. While the criteria laid out in these guidelines are meant for digital preservation, they apply equally well to digitization.
If the materials you select differ enough in scanning requirements, group them according to those requirements. Otherwise, group them in a way that simplifies your documentation process.
During this selection process and in subsequent workflow steps, handle materials as follows, as per the CCI publication Caring for Paper Objects.
- Handle objects as little as possible.
- Use clean cotton gloves, or wash hands well before handling.
- Use both hands to handle paper objects.
- Keep loose paper objects resting on a solid support while displacing them; hold them securely between two solid supports when turning them over.
- Plan the route for moving paper objects, and move slowly and deliberately.
- Use trolleys for transporting large or heavy items.
- Carefully organize oversized works and clearly label their folders to prevent excessive handling.
- Write out a set of handling procedures, and ensure compliance of all users. Post the handling procedures in the study area.
- Ensure that furniture used to examine objects in the study area has smooth surfaces, is easy to clean and is large enough to spread objects out on. Avoid cleaning products that may leave an oil or wax residue.
When handling photographic prints, avoid placing fingers directly on the print surface.
Step 2: Evaluate condition
Generally speaking, you will evaluate the condition of all materials before beginning any digitization.
If the objects are physically unstable or contain mould, or if their condition in any way prevents them from being properly handled and digitized, address these issues before proceeding.
For flatbed scanning, fragile documents may be laid directly on the scanner’s glass platen. Before and after scanning, protect these documents using folders or similar means.
To manage and treat mould, refer to the CCI Technical Bulletin 26 Mould Prevention and Collection Recovery: Guidelines for Heritage Collections.
Step 3: Catalogue and create metadata
Generally speaking, several objects are catalogued before digitization begins.
For museum environments, digitized copies are referenced by their analog (physical) original. Thus, cataloguing and creation of metadata for the original object may already be complete. If not, complete this step with several objects before digitization begins. For more information on cataloguing in museum environments, refer to the CHIN Guide to Museum Standards. Once catalogued, digital objects will be tied to the original object through that object’s catalogue number, often by including the catalogue number in a digital copy’s file name. File naming will be described further at the Archive step.
In addition to cataloguing, technical metadata is added, often automatically, at the Digitize and Post-processing steps.
Step 4: Prepare for digitization
Generally speaking, several objects are prepared before digitization begins to create a buffer of items ready for digitization. The preparation stage is then balanced with other activities in the workflow to maintain this buffer.
Complete all conservation treatments before preparing for digitization.
You must also prepare the workspace. The initial project planning phases typically include planning, if not implementing, the workspace. For more information, consult Capture Your Collections: A Guide for Managers Who Are Planning and Implementing Digitization Projects. The workspace must be physically established before you prepare for digitization. It should include a staging area where items are prepared and organized before digitization, an area for the digitization equipment and an area for items that have been digitized but have not yet been returned to the collection.
In addition to the recommendations in workflow Step 1: Select materials, make sure the digitization workspace satisfies the following requirements:
- it is far enough away from high-traffic areas and where other activities take place;
- it is free of intense sources of non-controllable lighting, such as direct sunlight;
- it is large enough to lay out and inspect work;
- it contains ample controlled lighting to inspect and clean objects and the scanner platen;
- it is free of clutter from non-digitization activities; and
- it is free of dust, dirt, oils, food and liquids.

© Government of Canada, Canadian Heritage Information Network. 133967-0023
Figure 12. Workspace for small flatbed scanning projects. The carpeted flooring in this COVID-19 home set-up is not recommended, as it traps dust. The space is well away from other traffic and ambient light, making it otherwise suitable for small projects. A separate table nearby to lay out materials is recommended for larger projects.
As shown in Figure 13, all objects in the staging area should be labelled (loose-leaf paper folded about the objects will suffice) with the following information:
- Object ID (catalogue number)
- Object name
- Short description of object
- Object dimensions
- Scans that need to be taken
- File format to be used
- Resolution to be used
- Bit depth to be used
- Image capture mode (greyscale or colour)
The label stays with the object while it is in the digitization workspace and is temporarily removed only during the scan process.

© Government of Canada, Canadian Heritage Information Network. 133967-0024
Figure 13. Photo of original objects labelled for scanning. These labels are simply folded sheets of paper that envelop the object to be scanned.
Setting a colour profile
Next, you need to set a colour profile. Sometimes, confusingly, this is also referred to as calibration or colour calibration. Setting the colour profile ensures that the colours in a scanner image are correctly interpreted to match the colours in the original object.
Most advanced scanning software allows colour profiles to be set automatically. Once set, that profile is automatically applied to every image produced by the scanner. We highly recommend setting a colour profile, because it is more accurate than using white balancing to adjust recorded colours to those in the original object.
Scanner manufacturers will often provide a colour profile for each scanner model they produce. Using factory-set profiles will yield more accurate colours than using no profile. However, we recommend that you set the profile yourself, as individual scanners may interpret colour information differently.
To set and use a colour profile, proceed as follows.
- Make sure your scanning and editing software is able to use a colour profile once it has been created.
- Make sure you have software that is capable of generating a colour profile.
- Acquire IT8 scanner targets: reflective targets defined by the American National Standards Institute (ANSI) with known colour values set at known locations.
Recreate scanner colour profiles before starting any large project. Refer to Appendix A for an example of how to create a profile, verify its accuracy and apply it.
Step 5: Digitize
This is the actual process of scanning. Because of frequent backlog, this process is run constantly.
The steps of this process are as follows.
- Inspect platen surface for dust and dirt, and clean if necessary. We recommend using optical lens cleaner or reagent grade isopropyl alcohol and a lint-free cloth. Always apply the lens cleaner or isopropyl alcohol to the cloth and not directly to the platen.

© Government of Canada, Canadian Heritage Information Network. 133967-0025
Figure 14. Cleaning the platen using a lint-free cloth. Avoid touching the glass with bare hands.
- Place the object to be scanned face down on the scanner platen, away from the edges of the glass surface. Keep in mind the CCI handling recommendations outlined in Step 1: Select materials. Although it seems practical to use the edges as a guide to properly align the document, this is not recommended for the following reasons:
- Illuminance non-uniformity from ambient light is more likely along the edges of the platen. This can happen when a thicker object prevents the scanner lid from closing properly. You can perform a grey patch test to test for variances in illuminance (consult Appendix B).
- The scanner may not fully scan to the edge of the glass. You can test for this as well, but it is best to stay away from edges.
- Most importantly, leave a border around all scanned objects. This best practice guarantees that you capture the object. The CMH/BNF/BANQ guidelines (in French only) recommend 0.25 to 1.0 cm around all edges of the object.

© Government of Canada, Canadian Heritage Information Network. 133967-0026
Figure 15. Placing a single object on the platen. When working with photographic prints, avoid touching the surface of the print with bare hands. Gloves reduce the chance of inadvertently smudging the platen surface, but they can decrease tactile senses and dexterity. Consult the Gloves: pros and cons section of the CCI publication Handling Heritage Objects.
- If you are scanning more than one object at the same time, arrange them on the platen with at least 1 cm around them.

© Government of Canada, Canadian Heritage Information Network. 133967-0027
Figure 16. Multiple objects on the platen. Note the spacing around the objects.
- Verify scan settings: colour profile, colour or greyscale, resolution, bit depth and output file format.
For VueScan, we recommend the following procedure. Other software may differ.
When you first open the software, reset all options, then correct the defaults to what is required. From the “File” menu, select “Default Options,” then from the “Inputs” tab, select “Options: Professional.”
To preview and scan reflective objects of unknown dimensions, use the following VueScan settings.
- “Input” settings
- Options: Professional
- Task: Scan to file
- Source: Scanner name
- Model: Flatbed
- Media: Color
- Media Size: Custom (to scan media of any size)
- Scan resolution: 600 ppi (recommended by FADGI)
- Auto-skew: Do not check, as manual de-skewing is more accurate
- Number of passes: 1 (increase this number to improve signal-to-noise ratio if this is a problem for your scanner)
- File type: TIFF
- TIFF file name: Date (yyyy-mm-dd, followed by a numeral that will increase by one with each subsequent scan)
- All other settings: Default
- “Color” settings
- Color balance: “Auto levels”
- Scanner color space: ICC profile (consult Appendix A)
- Scanner ICC profile: scanner.icc (consult Appendix A)
- Scanner IT8 data: scanner.it8 (leave this entry as is)
- All other settings: Default
- “Output” settings
- Default folder: Indicate the folder to which you want the image file written
- File type selected: TIFF (unchecking this box will allow you to select JPG or PDF, and subsequent options will change according to the file type selected)
- All other settings: Default
- Produce a scan preview. Check alignment (skew) of the scanned image. Minor skew can be addressed by rotating (de-skewing) the image using software, but it is always better to properly align the original object. Consult Skew for more information.
In VueScan, the procedure is as follows.
- Click “Preview” at the bottom of the screen. A low-resolution pass will be made across the entire platen. A rough scan of objects on the platen will be displayed under the “Overview” tab, in the right half of the application window.
- A dotted frame will appear around the objects to indicate the area to be scanned at higher resolution. Click and drag this framed area to redefine the desired scan area. Leave a space of at least .25 cm around the object being scanned.
Note: You may choose to use the de-skew feature in VueScan. However, the de-skew process in GIMP is more accurate (described under Post-processing). In designing your workflow, you will need to decide between efficiency, that is, using one application for scanning and post-processing, and accuracy, that is, using two applications.
Check for debris or other artifacts that are not part of the original object. If you detect artifacts, remove the object, clean surfaces and re-scan. These and other scan issues are described in more detail in the Common flatbed scanning issues section.
- Select components of the scan preview, then produce a final scan. In VueScan, the procedure is as follows.
- By now, you have selected the first area to complete a detailed scan. Click “Scan” to save a high-resolution version to file. Note that because a colour profile was generated, it will be embedded in the scanned image. When the image is imported to a photo editing package such as PhotoShop, Photo-Paint or GIMP, the profile will be used to adjust scanned colours to better match the object’s true colours.
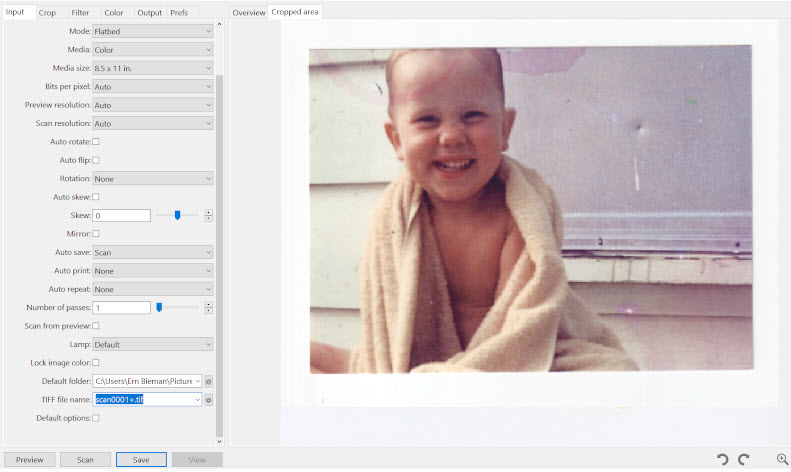
© Government of Canada, Canadian Heritage Information Network. 133967-0028
(Photo courtesy of a private individual)
Figure 17. Screenshot of VueScan after selecting a single object and producing a scan.
Note that some VueScan processes are carried out in post-processing, but you can complete them at this point if you wish. These include cropping and de-skewing. This guide gives instructions for both processes using the GIMP application, but you can explore various ways of completing them.
Optical character recognition (OCR) can also be produced in VueScan. Simply check the option under the “Output” tab. The text will be saved to a plain text file specified in the “Optical text file name” box, immediately below the OCR option. We recommend that you give the OCR text file the same name as the image. For instance, if you have specified an image file name as “YYYY-MM-DD-0001+.tif,” then the text file name should be “YYYY-MM-DD-0001+.txt.”
- Add (or verify) embedded metadata to the scan image.
The metadata that can be added by scanning software varies with the package. For VueScan, there is a section in the “Output” tab for metadata fields. The fields available for data entry will vary depending on the image file format. All formats contain a “Description” field and a “Copyright” field. Fill them out as needed. Also input the date scanned, if applicable. The file name includes the catalogue number (object ID) of the scanned object. You can also put it in the description, as it is a unique identifier that ties the image to the collections management system (CMS) record.
Embedded metadata is desirable because it cannot be separated from the image. However, manually entering metadata already in a CMS record is a duplication of effort. For that reason, include minimal metadata to link the object to the CMS record, then focus on metadata about the scanned image itself, for example, when was it scanned, who scanned it and what software did they use.
- Save the scanned image in the correct format. In VueScan, this is done automatically after the scan is completed
If possible, save in a file format that is suitable for preservation. At the very least, make sure the format is “lossless.” This means that image information is not lost when the file is compressed for storage or is saved again after cropping or other post-processing. A standard jpeg file (not JPEG 2000), for instance, is an example of a “lossy” file format that should be avoided. The following is a list of other attributes of preservation file formats.
- They are widely adopted within and outside the digital preservation community.
- They are well documented and open to inspection, that is, easy to read or decode.
- They have minimal dependencies, meaning they rely on no proprietary hardware, operating systems, software, external font information or other external data.
- They allow internal metadata, meaning metadata can be embedded directly in the file.
- There is no legal barrier to their use, meaning a licence is not required to write to, store, access or copy.
- They have backward and forward compatibility, meaning newer versions will work in older applications, and newer applications can access older versions.
For more information on these and other preservation criteria, as well as details on recommended preservation formats, consult the National Heritage Digitization Strategy – Digital Preservation File Format Recommendations.
FADGI recommends the following file formats:
- TIFF or JPEG 2000 for all maps, posters and oversized materials.
- TIFF, JPEG 2000 or PDF/A for all other items that can be digitized by a flatbed scanner.
Regardless of the format you choose, minimize the number of times the image must be migrated from one format to another, as every migration may cause you to lose image information. Ideally, the format used to store the image for long-term preservation should be the same format used to carry out post-processing. It should also be the same format to which the file was saved by the flatbed scanning software.
File management and version control
Before moving to the next steps in the workflow, we need to look at file versions and file management.
Scanned image files are classified into three main groups, as follows.
Preservation master or archival master: This is the original scanned file. Apart from some basic cropping, it has not been edited in any way. It is sometimes referred to as the raw scan. However, that term is technically incorrect, as strictly speaking a raw image file is one of multiple proprietary formats produced by imaging hardware. Always save the preservation master for long-term preservation. TIFF or another comparable format is acceptable.
Production master or service master: This file has been edited in some way, as described in Post-processing. Colours may be balanced, tone levels may be optimized, the image may be de-skewed, dimensions may be normalized and filters may be applied to “clean up” the image’s appearance. The production master is also saved for long-term preservation. For most projects, the production master is the most practical file to access.
Derivative files or access files: These files are copies of a master file and are used for various projects. They may be edited in various ways. They are not saved for long-term preservation.
Consult Appendix C for tips on scanning oversized objects.
Step 6: Post-processing
This step may be labour intensive. It can be carried out while the scanner is digitizing other objects.
Post-processing improves an image’s accessibility and usability. We recommend preserving both the original scan (preservation master) and the post-processed version (production master). Your editing software may convert the production master’s ICC colour profile to a colour model. For example, see the tasks that follow. Conversely, the preservation master will retain the unconverted ICC profile, allowing it to be imported to any colour model later, as needed. For file naming conventions, consult the Standardize file naming and directory structure section.
The following are typical post-processing tasks:
- Adjust files to a standard image specification.
- grey and white balancing
- de-skewing
- cropping image and standardizing dimensions
- Document technical metadata.
- Standardize file format.
- Standardize file naming and directory structure.
Details on each of these steps follow.
Adjust files to a standard image specification
Grey and white balancing
Grey balancing is the process of adjusting colour levels to ensure that RGB levels in areas of the original object are equal to those in the scanned result.
White balancing adjusts colour levels so they are maximized evenly in all three channels for areas of the image presumed to be perfectly white.
The same process can be done to areas presumed to be perfectly black. Adjust colour values in all three channels so they appear as zero in these areas.
Given that the goal of scanning an image is to recreate the colours in the original object, balancing grey and white presupposes that the image contains sections that are perfectly grey, white and black. Accordingly, the best way to adjust these levels is to include a greyscale chart in the scan. If you do not have a greyscale chart, you can use a section of the image presumed to have perfect white.
The steps in this guide do not require grey or white balancing. The guide also does not require the more involved process of adjusting colours across the spectrum, as is often done in digital photography. Instead, CHIN recommends using an IT8 colour target to establish a colour profile (described in Appendix A) in the preparation stage. Setting a profile upfront ensures that the scanner and software will include a mapping of scanned colours to anticipated colours for each scanned image.
Balancing white or grey to adjust colour levels on an image that already has a colour profile (described in Appendix A) will actually decrease colour accuracy. In fact, CHIN found that using the automated white and grey balance features in GIMP on an image with an IT8-based colour profile increased Delta E (colour distance) by a mean value of 2. Therefore, white or grey balancing is not recommended on a master image created as described in this guide.
If, for some reason, you cannot set a colour profile in advance, balancing white or grey can improve colour accuracy.
You may also wish to use white balancing for aesthetic reasons on derivative files, for example, to make whites lighter and blacks darker. If you choose to do this on an image that already has a colour profile, be sure to save the image as a derivative.
GIMP has an automated feature for white balancing. There is ample online support for using these features. Typically, other photo editing software also contains white and grey balancing features.
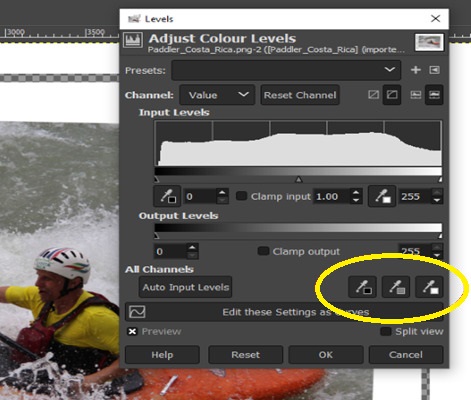
© Government of Canada, Canadian Heritage Information Network. 133967-0030
(Photo courtesy of a private individual)
Figure 18. Automated white balancing features in GIMP. Clicking on a black, grey or white eye dropper in the circled area, then clicking on a section of the image that is supposed to be perfectly black, grey or white will minimize RGB levels to zero for black, balance RGB levels for grey and maximize RGB levels for white. Note, however, that using these features decreases colour accuracy on images that already have profiles established with IT8 colour targets, as described in Appendix A.
A note on editing files that have associated colour profiles
When opening a scanned image that has a colour profile, a photo editor application will recognize the profile and recommend converting the image.
If you intend to edit colour information, convert the image using the profile. In GIMP, select “Convert” when the option is presented.
However, if you do not intend to modify colour information during post-processing, keep the colour profile separate so it can be imported to any future colour model, as required. In GIMP, select “Keep” when the option is presented.
If you are keeping the colour profile separate, save the profile with the image once you have completed post-processing. In GIMP, select “Export as...” from the “File” menu, then name the file and click “Export,” then check “Save colour profile” in the dialogue box that appears.
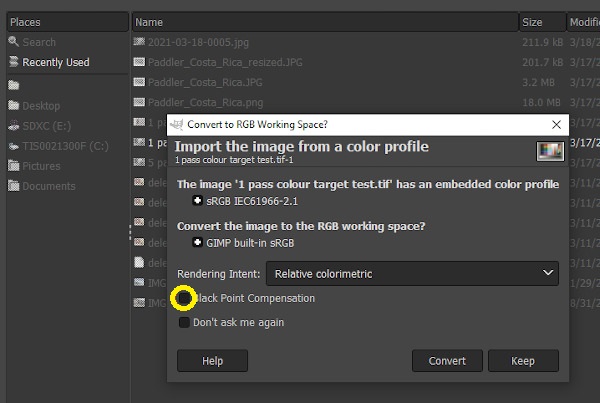
© Government of Canada, Canadian Heritage Information Network. 133967-0032
Figure 19. Importing an image with a colour profile to GIMP. If you choose to convert, do not use Black Point Compensation, as this feature modifies colours to make dark features appear darker when viewed on a computer monitor.
De-skewing
De-skewing an image means rotating the image to align the edges along vertical and horizontal axes. Consult Skew for more information, including an example of the de-skewing process.
Cropping image and standardize dimensions
This is the process of removing extraneous image information from around the scanned object and saving the final image to standardized dimensions.
As a rule, images should be cropped to have a border of at least 0.25 6 mm. Often, an organization will crop all border information and standardize the size of the remaining image. The result can be saved as a production master as long as you keep a previous copy that retains border information.
Some scanner software may have a crop feature. Regardless of the software, the final crop should be done after de-skewing. The process for cropping an image and standardizing dimensions is described here using GIMP.
Steps to crop an image and standardize dimensions in GIMP
- After de-skewing an image, make sure the ruler is displayed around the work area and a grid is shown as a guideline with grid squares.

© Government of Canada, Canadian Heritage Information Network. 133967-0034
(Photo courtesy of a private individual)
Figure 20. Cropping step 1. Click on the “View” menu and make sure “Show Grid,” “Show Rulers” and “Show Statusbar” are all selected.
- Set the grid lines to appropriate working dimensions (1/4 inch for instance).

© Government of Canada, Canadian Heritage Information Network. 133967-0036
(Photo courtesy of a private individual)
Figure 21. Cropping step 2. Click on the “Image” menu, then “Configure Grid.” Set the spacing to inches and adjust the spacing dimensions to an appropriate value such as 0.25 inches.
- Use the move tool to reposition the image so as to include a border along the top and left sides. Then use the crop tool to crop the bottom and right sides to a standardized image size.
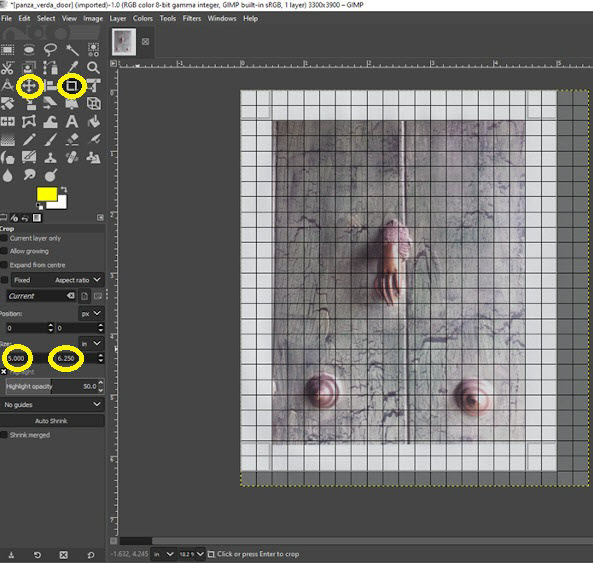
© Government of Canada, Canadian Heritage Information Network. 133967-0038
(Photo courtesy of a private individual)
Figure 22. Cropping step 3. Click on the move tool, then click and drag the image to create a border along the top and left sides. Next, click on the crop tool, then click and drag the crop tool pointer to create a frame encompassing all of the top and left sides of the image, as well as an undefined portion in the lower right area of the image. Once you have created the cropping frame, click in the size fields of the crop dialogue box and type in the exact width and height of the image to retain. As a rule, your cropped work should contain an even border of at least 0.25 inches around the scanned image. The digital image to be saved should have a standardized width and height to match similar items in your collection.
Document technical metadata
Technical metadata includes details such as when the image was created, the equipment and software that were used, and the software that was used in post-processing. Several media formats use a standardized method (EXIF) to record this information directly in the media file. Often, EXIF information is created automatically. This is true of the VueScan software used in the examples in this guide.
To see the metadata already in your image, proceed as follows.
With a scanned image loaded in GIMP, select the “Image” pulldown menu from the top of the screen, then select “Metadata” from the bottom of the menu, then select “View Metadata.” A “Metadata Viewer” dialogue box will appear with three tabs (Exif, XMP and IPTC). The Exif tab will contain several fields describing technical details of the scan.

© Government of Canada, Canadian Heritage Information Network. 133967-0040
Figure 23. Metadata Viewer dialogue box in GIMP that shows some of the Exif metadata for an image produced with VueScan.
We also recommend adding descriptive metadata at this point. However, keep in mind that hard-copy items should already be documented in a CMS. Including some basic descriptive metadata helps keep the image with the original record. Should the original record be lost, that basic information, such as the title, description, authorship and copyright, is retained.
To add descriptive metadata to an image in GIMP, select the “Image” pulldown menu from the top of the screen, then select “Metadata” from the bottom of the menu, then select “Edit Metadata.” A “Metadata Editor” dialogue box will appear with several tabs. The most important for our purposes is the “Description” tab, with the “Document Title,” “Author,” “Description,” “Copyright Status” and “Copyright Notice” fields. You can edit these fields as needed. Once completed, they will appear under the XMP tab in the “Metadata Viewer” dialogue box.
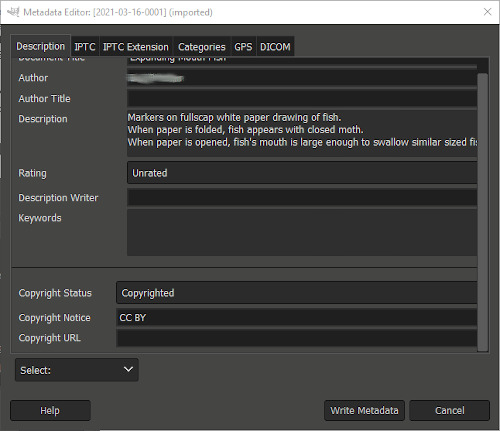
© Government of Canada, Canadian Heritage Information Network. 133967-0042
Figure 24. The “Description” tab in the “Metadata Viewer” dialogue box.
For information on other preservation metadata, consult the section about metadata in CHIN’s Digital preservation recommendations for small museums.
Standardize file format
If your scanner software could not save to a recommended format, any file you intend to access in the long term must be migrated to such a format at this point. Most post-processing software has an export feature for this purpose.
FADGI recommends the following file formats:
- Save all maps, posters and oversized materials to TIFF or JPEG2000.
- Save all other items that can be digitized by a flatbed scanner to TIFF, JPEG 2000 or PDF/A.
Save both your production master and archival master to one of the preservation formats.
Standardize file naming and directory structure
As a reminder, there are three main types of image files:
- the archival or preservation master file produced by the scanner;
- the post-production or service master created during post-processing; and
- derivative or access files that can be edited or modified for specific projects.
All three file types should be kept separate. To avoid inadvertently deleting or modifying master files, clearly name them and store them in separate directories, drives or equipment with restricted access.
The following are best practices for naming files.
- Clearly indicate whether the file is a master or derivative file with a prefix such as “ARC,” “PRO” or “ACC.”
- Include the catalogue number or object ID of the original object. When possible, use numbers of a fixed length. Use leading zeros if necessary.
- If there is more than one image of the object, use a suffix in the file name to differentiate the images. For example, use “verso” for a scan of the back of the document.
- If the file name contains a date, use the numeric format of “yyyymmdd” so you can sort the file names chronologically.
- Avoid spaces in a file name, as some utilities may have difficulty managing them. Instead, use a character such as the underscore in lieu of the space.
- Avoid any other special characters, such as those that may not function properly if the file name is used as part of a web address.
For instance, the file name “PRO_0335467_DETAIL.TIF” may indicate a production master file containing detailed imaging information of the object bearing catalogue number 0335467.
Create derivative files
This step is exactly as the name suggests. Access to master files should be kept restricted. Therefore, we recommend immediately creating derivatives, or copies, for general access. The file name prefix “DER” or “ACC” will help avoid confusion between these and master files. Derivative files may be identical to master or post-production files, or they may be of lower resolution.
Step 7: Quality review
Quality is typically reviewed on a sample section of digitized materials after several have been digitized and post-processed. Initially, we recommend performing quality review frequently, that is, every image or every few images. As the process becomes routine, you can reduce the frequency.
A quality review should include the following:
- verification of file format, scan mode (grey or colour), bit depth, resolution and image dimensions;
- visual inspection of image for distortion, skew, cropping errors and artifacts;
- review of standardized image dimensions and minimum border requirements;
- confirmation that EXIF metadata was retained and descriptive metadata was correctly entered;
- review of file name including proper prefix and catalogue number;
- review of file location; and
- verification that all planned scans of an image and all objects in a batch were completed.
You should also periodically review scanner output for features not readily apparent by simple visual inspection. This includes scanning an IT8 target to measure the following:
- colour distances of known colours in the target (consult Appendix B);
- grey patch testing for colour uniformity (consult Appendix B); and
- grey patch testing for illuminance non-uniformity (consult Appendix B).
Step 8: Archive
This activity is typically carried out at regular intervals. The process varies depending on the type of institution. For more details on long-term preservation, particularly for museums, consult CHIN’s Digital Preservation Toolkit.
Step 9: Publish
This is typically the end goal of any digitization activity. It varies according to the institution’s technology and its intended use of the digitized content. In general, publishing occurs outside the typical digitization workflow. However, it may be included if a digital asset management system is available.
Master files are generally too “heavy” for online publication. Instead, use lower-resolution derivatives or “access copies.”
Common flatbed scanning issues
A number of issues can arise at the Digitize step, particularly when completing the scan preview and the scan itself. This section covers such issues and possible remedies.
Skew
In digital imaging, skew refers to the misalignment of an image. Skew results in an image appearing crooked, that is, neither parallel nor at right angles to the lines around it.
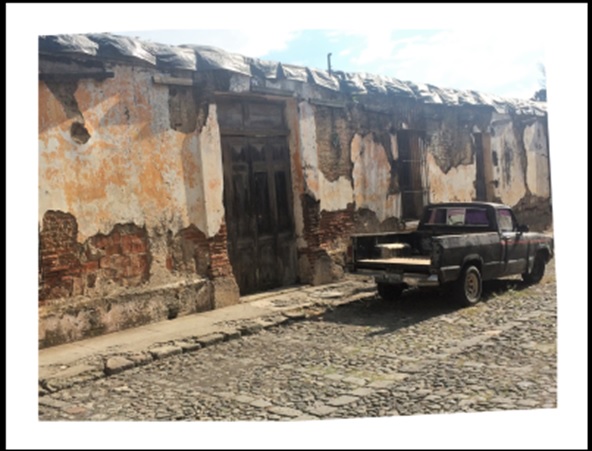
© Photo courtesy of a private individual
Figure 25a. Skewed photograph of a truck along a wall. The skew is most noticeable along the lower border.
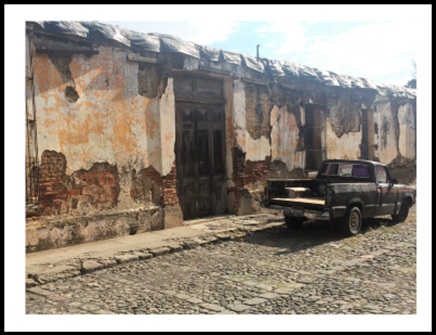
© Photo courtesy of a private individual
Figure 25b. The same photograph of a truck along a wall. The skew has been corrected.
Minor skew issues can be corrected by scanning software at the digitization step, and by image editing software at the post-processing step. Scanning software will sometimes have an automated de-skewing feature that guesses at the object borders and realigns the image according to them. For manual de-skewing, a grid feature is often available that allows a user to “grab” a corner of the image and rotate it until the object borders align with the horizontal and vertical axes of the grid.
In GIMP, the de-skewing process is as follows:
- Open the image in GIMP.
- Select the “View” tab and turn on “Show Grid.” A grid will appear on top of the image and can be used as a guide.
- Select the “Rotate” tool either from the tool menu on the left or by clicking “Tools: Transform Tools: Rotate” in the toolbar.
- Click in the centre of the image. A “Rotate” dialogue box will appear.
- Change the degree of rotation in the dialogue box until the edges align with the grid.
- Click the “Rotate” button in the dialogue box to complete the image rotation.
- Remove the “Show Grid” option from “View” to inspect the rotated image.
- The rotation is complete. You can edit further or export the image to the desired format by selecting “File: Export As” in the toolbar.
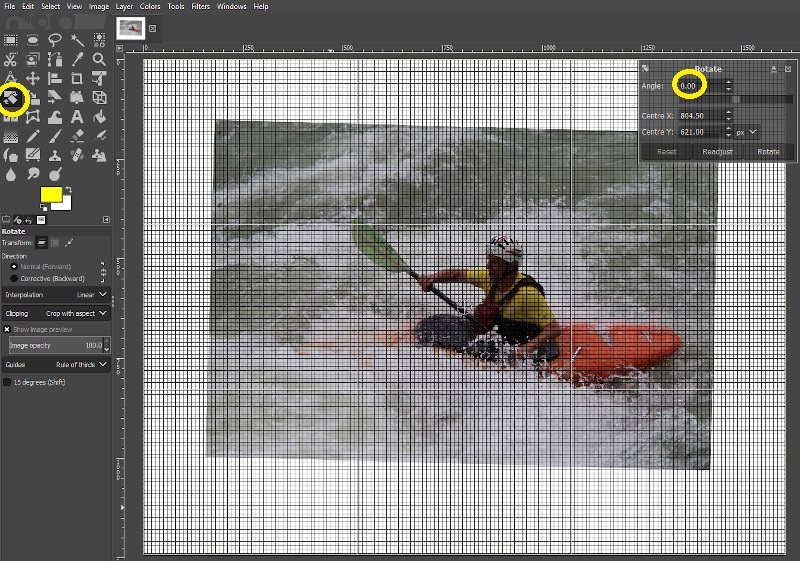
© Government of Canada, Canadian Heritage Information Network. 133967-0044
(Photo courtesy of a private individual)
Figure 26. This image is being de-skewed using the “Rotate” tool in GIMP. The “View Grid” option has been turned on to help align the image vertically. You can click and drag the “Rotate” tool, but you will get more accurate results using the “Rotate” dialogue box.
Note that using software to de-skew decreases the effective spatial resolution of the image.
FADGI recommends the following practices for de-skewing:
- For oversized items such as maps and posters, no de-skew is permitted for FADGI’s 4 stars, that is, the highest level of quality. Instead, images must be scanned to a +/- 1 degree tolerance. For lower quality on these objects, FADGI makes no recommendations. However, members of Canada’s digitization and digital preservation discussion group recommend not using software to de-skew any non-right angled rotation exceeding 5 degrees.
- For newspapers, prints and photographs, FADGI makes no recommendations for de-skewing using software. However, members of Canada’s digitization and digital preservation discussion group recommend not using software to de-skew any non-right angled rotation exceeding 5 degrees.
Image artifacts
Image artifacts include dust, dirt, smudges and scratches.
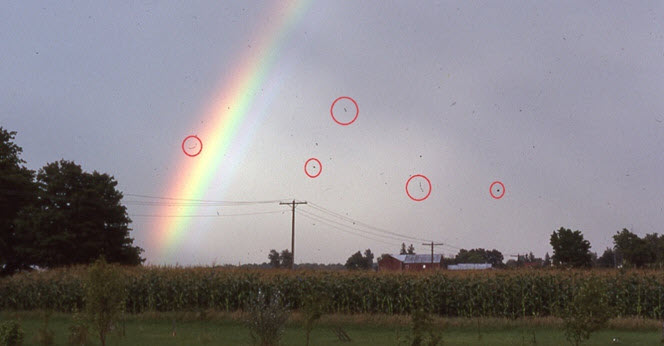
© Photo courtesy of a private individual
Figure 27: Scanned photograph showing image artifacts such as dust and dirt.
For dust, dirt and smudges on the platen, clean the surface using reagent grade isopropyl alcohol or lens cleaner and a lint-free cloth. Always apply the lens cleaner or isopropyl alcohol to the cloth rather than the platen. To clean the object being scanned, use a manually operated air blower with a squeeze bulb. For additional treatment, refer to CCI Note 11/7 Basic Care of Books. For scratches on the platen, replace the glass or scanner.
Moiré
Moiré is a pattern that appears on digitally generated images that does not exist in the underlying object and that was produced by regularly occurring detailed components of the image aligning and misaligning with the rows and columns of pixels that make up the image. As alignment of small image components improves or degrades, the wave-like moiré pattern increases or decreases.
Moiré commonly occurs in images such as the following:
- an interviewee appearing on camera in a finely striped or patterned shirt
- newspapers photos scanned at lower resolutions

© Government of Canada, Canadian Heritage Information Network. 133967-0046
Figure 28. Moiré: This image is a photograph of a crushed window screen. It was taken at a low enough resolution to produce moiré.

© Government of Canada, Canadian Heritage Information Network. 133967-0047
Figure 29. This photograph is taken at a higher resolution than the previous image. Because there are several pixels per “square” of the window screen, any harmonic pattern that exists is not evident. Two ways to eliminate moiré are to increase the resolution or skew the image.
Causes:
- scanning newsprint images
- scanning repeating patterns with dimensions close to scan resolution
- scanning patterns that line up, or nearly line up, with scan raster
Solutions:
- Change the scan resolution to a non-multiple of the original resolution.
- Skew the object being scanned, then de-skew in post-production.
- Apply de-screening filters such as Gaussian-blur or image softening.
Aliasing
Aliasing is a staircase effect that appears along high contrast edges, particularly those that are closely but not perfectly aligned with a digital image’s raster of pixels. The effect generally appears only in bitonal scans, as greyscale can be used to soften the uneven appearance of a staircase edge.

© Mwyann, 2009. (Available on Wikimedia Commons.)
Figure 30. Aliasing: The bitonal capital letter “A” on the left features a prominent staircase effect. The greyscale version of the same letter uses intermediate shades to soften the staircase “edges,” giving the appearance of a smoother edge.
Aliasing rarely appears in greyscale or colour scans. If it does, increase the scan resolution. Low-bit depth may also contribute to the problem. Skewing the object on the platen, then de-skewing the image may also help.
The issue is more prominent in bitonal scans, which are not recommended.
Focus
This occurs when part of the scanned document is out of focus.

© Government of Canada, Canadian Heritage Information Network. 133967-0048
Figure 31. Topographical map with sections blurred. The creases from where the map was folded appear to be closer to the platen than the blurred sections.
Typically, this occurs when the document is not completely flat on the platen. If the object can be flattened without risk, close the cover fully and make sure the document is flat on the platen. If the object cannot be flattened without risking damage, consider using an alternate digitizing technique. Consult FADGI’s Technical Guidelines for Digitizing Cultural Heritage Materials (PDF Format) or the BNF/BanQ/MCH Recueil de règles de numérisation (in French only) for alternate equipment.
Newton’s rings
This phenomenon appears as a faint rainbow of rings across a highly reflective surface that has been placed against the platen for scanning. The cause is an interference pattern that occurs between the platen’s surface and the reflective surface of the object being scanned.
The effect of Newton’s rings can be reduced using editing software at the post-processing stage. However, it is better to eliminate the problem at the scan stage.
To eliminate Newton’s rings at the scan stage, you will need to separate the object from the platen. To do this, use a large format transparency tray or cut a frame from cardboard matting that has slightly smaller internal dimensions than the external dimensions of the object being scanned. You can also use anti-Newton glass.
These solutions involve raising the object away from the platen. Most scanners have a focal plane allowing objects to be raised away from the platen by as much as 5 mm, but you will need to experiment with your own equipment.
A drawback of this solution is that the frame blocks the object’s borders. Therefore, they cannot be captured in the scan. Therefore, we recommend that you produce two scanned images: one of the raised object and one of the object directly on the platen.
An alternate solution is mounting oil, which is used with drum scanners. CHIN does not recommend this process for the flatbed scanning of any cultural heritage objects.
Acknowledgements
CHIN would like to thank the following people for their invaluable contributions to this guide:
- Cassandra Tavukciyan, Canadian Museum of History
- Kathleen Brosseau, Canadian Museum of History
- Jillian Staniec, City of Red Deer, Information Technology Services
- Jean-Luc Vincent, Parks Canada
Appendix A: How to set and use a colour profile
This appendix outlines one method of creating and verifying a colour profile for a scanner. Colour profiles map the values that a scanner perceives to a range of colours in a colour space. Profiles can be created manually by adjusting colour information (not covered in this guide) or automatically by using colour targets with known colour values. Creating a profile with a target ensures that the scanner is producing an image that is true to the human-viewable colours found in the original object. If the profile is created properly, there is no need to colour balance or white balance each scanned image.
VueScan can be used to create a colour profile for a given scanner, which is then embedded into each image produced. Once that image is opened in editing software, an acknowledgement of the existing colour profile will appear. The user can choose to apply that profile to the image so that colours will be correctly mapped to the colour space being used by the editor.
Colour profiles should be created before any major scanning project, and periodically if the scanner is used regularly.
The following steps show how to create a colour profile for a scanner using the professional edition of VueScan and IT8 targets purchased from coloraid.de. IT8 scanner targets are developed as part of the American National Standards Institute (ANSI) standards for colour communications and control specifications. These targets are universally recognized as a standard to which scanner colour profiles are set.
To create a profile using VueScan, proceed as follows.
- Clean the scanner platen as described in the Digitize step of this guide.
- Remove an IT8 colour target from its protective sleeve. Avoid touching the front surface.

© Government of Canada, Canadian Heritage Information Network. 133967-0049
Figure 32. Photograph of an IT8 colour target. There are various versions for different film and paper. Note the optical disc that accompanies colour targets. The text files on this disc document the colours that appear on the chart, which are needed to correctly set the scanner’s profile.
- Place the IT8 target face down on the platen. Make sure to align it so the scanner software can identify the location of the colour pattern. Close the scanner lid.
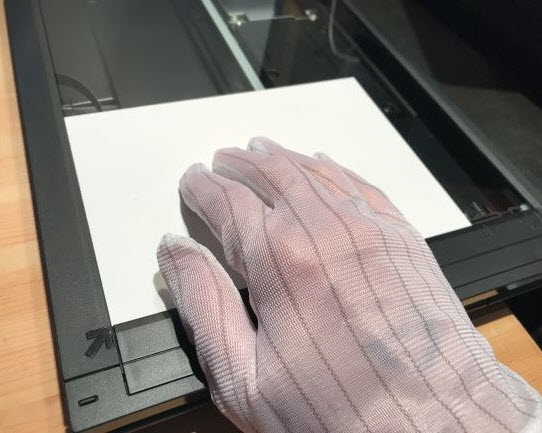
© Government of Canada, Canadian Heritage Information Network. 133967-0050
Figure 33. Placing the IT8 target face down on the platen.
- Start the computer and scanner, if not already done. Make sure the computer has access to an optical drive. Insert the disk that came with the targets, and run the VueScan application.
- In VueScan, under the “Input” tab, set the “Options” to “Professional.”
- Under the “Input” tab, set “Task” to “Profile Scanner” and make sure the correct scanner is identified under “Source.”
- Under the “Color” tab:
- Set “Color Balance” to “none”;
- Set “Scanner color space” to “ICC Profile”; and
- Set “Scanner ICC Profile” to a location where you would like to store the profile for future use by VueScan.
For the last item, use the “@” button next to this field to browse to the desired location. In the example, the path was set to “C:\Users\Ern Bieman\Pictures\VueScan\scanner.icc.” Note that the application will attempt to create a file with the “.icc” extension, but you must give that file a name.

© Government of Canada, Canadian Heritage Information Network. 133967-0051
Figure 34. Setting a path to store the resulting scanner profile as a file with the “.icc” extension. This is a binary file, meaning it cannot be opened and viewed in a text editor. The file can be stored in any location, but it should not be moved without also changing the “Scanner ICC profile” path in VueScan.
- Also under the “Color” tab, set “Scanner IT8 data” to the following path: “D:\R200209\Extras\R200209.it8.” To do this, click on the “@” button next to the field and browse to the correct data file. “D:” is the name of the optical drive. If your optical drive is located elsewhere, change accordingly. Note that this text file is required only when creating the initial profile or measuring the accuracy of the colour profile that was created (refer to step 11). Subsequently, the text file will not be required, and the DVD may be returned to its storage location. However, keeping a copy of the IT8 data file on your hard drive will give you ready access the next time you need to create a colour profile.

© Government of Canada, Canadian Heritage Information Network. 133967-0053
Figure 35. Getting IT8 data from the DVD. In this case, the necessary data is in file R200209.it8. Note that despite the “.it8” file extension, this is a standard text file that can be read with any text viewer or editor. The formatting of the text in this file is extremely important, as it will be read by the VueScan application, and it identifies the colours that should appear in each colour swatch of the R200209 IT8 target.
- Click “Preview.” The scanner will quickly scan the target and overlay the target with a wireframe outline of the target colours.

© Government of Canada, Canadian Heritage Information Network. 133967-0055
Figure 36. Wireframe overlay on target. When running a preview in “Profile Scanner” mode, VueScan produces a wireframe best guess of where the target is. Note that in this example, the best guess is quite off because the target is not perfectly aligned on the platen. There are skew features to align the wireframe, but it is easier to physically realign the target on the platen and re-scan.
- Click and drag the corners of the wireframe until they correctly outline the location of the colours on the scanned target. If your target is not properly aligned, you will need to reposition it on the platen and repeat step 9.

© Government of Canada, Canadian Heritage Information Network. 133967-0056
Figure 37. Positioning a wireframe on a colour target to create the scanner’s colour profile. Manual positioning is done by clicking and dragging edges of the wireframe.
- After you have correctly placed the wireframe, select “Profile Scanner” under the “Profile” tab at the top of the application window. If the wireframe was correctly placed, a pop-up notice will immediately indicate that an ICC file was created. If not, a pop-up notice will indicate “Make sure the image is upright and the crop boxes are properly aligned.”
After a profile has been created, VueScan will use it as a default. The scanner will use the profile unless you change the options. Be sure to leave the .icc file in its location. If you move the profile, you will need to update the “Scanner ICC Profile” location.
Verifying the colour profile
Once the colour profile has been created, it should be measured for accuracy. Details on this process will follow, in the troubleshooting section, but the general approach is described here.
- Re-scan the target as though it were a simple image.
- Open the target in GIMP.
- Allow the colour profile to be applied to the image, then sample the colours as described in Appendix B.
- Compare the results of the sample to the IT8 data for that target.
- Calculate the Delta E between the sample value and the IT8 data for that colour patch, as demonstrated in Appendix B.
Note that the target uses the CIE L*a*b* colour space to store colour information, so you will have to use that space to compare samples.

© Government of Canada, Canadian Heritage Information Network. 133967-0057
Figure 38. Sampling the top left (A1) target colour swatch in GIMP. The colour picker tool (eye dropper), its location in the top left area of the colour swatch, and the colour picker dialogue box are all circled here. The colour picker box shows sample results with colour values in the CIE L*a*b* colour space as L*: 18.3, a*: 8.9 and b*: 4.0. Refer to Appendix B for more details on this process.
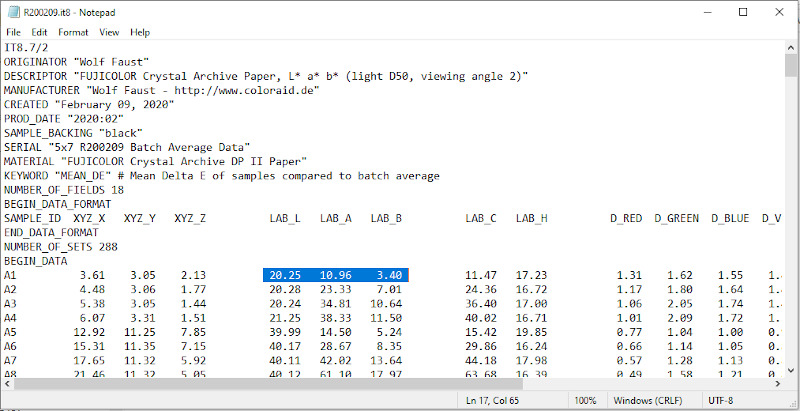
© Government of Canada, Canadian Heritage Information Network. 133967-0059
Figure 39. Inspecting the IT8 colour data file. This is the same file that was used to create the scanner profile and was taken from the DVD supplied with the IT8 targets. Note the highlighted values for the A1 colour swatch. These are the values that must be used when comparing the scanned sample to the colours that ought to be captured.
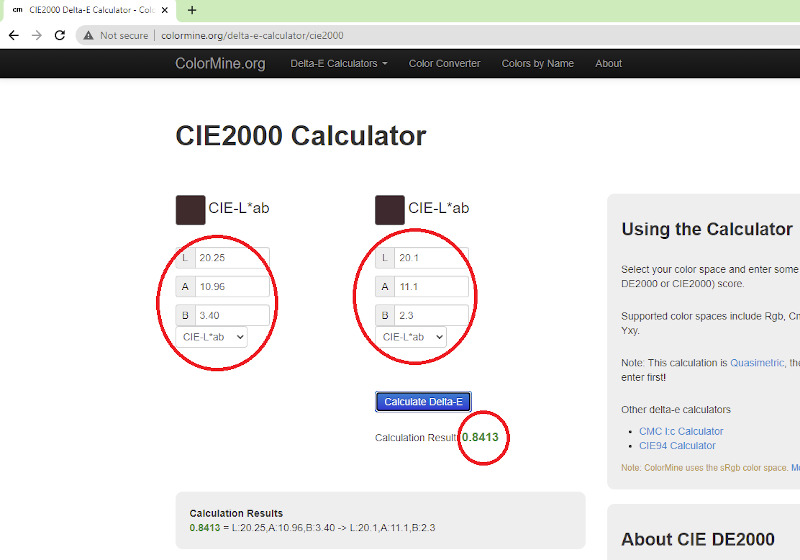
© Government of Canada, Canadian Heritage Information Network. 133967-0060
Figure 40. Using the Colormine.org site to calculate colour distance (Delta E) between the IT8 data file and the colour sample taken in GIMP of the resulting scan. The 0.8413 result indicates that there is no humanly discernable difference between the two. Not all sampled colour distances will be this low.
Samples of this sort should be repeated and compared across a number of locations on the target. FADGI uses the mean distance of these samples to determine colour accuracy.
- For general collection documents, FADGI recommends a mean colour distance of less than 10 as acceptable, but less than 3 as ideal. For all other objects that can be scanned with a flatbed scanner, FADGI recommends a mean distance (using the CIE2000 distance calculation) of less than 8 as acceptable, and less than 3 as ideal.
Troubleshooting and solutions for colour profiles that do not meet FADGI standards
No colour profile will be perfect when tested across the colour spectrum. The goal is simply to get Delta E measurements within FADGI recommended values. If you are having difficulty producing a colour profile that falls within the range of acceptability, repeat step 5 of the FADGI workflow to see if the results change. Next, review the detailed information on how to properly sample and measure colour distances.
If the profile continues to be outside acceptable ranges, there may be an issue with the signal-to-noise ratio of the scanner itself. In other words, the scanner may not consistently read colour information with each successive attempt. If this problem is suspected, increase the number of passes the scanner makes. When creating a colour profile, you can do this by increasing the number of passes, scanning the target as though it were an image, and using that image to create the profile.
This process will create a more accurate profile, but the signal-to-noise ratio issue will reappear every time the scanner is used. You will need to increase the number of passes for all future scans on that scanner. If this is not acceptable, you can try white balancing each scanned image to improve the outcome, but you may need to replace the scanner.
Appendix B: Colour sampling
This section describes the steps to sample colour in a scanned image. Additional processes that use colour sampling are also described, including the following:
- measuring colour distance (Delta E)
- using a grey patch to measure colour uniformity
- using a grey patch to detect illuminance non-uniformity
How to sample colour in GIMP
Colour sampling is briefly described in Appendix A. Here, we provide more details. Colour sampling is the process of testing colour values at specific sections of an image. Because the equipment used to produce the image always involves a certain level of noise or randomness in the values that are recorded, a single pixel is unlikely to accurately represent surrounding colour, even in areas where the colour appears uniform. Thus, when sampling what appears to be a uniform area of colour, it is advisable to increase the sample area, but only to the point where the sample area remains small enough to select colour from the desired section of the image.
To sample in GIMP, proceed as follows.
- Select the colour picker tool from the tools on the left.
- Select the “Sample average” option in the colour picker options box.
- Set the sample radius to the desired number of pixels to change the size of your sample area. Sample radii should be large enough to mitigate noise or uneven colour information, but small enough to avoid sampling undesired sections of the image. A sample radius of 15 is shown in the image that follows. Members of Canada’s digitization and digital preservation discussion group set sample radiuses as low as 5.
- Click on the area to be sampled. The results will appear in the colour picker dialogue box on the right.

© Government of Canada, Canadian Heritage Information Network. 133967-0061
(Photo courtesy of a private individual)
Figure 41. Colour sampling using the eye dropper tool. Values can be expressed in a variety of colour spaces. Currently, RGB and CIE L*a*b* are displayed.
Using an online service to determine colour distance (Delta E)
Colour distance is a quantitative way of defining the disparity between two different colours. This step is necessary when verifying the accuracy of a colour profile and identifying colour uniformity. Measuring colour distance is briefly covered in Appendix A. Here, we provide more details.
Unless otherwise noted, colour distance should be measured using the most recent formula produced by the International Commission on Illumination, that is, CIE2000. To measure colour distance using the online CIE2000 calculator, proceed as follows:
- From the pick list, select the colour space for the first sample. For our purposes, this will generally be RGB or CIE L*a*b*.
- Enter the values of the first sample.
- From the pick list, select the colour space for the second sample. This may be values provided with a colour target or values from a second sample picked from an image.
- Enter the values of the second sample.
- Click “Calculate Delta E” and note the results.
Colour distances can be calculated across different colour spaces. This site also supports converting colour values between spaces. In addition, the results of this formula are usually, but not always, identical when the order of the samples is reversed. If you wish to calculate a colour distance to multiple decimal places, after obtaining an initial result, we recommend reloading the web page, reversing the sample order and averaging any difference between the two results.
Performing a grey patch test for colour uniformity to detect illuminance non-uniformity
These processes are used to establish that colours are recorded uniformly across the platen of the scanner and to make sure stray light is not captured in the scan. A grey target is required for both these activities. The IT8 colour charts will suffice, as the area around the colour swatches is a uniform neutral grey.
When testing for colour uniformity, scan the IT8 chart at various sections around the platen. Then sample the resulting scans at various grey areas in the resulting images (consult the How to sample colour in GIMP section of this appendix). Record the results. Take several grey samples across the platen area. Be sure to increase the sample size to roughly 50% of the area of a colour swatch, and turn on the “sample average” option. Lastly, measure distances between these samples using the CIE2000 Delta E calculator, then determine the mean result by adding all distances and dividing by the number of samples. Mean sample distances of 10 or greater are unacceptable for any type of scanning. Mean distances between 8 and 10 are acceptable for scanning general unbound documents. For all other materials, the mean distance should be less than 8 for acceptable results, and less than 3 for ideal.
If your scanner exhibited signal-to-noise issues when setting a colour profile, it may also produce irregular results when testing colour uniformity. Increase the number of passes in VueScan to reduce the effect.
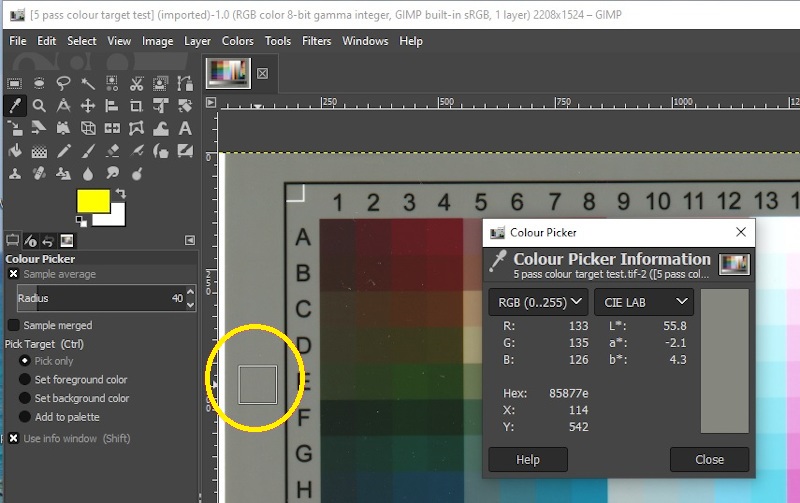
© Government of Canada, Canadian Heritage Information Network. 133967-0063
Figure 42. Sampling the neutral grey area of a scanned colour swatch. The same process is used to detect variations in both colour and illuminance. Note the enlarged sample radius, expanded here to 40 pixels.
The same process is used to test for uniformity in illuminance, but only the L value in the CIE L*a*b* model is recorded.
To test for illuminance non-uniformity, perform the test for uniformity in illuminance but search grey areas that border potentially brighter areas. You may need to reduce the sample tool radius. The difference between the greatest L value and smallest L value should be no greater than 8 (acceptable), and ideally, no greater than 1.
If you identified signal-to-noise issues when setting a colour profile, you should increase the number of passes for this process as well.
You may have issues with the image format. JPEG is known to create image artifacts as a result of bordering image information. It is not a recommended preservation format. The problem will be most obvious when measuring illuminance along high-contrast borders. If you have this issue, consider changing the file format. TIFF is recommended. If your scanner or scanner software cannot save in a more desirable format, consider maximizing scan resolution to reduce the occurrence of artifacts.
Appendix C: Scanning oversized documents
One method of scanning oversized documents is to scan portions of the original object, then compile the individual images in a larger composite image. The second step can be done manually, using an image editing package to position each scan in the composite, or automatically, using stitching software to automate the process. There are no recommendations either for or against stitching multiple scans of oversized documents. However, pursuing this route presents a number of problems.
- Positioning an oversized document on the platen is difficult and risks damaging the original object. Some scanners have removable lids for this purpose, but an alternate method for blocking ambient light will be required.
- Stitching, either manually or using software, often does not produce seamless results.
- The entire process is labour intensive.
Alternate solutions to stitching include the following:
- Use an oversized flatbed scanner.
- Use a pass-through document scanner designed for oversized documents.
- Use a digital camera, ideally with a copy stand.
- Outsource the work to an organization that has the proper equipment.
Glossary
- charged coupling device (CCD)
- A device containing photo receptors, typically in an array or matrix layout, that convert light energy into an electric charge. That charge is then interpreted as a digital signal. CCD arrays are used in flatbed scanners to scan image information one line at a time.
- CIE L*a*b* colour space
- A colour space defined by the International Commission on Illumination (CIE) expressing colour as three values based on the physiology of human vision: “L” for luminance, “a” for red or green colour and “b” for blue or yellow colour.
- CIEXYZ
- A colour space defined by the International Commission on Illumination (CIE) in 1931. While the model predates a physiological understanding of human vision, it approximates it, with the Y value representing luminance and the X and Z values representing a combination of hue and saturation.
- colour banding
- Visible portions of an image that should contain an even gradient of colour, but instead show a clear demarcation, yielding the appearance of a band. Colour banding commonly results from insufficient bit depth or “lossy” image compression.
- colour gamut
- A range of colours that can be expressed by a colour model mapped onto a colour space. The number of colours in a gamut is always equal to or less than the possible number of colours within a colour space.
- colour model
- A collection of numeric values that, when mapped onto a colour space, provide colour attribution for any value in the model.
- colour space
- A collection of possible colours, typically bounded by parameters that define the model such as luminance, or specific colours within the light spectrum. Colours within the space can be numerically expressed by using a colour model.
- CMYK
- A light subtractive colour model commonly used for printed images. A series of inks reproduce the colours and tones in the model. They are cyan (C), magenta (M), yellow (Y) and black (K).
- reflective object
- This guide uses the definition provided by the Federal Agencies Digital Guidelines Initiative (PDF format): “An object that is intended to be, or is generally, viewed or used in a manner in which some or all of the light that strikes its surface is reflected. Most reflective objects are largely opaque, but may be translucent.” Examples include newsprint, loose documents, bound paper and photographic prints.
- RGB
- A light additive colour model that is commonly used in digital imaging and display systems. Three values represent intensities of colour in three separate channels. They are red, green and blue. The intensities range from no colour in the channel to the highest representable or detectable intensity.
- pixel
- A single point of image information found in a digital image. Pixels may be represented as bitonal (black or white), greyscale or colour.
- pixel raster
- The grid work of pixels, aligned in rows and columns, that make up a digital image.
- posterization
- An effect occurring in digital images where sections of flat colour replace the original image detail. The cause is a reduced colour gamut, typically due to insufficient bit depth.
- signal-to-noise ratio
- The ratio of randomness, or noise, relative to the desired signal. In the case of a flatbed scanner, it shows up as inconsistent results on subsequent scans of the same material.
Bibliography
Bibliothèque et Archives nationales du Québec, Bibliothèque nationale de France and Canadian Museum of History. Recueil de règles de numérisation (in French only). Montreal, QC, and Paris, France: Canadian Museum of History and Bibliothèque nationale de France, 2014.
Bieman, E. Capture Your Collections: A Guide for Managers Who Are Planning and Implementing Digitization Projects, revised. Ottawa, ON: Canadian Heritage Information Network, 2020.
Bieman, E. Supplement: How to Scan Photographic Transparencies and Photographic Negatives. Ottawa, ON: Canadian Heritage Information Network, 2022.
Bieman, E., and W. Vinh-Doyle. National Heritage Digitization Strategy – Digital Preservation File Format Recommendations. Ottawa, ON: Canadian Heritage Information Network, 2019.
Canadian Conservation Institute (CCI). Basic Care of Books. CCI Notes 11/7. Ottawa, ON: Canadian Conservation Institute, 1995.
Canadian Heritage Information Network. Digital Preservation Toolkit. Ottawa, ON: Canadian Heritage Information Network, n.d.
Canadian Heritage Information Network. Capture Your Collections 2012 – Small Museum Version. Ottawa, ON: Canadian Heritage Information Network, 2012.
Canadian Museum of Civilization and Canadian War Museum. Digitization Standards for the Canadian Museum of Civilization Corporation (PDF format). Ottawa, ON: Canadian Museum of Civilization and Canadian War Museum, 2012.
Guild, S. Caring for Paper Objects. Preventive conservation guidelines for collections. Ottawa, ON: Canadian Conservation Institute, 2018.
Mason, J. Handling Heritage Objects. Preventive conservation guidelines for collections. Ottawa, ON: Canadian Conservation Institute, 2018.
Rieger, T. Technical Guidelines for Digitizing Cultural Heritage Materials: Creation of Raster Image Files (PDF format), revised. Washington, D.C.: Federal Agencies Digital Guidelines Initiative, September 2016.
© Government of Canada, Canadian Heritage Information Network, 2023
Published by:
Canadian Heritage Information Network
Department of Canadian Heritage
1030 Innes Road
Ottawa ON K1B 4S7
Canada
Cat. No.: CH57-4/60-2023E-PDF
ISBN 978-0-660-46507-4
Page details
- Date modified: