
Employment Insurance Monitoring and Assessment Report for the fiscal year beginning April 1, 2016 and ending March 31, 2017
Chapter II - 2. Employment Insurance regular benefits
From: Employment and Social Development Canada
On this page
- 2. Employment Insurance regular benefits
- 2.1 Employment Insurance regular claims and amount paid
- 2.2 Employment Insurance regular benefits: coverage, eligibility and access
- 2.3 Level of Employment Insurance regular benefits
- 2.4 Extension of Employment Insurance regular benefits for workers in regions affected by the downturn in commodity prices
- 2.5 Employment Insurance regular benefit entitlement
- 2.6 Exhaustion of Employment Insurance regular benefits
- 2.7 Working While on claim provision
- 2.8 Employment Insurance regular benefits and seasonal claimants
2. Employment Insurance regular benefits
Employment Insurance (EI) regular benefits provide temporary income support to partially replace lost employment income for eligible claimants while they look for work or upgrade their skills. To qualify for regular benefits, individuals must have paid EI premiums during their qualifying period (defined as either the 52 weeks prior to the new claim’s establishment or since the establishment of a previous claim, whichever is shorter). They must have been unemployed and without pay for at least seven consecutive days and must have accumulated between 420 and 700 hours of insurable employment over the qualifying period. The number of hours of insurable employment required depends on the unemployment rate of the EI economic region in which they reside at the time of making their claim (known as the Variable Entrance Requirement). Claimants for EI regular benefits must be available for and actively seeking suitable employment during their claim period.
For the purpose of these sections, EI regular claims refer to claims for which at least one dollar of regular benefits was paid.
2.1 Employment Insurance regular claims and amount paid
The number of new EI regular claims decreased by 7.7% to 1.3 million in FY1617, from 1.4 million in the previous year. This decline is attributable in part to the drop in the number of new claims established in Ontario, British Columbia and Quebec due to the upward trend in employment observed in these regions. However, the largest declines in percentage occurred in Newfoundland and Labrador ( 18.1%) and in Alberta (-15.9%). Despite this decline that continued the downward trend in the number of claims established generally observed since FY0910, the number of new claims established in the reporting period (1,321,100) remained 2.1% higher than the number reported in FY0708, prior to the onset of the late-2000s recession (see Chart 5).

Text description of Chart 5
| Regular claims (millions - left scale) | Amount paid ($ billions - right scale) | |
|---|---|---|
| 2007/2008 | 1.3 | $8.4 |
| 2008/2009 | 1.6 | $10.0 |
| 2009/2010 | 1.6 | $14.7 |
| 2010/2011 | 1.4 | $12.8 |
| 2011/2012 | 1.4 | $11.1 |
| 2012/2013 | 1.4 | $10.5 |
| 2013/2014 | 1.3 | $10.4 |
| 2014/2015 | 1.3 | $10.6 |
| 2015/2016 | 1.4 | $12.1 |
| 2016/2017 | 1.3 | $12.7 |
Note: Includes claims for which at least $1 of EI regular benefits was paid.
Source: Employment and Social Development Canada, Employment Insurance (EI) administrative data. Data are based on a 10% sample of EI administrative data.
Unlike the number of new claims, total EI regular benefits paid increased by 4.5% (from $12.1 billion to $12.7 billion), compared with an increase of 14.3% observed in the previous year (see Chart 5). It was the third straight year of increases after a four-year downward trend following a high of $14.7 billion in regular benefits paid in FY0910.
Given that EI regular benefits are meant to provide temporary income support during periods of unemployment for eligible claimants while they search for work, the number of new claims established tends to be sensitive to economic cycles and labour market conditions. In FY1617, as discussed in Chapter 1, the Canadian GDP increased by 1.7% and the labour force by 0.8% (or +156,900) over the previous year. The national unemployment rate slightly decreased from 7.0% in FY1516 to 6.9% in FY1617, leading to a decline in the number of unemployed people (-1.4%) and a drop in the volume of new EI regular claims (-7.7%) (see Chart 6).

Text description of Chart 6
| Regular claims (left scale) | Unemployment rate (right scale) | |
|---|---|---|
| 2012/2013 | -4.6% | 7.2% |
| 2013/2014 | -2.3% | 7.0% |
| 2014/2015 | 1.3% | 6.9% |
| 2015/2016 | 6.6% | 7.0% |
| 2016/2017 | -7.7% | 6.9% |
Note: Includes claims for which at least $1 of EI regular benefits was paid.
Sources: Employment and Social Development Canada, Employment Insurance (EI) administrative data (for data on regular claims); and Statistics Canada, Labour Force Survey, CANSIM table 282-0001 (for data on unemployment rates). ESDC data are based on a 10% sample of EI administrative data.
FY1617, there were, on average, 566,000 beneficiaries receiving EI regular benefits each month, an increase of 3.8% from the average of 545,000 regular beneficiaries in the previous year.Footnote 22 As the number of beneficiaries is based on previously established claims, these two measures tend to move in similar directions, albeit at their own pace. New claim volumes will increase when there is an economic shock and the beneficiary count can remain elevated after the volume of new claims have subsided, as payments continue to be made on previously established claims until benefits are exhausted or the claimants have returned to work—reflecting prevailing economic conditions or, potentially, policies that extend benefit entitlement.
Employment Insurance regular claims and amount paid by province or territory, gender, and age
In FY1617, the number of EI regular claims decreased in every province and territory except Prince Edward Island, Nova Scotia, Northwest Territories and Nunavut. The largest percentage decrease occurred in Newfoundland ( 18.1%), followed by Alberta (-15.9%), and British Columbia (-14.5%)—see Chart 7. Quebec and Ontario, which together accounted for 58.5% of all new regular claims, registered the decreases ( 16,700 and -24,000 respectively), in the number of claims established.

Text description of Chart 7
| % Change claims established | % Change amount paid | |
|---|---|---|
| British Columbia | -14.5% | -0.2% |
| Alberta | -15.9% | 51.7% |
| Saskatchewan | -13.9% | 24.8% |
| Manitoba | -6.0% | 4.1% |
| Ontario | -6.1% | -4.1% |
| Quebec | -4.0% | -7.8% |
| New Brunswick | -2.7% | -1.3% |
| Nova Scotia | 1.0% | -1.2% |
| Prince Edward Island | 0.7% | -0.9% |
| Newfoundland and Labrador | -18.1% | 9.7% |
| Yukon | -4.9% | 0.6% |
| Northwestern Territories | 12.3% | -4.7% |
| Nunavut | 13.2% | 22.3% |
Note: Includes claims for which at least $1 of EI regular benefits was paid.
Source: Employment and Social Development Canada, Employment Insurance (EI) administrative data. Data are based on a 10% sample of EI administrative data.
Like the number of new claims established, the total amount of EI regular benefits paid in the reporting period also fluctuated by province or territory (see Chart 7), with Alberta (+51.7%), Saskatchewan (+24.8%), and Nunavut (+22.3%) reporting the largest increases in percentage over the previous year, while Quebec ( 7.8%) and the Northwest Territories (-4.7%) reported the largest decreases. Furthermore, despite the decrease of their shares of benefit payments, Ontario and Quebec continued to account for the largest share of benefits paid (47.7%).
As for gender, the number of EI regular claims established decreased nationally for both men (-10.0%) and women (-3.7%), to 806,700 and 514,500 respectively (see Table 7). The largest decreases were observed among men and women from Alberta, British Columbia, Ontario, Quebec, and Newfoundland and Labrador. The decline in the number of new EI regular claims was higher for men than women across most provinces and territories, except Yukon (-4.0% for men vs. -6.8% for women). In Nova Scotia, the growth rate was about the same (+1.0% for men vs. +0.9% for women). Compared with the previous year, the share of claims made by men and women remained more or less unchanged at around 61.0% and 39.0%, respectively.
About 68.0% of the total amount paid in EI regular benefits went to men and around 32.0% to women. The amounts paid to men and women increased at about the same pace (+4.3% and +4.9% respectively) —see Table 7. Women either reported higher rates of increase or lower rates of decline in amounts paid in every province and territory with the exception of Newfoundland and Labrador, Ontario and Yukon. At the national level, FY1617 is the first year during the seven past years where men have not reported higher rates of growth than women in claims established as well as in amount paid over the last four years.
As Table 7 shows, there were decreases in the number of claims established by all age groups, with the largest decreases reported by claimants under 25 years old (-9.8%), followed by those 45 years and older ( 9.5%). Claimants between 25 and 44 years old made up the largest share of new claims (44.5%) in the reporting period, followed by those 55 years and older (23.3%). While the order of the shares of new claims established by these different age groups has been relatively stable over the previous year, the share of new claims established by those 55 years and older has increased slowly over time, rising 3.3 percentage points since FY1112.
Unlike for new EI regular claims, all age groups registered increases for EI regular benefits paid. The largest increase was reported by claimants aged 55 years and older (+9.4%). Further, as in the previous year, claimants between 25 and 44 years old accounted for the largest share of amounts paid (43.8%), followed by those aged 55 years and older (24.0%). The share of amount paid by age category has been relatively stable over the last year, with a slight increase in the share of amount paid (+1.1 percentage points – ppts) to those 55 years and older and slight declines in the share of amount paid to youth under 25 years old (-0.4 ppts), claimants between 25 and 44 years old (-0.3 ppts), and those between the ages of 45 and 54 (-0.4 ppts).
| Claims | Amount paid ($ millions) | |||||
|---|---|---|---|---|---|---|
| 2015/2016 | 2016/2017 | Change (%) | 2015/2016 | 2016/2017 | Change (%) | |
| Gender | ||||||
| Men | 896,610 | 806,660 | -10.0% | $8,253.4 | $8,612.3 | +4.3% |
| Women | 534,480 | 514,470 | -3.7% | $3,868.8 | $4,057.8 | +4.9% |
| Age | ||||||
| 24 years old and under | 140,640 | 126,880 | -9.8% | $1,153.7 | $1,158.1 | +0.4% |
| 25 to 44 years old | 639,540 | 588,420 | -8.0% | $5,345.2 | $5,548.9 | +3.8% |
| 45 to 54 years old | 329,800 | 298,500 | -9.5% | $2,844.6 | $2,921.7 | +2.7% |
| 55 years old and over | 321,110 | 307,330 | -4.3% | $2,778.8 | $3,041.3 | +9.4% |
| Canada | 1,431,090 | 1,321,130 | -7.7% | $12,122.2 | $12,670.1 | +4.5% |
Note: Data may not add up to the total due to rounding. Percentage change is based on unrounded numbers. Includes claims for which at least $1 of EI regular benefits was paid.
Source: Employment and Social Development Canada, Employment Insurance (EI) administrative data. Data are based on a 10% sample of EI administrative data.
These trends are likely attributable in part to Canada’s aging population, as there is a positive correlation between the increase in the number of EI regular claims and amount paid among workers aged 55 years and older and the increase in their share of the Canadian labour force. Older workers accounted for 20.6% of the labour force in FY1617, an increase of 2.9 percentage points from 17.7% in FY1112.Footnote 23
Employment Insurance regular claims and amount paid by industry
The number of new EI regular claims declined in all industries in FY1617 (see Table 8), most notably Mining and oil and gas extraction (-36.1%), Construction (-13.6%), Transportation and warehousing ( 12.5%) and Manufacturing ( 12.3%). The decreases in the number of EI regular claims from claimants from these industries were consistent with the recent downward trend in unemployment in those industries. Furthermore, consistent with the previous year, most of new claims were made by claimants employed, before the establishment of their claim, in Construction (20.7%), Educational services (11.6%), and Manufacturing (9.9%). Combined, these three industries accounted for 42.2% of all EI regular claims, a decrease of 1.3 percentage points compared with the previous year (43.5%).
As for goods-producing industries, the number of new EI regular claims decreased by 14.3% to about 484,700 in the reporting period, a drop driven primarily by the decline in the number of claims established by unemployed claimants from Mining and oil and gas extraction (-36.1%) , Construction (-13.6%), and Manufacturing (-12.3%).
| Number of claims (Percentage share of all claims) |
Amount paid - $ Millions (Percentage share of total amount paid) |
|||||
|---|---|---|---|---|---|---|
| 2015/2016 | 2016/2017 | Change (%) | 2015/2016 | 2016/2017 | Change (%) | |
| Goods-producing Industries | 565,610 (39.5%) | 484,720 (36.7%) |
-14.3% | $5,337.1 (44.0%) | $5,397.7 (42.6%) | +1.1% |
| Agriculture, forestry, fishing and hunting | 57,360 (4.0%) |
51,910 (3.9%) |
-9.5% | $520.4 (4.3%) |
$515.6 (4.1%) |
-0.9% |
| Mining and oil and gas extraction | 38,250 (2.7%) |
24,4330 (1.8%) |
-36.1% | $445.0 (3.7%) |
$448.8 (3.5% |
+0.8% |
| Utilities | 4,230 (0.3%) |
3,980 (0.3%) |
-5.9% | $39.1 (0.3%) |
$42.2 (0.3%) |
+8.1% |
| Construction | 316,290 (22.1%) |
273,380 (20.7%) |
-13.6% | $2,934.7 (24.2%) |
$3,001.5 (23.7%) | +2.3% |
| Manufacturing | 149,480 (10.4%) |
131,020 (9.9%) |
-12.3% | $1,397.9 (11.5%) |
$1,389.6 (11.0%) | -0.6% |
| Services-producing Industries | 821,740 (57.4%) | 762,630 (57.7%) |
-7.2% | $6,487.5 (53.5%) | $6,687.7 (52.8%) | +3.1% |
| Wholesale trade | 48,240 (3.4%) |
43,600 (3.3%) |
-9.6% | $497.1 (4.1%) |
$515.1 (4.1%) |
+3.6% |
| Retail trade | 83,500 (5.8%) |
76,300 (5.8%) |
-8.6% | $685.4 (5.7%) |
$712.3 (5.6%) |
+3.9% |
| Transportation and warehousing | 67,950 (4.7%) |
59,470 (4.5%) |
-12.5% | $520.5 (4.3%) |
$556.8 (4.4%) |
+7.0% |
| Finance and insurance | 15,500 (1.1%) |
14,080 (1.1%) |
-9.2% | $166.5 (1.4%) |
$177.9 (1.4%) |
+6.9% |
| Real estate, rental and leasing | 20,220 (1.4%) |
18,640 (1.4%) |
-7.8% | $191.8 (1.6%) |
$208.1 (1.6%) |
+8.5% |
| Professional, scientific and technical services | 61,630 (4.3%) |
54,190 (4.1%) |
-12.1% | $630.5 (5.2%) |
$666.4 (5.3%) |
+5.7% |
| Business, building and other support services* | 100,250 (7.0%) |
88,740 (6.7%) |
-11.5% | $881.9 (7.3%) |
$876.9 (6.9%) |
-0.6% |
| Educational services | 156,100 (10.9%) |
153,460 (11.6%) |
-1.7% | $711.6 (5.9%) |
$695.1 (5.5%) |
-2.3% |
| Health care and social assistance | 47,610 (3.3%) |
45,740 (3.5%) |
-3.9% | $371.2 (3.1%) |
$389.6 (3.1%) |
+5.0% |
| Information, culture and recreation** | 41,320 (2.9%) |
38,030 (2.9%) |
-8.0% | $336.2 (2.8%) |
$337.1 (2.7%) |
+0.3% |
| Accommodation and food services | 63,840 (4.5%) |
60,630 (4.6%) |
-5.0% | $498.2 (4.1%) |
$496.3 (3.9%) |
-0.4% |
| Other services (excluding Public administration) | 45,900 (3.2%) |
42,020 (3.2%) |
-8.5% | $399.4 (3.3%) |
$424.4 (3.3%) |
+6.3% |
| Public administration | 69,680 (4.9%) |
67,730 (5.1%) |
-2.8% | $597.3 (4.9%) |
$631.5 (5.0%) |
+5.7% |
| Unclassified | 43,740 (3.1%) |
73,780 (5.6%) |
+68.7% | $297.6 (2.5%) |
$584.7 (4.6%) |
+96.5% |
| Canada | 1,431,090 | 1,321,130 | -7.7% | $12,122.2 | $12,670.1 | +4.5% |
Note: Data may not add up to the total due to rounding. Percentage change is based on unrounded numbers. Includes claims for which at least $1 of EI regular benefits was paid.
* NAICS codes 55 (Management of Companies and Enterprises) and 56 (Administration and Support, Waste Management).
**NAICS codes 51 (Information and Cultural Industries) and 71 (Arts, Entertainment and Recreation).
Source: Employment and Social Development Canada, Employment Insurance (EI) administrative data. Data are based on a 10% sample of EI administrative data.
Claims from these three industries accounted for 88.5% of all EI regular claims from goods-producing industries in FY1617, a decrease of 0.6 percentage points from the previous year.
The amount of EI regular benefits paid to claimants who worked in goods-producing industries increased by 1.1% to $5.4 billion, much lower than the increase observed in FY1516 (+21.9%). This slower growth was mainly attributable to a decrease in amounts paid to claimants from Manufacturing (-0.6%) and lower increases observed in amounts paid for claims established by claimants who worked in Mining and oil and gas extraction (+0.8%) and Construction (+2.3%) over the previous year. Claimants from these three industries accounted for 89.7% of goods-producing industries’ total amount paid for EI regular benefits.
As for the services-producing industries, the number of EI regular claims established decreased by 7.2% to about 762,600 claims in FY1617, largely due to the number of claims established by claimants from Transportation and warehousing (-12.5%), Professional, scientific and technical services (-12.1%), and Business, building and other support services (-11.5%). In contrast to the number of claims established, the total amount paid to claimants from services-producing industries increased by +3.1% to $6.7 billion, much lower than the increase observed in FY1516 (14.7%). This slower pace of growth is mainly attributable to the lower rate of the growth in amounts paid to claimants from Transportation and warehousing, Professional, scientific and technical services, and Business, building and other support services.
The decreased use of EI regular benefits by both goods- and services-producing industries occurred even as employment trends diverged in the two sectors: goods-producing industries observed an employment loss of 1.2% in FY1617, while the services industry showed employment gains of 1.6% (see Chart 8).

Text description of Chart 8
| Annual Percentage Change | |||
|---|---|---|---|
| Regular Claims | Amount Paid | Employment | |
| Goods-producing industries | -14.3% | 1.1% | -1.2% |
| Services-producing industries | -7.2% | -7.2% | 1.6% |
Note: Includes claims for which at least $1 of EI regular benefits was paid.
Sources:Employment and Social Development Canada (ESDC), Employment Insurance administrative data (for data on regular claims and amount paid) and Statistics Canada, Labour Force Survey, CANSIM table 282-007 (for data on employment). ESDC data are based on 10% sample of EI administrative data.
A recent departmental studyFootnote 24 on re-employment patterns after a layoff, comparing workers based on their EI claim status, examined whether laid-off workers returned to the same industry or transitioned to a new one when re-employed. It also examined the impact of the re-employment on the workers’ wages. The study found that the majority of re-employed laid-off workers found a job in the same industry regardless of whether or not they claimed EI benefits and that the share of laid-off workers that changed industry upon re-employment increased with the duration of the unemployment spell. The study also looked at the impact of returning to or changing industry on laid-off workers' wages by examining those that received a higher, lower or similar wage after re-employment. When returning to the same industry, the majority of re-employed workers maintained a similar or higher wage regardless of their EI claim status.
A key consideration associated with the EI program is that it can increase the quality of the new job found by EI claimant, notably in terms of wages and employment duration, as more time and resources are provided to an individual to search for suitable employment. Some evidence suggests that, in general, unemployment programs have either a very small positive impact or no impact at all on the job quality for re-employed individuals. Some specific sub-programs associated with the EI program may, however, provide more successful outcomes. A recent analysis by Employment and Social Development CanadaFootnote 25 shows that a number of active labour market policies—components of the EI program associated with Employment Benefit and Support Measures, see Chapter III for more information—generally had positive and highly significant impacts on re-employment and employment earnings of individuals.
Impacts of Employment Insurance on labour mobility
The EI program policies permit labour mobility. First, if an individual is receiving EI benefits and decides to move to look for work, they will continue to receive EI benefits with no change to their benefit rate or number of weeks they are entitled to receive during the benefit period, as EI benefits are based on where the individual resides when the claim is established. Second, if an individual voluntarily leaves their job in order to relocate to follow a spouse, common-law partner or dependent child (for access to medical treatment centres or other care needs), it is considered a valid reason for separation and they remain eligible to receive EI benefits.
A number of studies have focused on the determinants of labour mobility within Canada and how EI may affect a worker’s decision to migrate for employment. The available evidence suggests that EI is generally not a barrier to labour mobility. Studies suggest that the EI program does not significantly affect migration decisions,* while factors such as demographics and regional labour market characteristics (such as age, gender, employment rates, population size, etc.) as well as moving costs, play key roles in these decisions.** Among EI regular claimants, those in regions with a high unemployment rate (12.1% or higher) were more likely to commute to work from one EI economic region to another, but less likely to permanently move to another EI economic region; however, the overall effect of EI benefits on geographical attachment was very minimal.***
* Source: HRSDC, Commuting and Mobility Patterns of Employment Insurance (EI) Recipients and Non-Recipients. (Ottawa: HRSDC, Evaluation Directorate, 2011).
** Source: André Bernard, Ross Finnie and Benoît St-Jean, (Interprovincial Mobility and Earnings. (Ottawa: Statistics Canada, 2008).
*** Source: HRSDC, Regional Out-Migration and Commuting Patterns of Employment Insurance (EI) Claimants. (Ottawa: HRSDC, Evaluation Directorate, 2012).
Employment Insurance regular benefits and firms
According to 2015 tax dataFootnote 26 there were 1.2 million firmsFootnote 27 operating in Canada, an increase of 1.3% compared to 2014. There were about 303,800 firms associated with the establishment of an EI regular benefit claim as a claimant’s former employer in 2015 (or 25.4% of all firms).
The proportion of firms with at least one employee receiving EI regular benefits varied widely according to firm size, with smaller firms being less likely to be the last employer of a claimant.Footnote 28 In 2015, 20.0% of small-sized firms (1 to 19 employees) had at least one former employee who received EI regular benefits. In comparison, 74.8% of small-to-medium (20 to 99 employees) firms, 95.0% of medium-to-large (100 to 499 employees) and 99.6% of large-sized (500 employees or more) firms had a former employee who received EI regular benefits.
| Number of firms | Employment distribution** (% share) | EI claimant distribution*** (% share) | ||
|---|---|---|---|---|
| All firms | Firms with a least one employee receiving EI regular benefits | |||
| Small | 1,083,684 | 216,409 | 21.6% | 26.1% |
| Small-medium | 92,694 | 69,363 | 19.5% | 24.1% |
| Medium-large | 15,646 | 14,860 | 15.8% | 17.8% |
| Large | 3,215 | 3,201 | 43.1% | 32.0% |
| Canada | 1,195,239 | 303,833 | 100.0% | 100.0% |
* The categories of firm size reflect those found in Business Dynamics in Canada, a Statistics Canada publication. Small-sized firms are defined as those that employ 1 to 19 employees. Small-to-medium sized firms employ 20 to 99 employees. Medium-to-large sized firms employ 100 to 499 employees. Large-sized firms employ 500 employees or more.
** The number of workers in a firm is the number of individuals with employment income in that firm, as indicated on a T4 form. The number of workers is adjusted so that each individual in the labour force is only counted once and individuals who work for more than one firm are taken into account. For example, if an employee earned $25,000 in firm 1 and $25,000 in firm 2, then he or she was recorded as 0.5 employees at the first firm and 0.5 employees at the second firm.
*** These are based on the number of people receiving EI regular benefits in 2015.
Sources: Employment and Social Development Canada, Employment Insurance (EI) administrative data. Data are based on a 100% sample of EI administrative data; CRA administrative data. CRA data are based on a 100% sample.
However, compared to the distribution of the workforce, employees from smaller firms tended to be over-represented among EI regular claimants (see Table 9). Workers in large-sized firms were underrepresented among EI regular claimants, accounting for 43.1% of workers and only 32.0% of EI regular claimants. All other categories of firms were over-represented among EI regular claimants—small firms, for example, represented 21.6% of workers and 26.1% of EI regular claimants. This higher use of EI regular benefits could suggest that, in difficult business or economic conditions, smaller firms may need to make broader adjustments to their workforces, resulting in a larger share of their employees claiming EI regular benefits as a result of layoffs. Moreover, this trend can also be influenced by industry-related characteristics such as the greater prevalence of seasonal jobs, generally more likely to rely on EI, in small firms relative to the national average in some industries.Footnote 29
Employment Insurance (EI) regular claims and amount paid by EI claimant category
As shown in Table 10, the number of claims established declined in all claimant categories in FY1617. Long-tenured workers reported the largest decrease, down 13.4% over the previous year, followed by frequent (-7.2%) and occasional claimants (-4.9%). Occasional workers continued to account for the largest share (53.5%) of all new EI regular claims established, an increase of 1.6 percentage points compared to the previous year (51.9%). In contrast, the share of long-tenured workers declined moderately by 1.7 percentage points to 24.9%, while that of frequent claimants was barely changed at 21.6%.
The decrease in claims established by long-tenured workers in FY1617 continues the downward trend observed since the recession in FY0910. The number of EI regular claims established by long-tenured workers in FY1617 (approximately 329,300) remained below the peak reported in FY0809 (519,800) (see Chart 9).
As in the previous year, occasional claimants accounted for the largest share of total benefit payments (49.1%) in FY1617, a decrease of 1.4 percentage points over the previous year. They were followed by long-tenured workers and frequent workers who accounted for 29.1% and 21.9%, respectively, of total benefit payments. Long-tenured workers (+17.2%) and occasional workers (+1.7%) witnessed increases in their EI regular benefit payments, while frequent claimants witnessed a decrease (-3.3%) (see Table 10 and Chart 10).
| Number of claims (Percentage share of all claims) |
Amount paid - $ Millions (Percentage share of total amount paid) |
|||||
|---|---|---|---|---|---|---|
| 2015/2016 | 2016/2017 | Change (%) | 2015/2016 | 2016/2017 | Change (%) | |
| Long-tenured workers | 380,460 (26.6%) |
329,290 (24.9%) |
-13.4% | $3,141.1 (25.9%) |
$3,681.5 (29.1%) |
+17.2% |
| Occasional claimants | 742,840 (51.9%) |
706,150 (53.5%) |
-4.9% | $6,118.7 (50.5%) |
$6,220.2 (49.1%) |
+1.7% |
| Frequent claimants | 307,790 (21.5%) |
285,690 (21.6%) |
-7.2% | $2,862.3 (23.6%) |
$2,768.4 (21.9%) |
-3.3% |
| Canada | 1,431,090 (100.0%) |
1,321,130 (100.0%) |
-7.7% | $12,122.2 (100.0%) | $12,670.1 (100.0%) |
+4.5% |
Note: Totals may not add up due to rounding. Percentage change is based on unrounded numbers. Includes claims for which at least $1 of EI regular benefits was paid.
*See Annex 2.1 for definitions of claimant categories referenced in this table.
Source: Employment and Social Development Canada, Employment Insurance (EI) administrative data. Data are, based on a 10% sample of EI administrative data.
Furthermore, as Table 10 illustrates, the distribution of the total amount paid to these different claimant categories was not in alignment with the distribution of claims they established. In fact, long-tenured workers received a larger share of the total amount paid (29.1%) relative to their share of claims (24.9%) in FY1617. Occasional claimants, who made up 53.5% of total claims, accounted for 49.1% of the total amount paid.

Text description of Chart 9
| 2008/2009 | 2009/2010 | 2010/2011 | 2011/2012 | 2012/2013 | 2013/2014 | 2014/2015 | 2015/2016 | 2016/2017 | |
|---|---|---|---|---|---|---|---|---|---|
| Long-tenured workers | 31.6% | 30.0% | 24.0% | 25.6% | 23.3% | 21.5% | 19.5% | 26.6% | 24.9% |
| Occasional claimants | 50.6% | 51.4% | 53.9% | 51.8% | 53.1% | 55.1% | 57.8% | 51.9% | 53.5% |
| Frequent claimants | 17.8% | 18.6% | 22.1% | 22.6% | 23.6% | 23.4% | 22.7% | 21.5% | 21.6% |
Note: Includes claims for which at least $1 of regular benefits was paid.
* See Annex 2.1 for definitions of claimant categories referenced in this chart.
Source: Employment and Social Development Canada, Employment Insurance (EI) administrative data. Data are based on a 10% sample of EI administrative data.

Text description of Chart 10
| Amount paid ($ billions) | |||||||||
|---|---|---|---|---|---|---|---|---|---|
| 2008/2009 | 2009/2010 | 2010/2011 | 2011/2012 | 2012/2013 | 2013/2014 | 2014/2015 | 2015/2016 | 2016/2017 | |
| Long-tenured workers | $3.0 | $5.1 | $4.4 | $3.2 | $2.7 | $2.4 | $2.1 | $3.1 | $3.7 |
| Occasional claimants | $4.8 | $6.9 | $5.7 | $5.2 | $5.0 | $5.3 | $5.7 | $6.1 | $6.2 |
| Frequent claimants | $2.2 | $2.7 | $2.7 | $2.8 | $2.8 | $2.7 | $2.7 | $2.9 | $2.8 |
Note: Includes claims for which at least $1 of EI regular benefits was paid.
* See Annex 2.1 for definitions of claimant categories referenced in this chart.
Source: Employment and Social Developement Canada, Employment Insurance (EI) administrative data. Data are based on a 10% sample of EI administrative data.
Employment Insurance regular claims by hours of insurable employment and by unemployment rate in the Employment Insurance economic region of establishment
The unemployment rate in an EI economic region determines the number of hours of insurable employment needed to qualify for EI, known as the Variable Entrance Requirement (VER). The higher the unemployment rate in a given region, the lower the number of hours needed to qualify for EI regular benefits (see Annex 2.2). More information on eligibility and access to EI regular benefits is available in Section 2.2 (Employment Insurance regular benefits: coverage, eligibility and access).
Variable entrance requirement
In order to establish a benefit period a worker must accumulate between 420 and 700 hours of insurable employment in the qualifying period depending on the applicable regional rate of unemployment. The higher the regional rate of unemployment, the lower the number of hours of insurable employment required.
| Unemployment rate | Entrance requirement |
|---|---|
| 6.0% and under | 700 hours |
| 6.1% to 7.0% | 665 hours |
| 7.1% to 8.0% | 630 hours |
| 8.1% to 9.0% | 595 hours |
| 9.1% to 10.0% | 560 hours |
| 10.1% to 11.0% | 525 hours |
| 11.1% to 12.0% | 490 hours |
| 12.1% to 13.0% | 455 hours |
| More than 13.0% | 420 hours |
Consistent with previous years, claimants who accumulated more than 1,820 insurable hours accounted for the highest share of new EI regular claims (25.7%), a decrease of 2.0 percentage points from the previous year. This is the first decline in the share of claimants in this category after five years of consecutive increases. Despite this decline, the shares of EI regular claims based on the number of insurable hours accumulated by claimants was relatively stable across categories. Claims with fewer than 700 insurable hours registered the largest increase (+13.7%), while those with 1,820 hours or more witnessed the greatest decrease (-14.3%) (see Table 11).
| 2012/2013 | 2013/2014 | 2014/2015 | 2015/2016 | 2016/2017 | |
|---|---|---|---|---|---|
| Less than 700 hours | 74,780 (5.5%) |
68,880 (5.2%) |
64,390 (4.8%) |
67,170 (4.7%) |
76,340 (5.8%) |
| 700 to 979 hours | 210,690 (15.5%) |
201,280 (15.2%) |
203,690 (15.2%) |
207,610 (14.5%) |
216,650 (16.4%) |
| 980 to 1,259 hours | 261,440 (19.3%) |
252,600 (19.1%) |
256,210 (19.1%) |
264,500 (18.5%) |
242,610 (18.4%) |
| 1,260 to 1,539 hours | 249,250 (18.4%) |
244,230 (18.4%) |
245,530 (18.3%) |
260,870 (18.2%) |
239,030 (18.1%) |
| 1,540 to 1,819 hours | 223,640 (16.5%) |
219,660 (16.6%) |
218,840 (16.3%) |
235,120 (16.4%) |
207,440 (15.7%) |
| 1,820 hours and more | 337,010 (24.8%) |
339,150 (25.6%) |
353,950 (26.4%) |
395,820 (27.7%) |
339,060 (25.7%) |
| Canada | 1,356,810 | 1,325,810 | 1,342,610 | 1,431,090 | 1,321,130 |
Note: Data may not add up to the total due to rounding. Includes claims for which at least $1 of EI regular benefits was paid.
Source: Employment and Social Development Canada, Employment Insurance (EI) administrative data. Data are based on a 10% sample of EI administrative data.
Chart 11 depicts the average number of hours of insurable employment per claim receiving EI regular benefits. In FY1617, on average, claimants who qualified for EI regular benefits accumulated 1,363 hours of insurable employment during their qualifying period, a decrease of 2.2% over the previous year. It was the first decrease after five years of consecutive increases since FY1011.

Text description of Chart 11
| 2008/2009 | 2009/2010 | 2010/2011 | 2011/2012 | 2012/2013 | 2013/2014 | 2014/2015 | 2015/2016 | 2016/2017 | |
|---|---|---|---|---|---|---|---|---|---|
| Men | 1,446 | 1,385 | 1,358 | 1,377 | 1,393 | 1,400 | 1,406 | 1,418 | 1,385 |
| Women | 1,357 | 1,325 | 1,309 | 1,315 | 1,328 | 1,338 | 1,342 | 1,353 | 1,328 |
| Canada | 1,413 | 1,362 | 1,338 | 1,352 | 1,367 | 1,376 | 1,381 | 1,393 | 1,363 |
Furthermore, the average number of hours of insurable employment per claim that qualified for EI regular benefits varied by province and territory, gender and age. Indeed, the number of hours per claim in the Atlantic provinces and the Territories tends to be lower than in other jurisdictions. For instance, claims from Newfoundland and Labrador showed the lowest average number of hours of insurable employment per claim (1,135 hours), followed by Nunavut (1,186 hours). Claims established in Alberta had the highest average number of hours with 1,501.
By gender, results showed that claims made by men (1,385 hours) had, on average, 57 more hours of insurable employment than claims made up by women (1,328 hours) compared to 62 hours in the previous year, a decrease of 8.1%. This decrease in FY1617 marks the first decline in gender gap for the last five years (see Chart 11). Further, results by age show that claimants aged 55 years and over accumulated the lowest number of hours of insurable employment on average in FY1617 (1,298 hours), while those between 25 and 44 years of age had the highest average (1,398).
Table 12 shows that there were decreases in the number of new claims by regional unemployment rates, except claims established in EI economic regions with unemployment rates between 7.1% to 8.0%, 11.1% to 12.0%, and 14.1% to 15.0%. The largest decrease (-32.9%) occurred in EI economic regions with unemployment rates of 13.1% to 14.0%, while those with unemployment rates of 14.1% to 15.0% reported the greatest increase (+61.2%). In addition, claimants from EI regions with an unemployment rate between 6.1% and 7.0% accounted for the largest share of EI new claims with 27.5%, an increase of 2.1 percentage points over the previous year. As a point of reference, the table also presents the labour force by regional unemployment rate for FY1617.
| Unemployment rate | Employment Insurance regular claims (share of claims in %) |
Labour force (share of labour force in %) | ||||
|---|---|---|---|---|---|---|
| 2012/2013 | 2013/2014 | 2014/2015 | 2015/2016 | 2016/2017 | 2016/2017 | |
| 0.1% to 6.0% | 199,610 (14.7%) |
187,910 (14.2) |
273,380 (20.4%) |
218,020 (15.2%) |
171,350 (13.0%) |
4,117,840 (20.9%) |
| 6.1% to 7.0% | 159,140 (11.7%) |
196,410 (14.8%) |
158,060 (11.8%) |
363,660 (25.4%) |
363,170 (27.5%) |
6,516,870 (33.1%) |
| 7.1% to 8.0% | 177,020 (13.1%) |
259,710 (19.6%) |
329,870 (24.6%) |
279,030 (19.5%) |
299,000 (22.6%) |
4,482,230 (22.7%) |
| 8.1% to 9.0% | 441,350 (32.5%) |
327,910 (24.7%) |
236,460 (17.6%) |
216,290 (15.1%) |
169,290 (12.8%) |
2,161,060 (11.0%) |
| 9.1% to 10.0% | 100,260 (7.4%) |
45,870 (3.5%) |
78,450 (5.8%) |
75,660 (5.3%) |
65,480 (5.0%) |
812,730 (4.1%) |
| 10.1% to 11.0% | 49,340 (3.6%) |
84,810 (6.4%) |
55,950 (4.2%) |
50,430 (3.5%) |
35,420 (2.7%) |
400,410 (2.0%) |
| 11.1% to 12.0% | 43,320 (3.2%) |
52,390 (4.0%) |
44,380 (3.3%) |
16,740 (1.2%) |
21,420 (1.6%) |
194,540 (1.0%) |
| 12.1% to 13.0% | 19,890 (1.5%) |
10,030 (0.8%) |
7,660 (0.6%) |
43,880 (3.1%) |
35,300 (2.7%) |
388,650 (2.0%) |
| 13.1% to 14.0% | 27,860 (2.1%) |
6,620 (0.5%) |
470 (0.0%) |
16,910 (1.2%) |
11,350 (0.9%) |
54,670 (0.3%) |
| 14.1% to 15.0% | 17,740 (1.3%) |
20,030 (1.5%) |
25,870 (1.9%) |
23,650 (1.7%) |
38,190 (2.9%) |
124,750 (0.6%) |
| 15.1% to 16.0% | 21,730 (1.6%) |
57,470 (4.3%) |
25,100 (1.9%) |
31,980 (2.2%) |
25,370 (1.9%) |
60,450 (0.3%) |
| 16.1% or higher | 99,550 (7.3%) |
76,650 (5.8%) |
106,960 (8.0%) |
94,840 (6.6%) |
85,790 (6.5%) |
391,720 (2.0%) |
| Canada | 1,356,810 | 1,325,810 | 1,342,610 | 1,431,090 | 1,321,130 | 19,705,900 |
Note: Data may not add up to the total due to rounding. Includes claims for which at least $1 of EI regular benefits was paid.
*Unemployment rates used for the Employment Insurance program are a moving average of seasonally adjusted rates of unemployment produced by Statistics Canada, as per section 17 of the Employment Insurance Regulations.
Sources: Employment and Social Development Canada, Employment Insurance (EI) administrative data and Statistics Canada, special tabulations from the Labour Force Survey. EI data are based on a 10% sample of EI administrative data.
2.2 Employment Insurance regular benefits: coverage, eligibility and access
In order to qualify for EI regular benefits, applicants have to meet three core eligibility requirements: the claimant must have had insurable employment and paid EI premiums within the previous 52 weeks; the reason for job separation must be valid according to the Employment Insurance Act, such as a layoff or quit for just cause; and the claimant must have worked a minimum number of insurable hours – based on either the regional unemployment rate (varying from 420 to 700 hours) or the claimant’s status as a new entrant or re-entrant (910 hours)Footnote 30 – within their qualifying period (defined as either the previous 52 weeks or since the establishment of their last claim, whichever is shorter).
Elimination of the New Entrant and Re-Entrants (NEREs) requirement
Michael lives in Victoria, British Columbia and has been working part-time at an accounting firm for the past six months since graduating from college, for a total of 760 hours. He was recently laid off.
Under the previous EI eligibility rules, Michael would have been considered as a new entrant to the labour market, and would have required 910 hours of insurable employment over the past 52 weeks to qualify for EI benefits. Since Michael only worked for 760 hours during this period, he would not have qualified for EI benefits.
Under the new rules, Michael now has the same eligibility requirements as other EI claimants residing in his region. In July 2016, the threshold for applicants living in Victoria was 665 hours. Because of the elimination of the NERE provision, Michael now meets the eligibility requirement for EI benefits and will receive up to 16 weeks EI benefits while he looks for new work.
Statistics Canada publishes Employment Insurance Coverage Survey (EICS) statistics on an annual basis to provide insight on the coverage of the EI program. It provides statistics about eligible recipients as well as those who did not qualify for the EI regular benefits, and maternity and parental benefits. This section provides a review of the results from the EICS to assess eligibility and access for EI regular benefits in 2016.Footnote 31
Chart 12 illustrates the characteristics of the unemployed population in Canada for 2016 with respect to their eligibility criteria for EI regular benefits. According to the EICS, there was an average of 1,302,000 unemployed individuals per month in Canada in 2016. Among these unemployed, 850,300 had paid EI premiums in the 12 months prior to becoming unemployed. These workers represent 65.3% of all unemployed people, a rate that has remained unchanged from the previous year. A total of 155,500 individuals (11.9% of total unemployed) paid EI premiums in 2016 but could not collect EI benefits because of invalid job separation (that is they quit without a justifiable cause, or quit to go to school). The number of workers who did not have sufficient insurable hours but met other eligibility requirements was 101,400, representing 7.8% of the unemployed—down 1.3 percentage points from 2015 (9.1%). The number of unemployed who were eligible to receive EI benefits increased from 569,400 in 2015 (43.8% of total unemployed) to 593,500 in 2016 (45.6% of total unemployed).

Text description of Chart 12
| (U) Total Unemployed: 1,302,000 (100%) | |
|---|---|
| (A) Unemployed without hours of insurable employment: 451,700 (34.7%) | A1—Did not work in the previous 12 months or never worked: 399,800 (30.7%) |
| A2—Self-employed and unpaid family workers: 51,900 (4.0%) | |
| (B) EI Premium-paying unemployed workers with invalid reasons for job separation: 155,500 (11.9%) | B1—Quit without a just cause - other reasons: 101,300 (7.8%) |
| B2—Quit to go to school: 54,200 (4.2%) | |
| (C) Potentially eligible unemployed workers: 101,400 (7.8%) | C1—Did not have sufficient insurable hours: 101,400 (7.8%) |
| (D) Eligible Unemployed: 593,500 (45.6%) | D1—Receiving EI regular benefits: 398,100 (30.6%) |
| D2—Benefits temporarily interrupted or waiting to receive benefits: 102,800 (7.9%) | |
| D3—Did not claim or receive benefits for unknown reasons: 42,600 (3.3%) | |
| D4—Exhausted EI benefits in the past 12 months: 41,600 (3.2%) | |
| D5—Receiving non-regular EI benefits: 8,400 (0.6%) |
Note: totals may not add up to rounding.
Source: Statistics Canada, Employment Insurance Coverage Survey, 2016.
Table 13 outlines the distribution of the unemployed population by EI eligibility characteristics from 2012 to 2016. The number of unemployed with valid job separations increased for the second consecutive year in 2016 compared to 2015 (+7,100), while the number of unemployed with invalid job separations decreased for the third consecutive year in 2016 compared to the previous year (-5,100). The share of unemployed individuals who had sufficient hours to qualify for EI increased by 1.8 percentage points from the previous year to reach 45.6% – the highest share since 2009. The number of unemployed persons with insufficient hours to qualify for EI benefits but who met other eligibility requirements decreased by 16,900 from 2015 to reach 101,400 in 2016, representing 7.8% of the total unemployed. Lastly, the share of EI recipients increased by 1.5 percentage points in 2016 to reach 31.2% of the total unemployed population, compared to 29.7% in 2015. This rate was the highest since 2010. Consequently, the share of EI non-recipients decreased from 70.3% in 2015 to 68.8% in 2016—the lowest within the last five years.
| 2012 | 2013 | 2014 | 2015 | 2016 | |
|---|---|---|---|---|---|
| Non-contributors | 501,400 (38.3%) |
492,600 (37.5%) |
491,500 (39.0%) |
450,900 (34.7%) |
451,700 (34.7%) |
| EI contributors | 808,400 (61.7%) |
819,700 (62.5%) |
768,000) (61.0%) |
848,300 (65.3%) |
850,300 (65.3%) |
| Invalid job separations | 179,500 (13.7%) |
195,600 (14.9%) |
187,400 (14.9%) |
160,600 (12.4%) |
155,500 (11.9%) |
| Valid job separations | 628,800 (48.0%) |
624,100 (47.6%) |
580,500 (46.1%) |
687,700 (52.9%) |
694,800 (53.4%) |
| Insufficient hours for EI | 113,700 (8.7%) |
88,500 (6.7%) |
97,900 (7.8%) |
118,300 (9.1%) |
101,400 (7.8%) |
| Sufficient hours for EI | 515,100 (39.3%) |
535,600 (40.8%) |
482,600 (38.3%) |
569,400 (43.8%) |
593,500 (45.6%) |
| EI benefit recipients | |||||
| EI recipients | 357,800 (27.3%) |
369,000 (28.1%) |
341,500 (27.1%) |
385,900 (29.7%) |
406,500 (31.2%) |
| EI non-recipients* | 951,900 (72.7%) |
943,400 (71.9%) |
918,000 (72.9%) |
913,200 (70.3%) |
895,600 (68.8%) |
| Total unemployed (Canada) | 1,309,700 (100.0%) |
1,312,400 (100.0%) |
1,259,500 (100.0%) |
1,299,100 (100.0%) |
1,302,000 (100.0%) |
Note: Totals may not add up due to rounding.
*Defined as the total share of unemployed persons, regardless of eligibility, who did not receive EI benefits (including both regular and special benefits) in the year reviewed.
Source: Statistics Canada, Employment Insurance Coverage Survey, 2012 to 2016.
Coverage of Employment Insurance regular benefits
As mentioned previously, recipients of EI regular benefits have to make EI premium contributions in the 52 weeks prior to submitting a claim. While the actual receipt of EI benefits is subject to further eligibility requirements, the number of unemployed persons who contributed to the EI program by paying premiums in the previous 52 weeks is an important factor in determining the program’s overall coverage of the unemployed population.
Chart 13 illustrates the share of EI contributors of the total unemployed in Canada from 2008 to 2016. The share of unemployed contributors remained the same in 2016 (65.3%) as the previous year, reversing the downward trend that has been observed since 2009. Higher EI coverage rates of the unemployed tend to occur during economic downturns, as slowing economic activity leads to layoffs that increase the share of unemployed contributors among all unemployed. For example, at the beginning of the recession, in FY0809, the share of unemployed contributors reached a peak (70.1% in 2008 and 70.3% in 2009). Likewise, the downturn in commodity prices slowed down economic growth in 2015 and in 2016, which explains the higher share of unemployed contributors in those years.

Text description of Chart 13
| 2008 | 2009 | 2010 | 2011 | 2012 | 2013 | 2014 | 2015 | 2016 | |
|---|---|---|---|---|---|---|---|---|---|
| Employment Insurance contributors (% share) | 70.1% | 70.3% | 64.7% | 64.5% | 61.7% | 62.5% | 61.0% | 65.3% | 65.3% |
Source: Statistics Canada, Employment Insurance Coverage Survey, 2008 to 2016.
Chart 14 provides an illustration of the trend in the share of EI non-contributors in Canada from 2008 to 2016. It is noticeable that the share of total non-contributors to the EI program and those who have no recent insurable employment remained unchanged in 2016 from the previous year. The share of unemployed who had been without work in the past 12 months increased from 21.4% in 2015 to 22.5% in 2016 (+1.1 percentage points). Persons who stated that they had never worked declined for the second consecutive year to represent 8.2% of the total unemployed population. As shown in Chart 14, those who had not worked in the previous 12 months and those who had never worked account for a greater share of the total unemployed over the years.

Text description of Chart 14
| 2008 | 2009 | 2010 | 2011 | 2012 | 2013 | 2014 | 2015 | 2016 | |
|---|---|---|---|---|---|---|---|---|---|
| Total EI non-contributors | 29.9% | 29.7% | 35.3% | 35.5% | 38.3% | 37.5% | 39.0% | 34.7% | 34.7% |
| Have no recent insurable employment (e.g. self-employed and unpaid family workers) | 4.4% | 4.9% | 3.0% | 3.4% | 4.4% | 4.5% | 4.4% | 4.0% | 4.0% |
| Have not worked in the previous 12 months (excluding those who have never worked) | 18.3% | 18.3% | 24.1% | 25.0% | 24.6% | 24.3% | 23.3% | 21.4% | 22.5% |
| Have never worked | 7.2% | 6.5% | 8.3% | 7.1% | 9.3% | 8.8% | 11.4% | 9.3% | 8.2% |
Source: Statistics Canada, Employment Insurance Coverage Survey, 2008 to 2016.
Table 14 shows the EI coverage rates by region, gender, age, and work pattern. In 2016, Ontario reported the lowest share of unemployed persons who paid EI contributions (57.7%), while the Atlantic provinces reported the highest (80.7%). On the basis of gender, a larger share of unemployed men (70.9%) contributed EI premiums than unemployed women (56.8%). By age categories, older unemployed workers aged 45 years and over had the highest share of EI contributors (71.2%), compared to younger workers 24 years of age and under (56.3%) and those who were aged between 25 to 44 years (65.5%). The EI coverage rate among unemployed non-permanent workers (78.8%) was higher than that among the permanent workers (72.0%).
| Unemployed contributors as a share of total unemployed (UC/U) | |
|---|---|
| Region | |
| Atlantic* | 80.7% |
| Quebec | 65.6% |
| Ontario | 57.7% |
| Prairies** | 68.7% |
| British Columbia | 69.9% |
| Gender | |
| Men | 70.9% |
| Women | 56.8% |
| Age category | |
| 24 years old and under | 56.3% |
| 25 to 44 years old | 65.5% |
| 45 years old and over | 71.2% |
| Work pattern | |
| Permanent | 72.0% |
| Full-time | 74.5% |
| Part-time | 59.6% |
| Non-permanent | 78.8% |
| Seasonal | 85.5% |
| Other non-standard*** | 74.5% |
| Canada | 65.3% |
* The Atlantic region includes the provinces of Newfoundland and Labrador (82.9%), Prince Edward Island (90.5%), Nova Scotia (76.2%) and New Brunswick (80.9%).
** The Prairie region includes the provinces of Manitoba (59.0%), Saskatchewan (71.3%) and Alberta (70.0%).
*** Other non-standard refers to non-permanent paid jobs that were either temporary, term, contractual, casual or other non-permanent (but not seasonal). These unemployed were not self-employed.
Source: Statistics Canada, Employment Insurance Coverage Survey, 2016.
Eligibility for Employment Insurance regular benefits
As noted above, in order to be eligible to receive EI regular benefits, Canada’s unemployed have to meet three core eligibility requirements (that is, paid EI premiums within the previous 52 weeks, a valid job separation, and worked a minimum number of insurable hours within their qualifying period---defined as either the previous 52 weeks or since establishing their last claim, whichever is shorter—based on the regional unemployment rate).
The 2016 EICS estimates that the number of unemployed persons potentially eligible to receive EI benefits (that is, who had paid EI premiums within the preceding 12 months and had a valid job separation) reached 694,800 (53.4% of total unemployed) in 2016, compared to 687,700 persons (52.9% of total unemployed) in 2015. This represents the majority of the EI contributor population and excludes those with reasons for job separations that did not meet the EI program’s eligibility criteria. The share of unemployed individuals who were potentially eligible for EI benefits continued to rise for the second consecutive year in 2016 due to the continued increase (+7,100) in the number of unemployed who reported having worked in insurable employment and had a valid job separation and relatively smaller increase (+2,900) in total unemployed population.
Chart 15 illustrates the EI eligibility rate—the share of potentially eligible unemployed population with enough insurable hours to qualify for EI benefits--over the last decade. After falling for two previous consecutive years, the EI eligibility rate increased from 82.8% in 2015 to 85.4% in 2016 (+2.6 percentage points). This increase could be partly attributable to the elimination of the NERE requirement that came into effect on July 3, 2016. A total of 593,500 individuals were considered eligible (that is, had enough insurable hours of employment) out of 694,800 EI contributors with a valid job separation. The EI eligibility rate tends to fluctuate modestly with changes in the labour market responding to wider business cycle fluctuations.

Text description of Chart 15
| 2007 | 2008 | 2009 | 2010 | 2011 | 2012 | 2013 | 2014 | 2015 | 2016 | |
|---|---|---|---|---|---|---|---|---|---|---|
| Canada | 82.3% | 82.1% | 86.2% | 83.9% | 78.4% | 81.9% | 85.8% | 83.1% | 82.8% | 85.4% |
Source: Statistics Canada, Employment Insurance Coverage Survey, 2007 to 2016.
One important consideration regarding the eligibility for EI regular benefits is that claimants accumulate varying hours of insurable employment. As indicated by EI administrative data, the eligible claimants who successfully establish a claim generally accumulate hours of insurable employment well beyond the minimum requirement under the Variable Entrance Requirement (VER) provision. In FY1617, the share of regular claimants who had qualified with insurable hours near the minimum entrance requirement, defined as being within 70 hours of the VER, increased to 4.0% from 3.1% in the previous fiscal year (see Chart 16).

Text description of Chart 16
| 2012/2013 | 2013/2014 | 2014/2015 | 2015/2016 | 2016/2017 | |
|---|---|---|---|---|---|
| Level of EI regular claims (left scale) | 42,440 | 40,200 | 40,820 | 44,270 | 52,840 |
| Claims as a share of all EI regular claims (right scale) | 3.1% | 3.0% | 3.0% | 3.1% | 4.0% |
Note: Includes claims for which at least $1 of regular benefits was paid.
Source: Employment and Social Development Canada, Employment Insurance (EI) administrative data. Data are based on a 10% sample of EI administrative data.
The number of eligible regular claimants who qualify near the minimum entrance requirement ranged from a low of 40,200 claimants in FY1314 to a high of 52,800 in the reporting fiscal year. In general, claimants qualifying within 70 hours of their VER are disproportionately found in EI economic regions with higher unemployment rates (12.1% or greater), which could be partly attributable to the importance of seasonal employment in those EI economic regions and the discrete period available to accumulate sufficient insurable hours for workers in those industries.
A recent departmental study—based on Record of Employment (ROE)Footnote 32 data--looked into the share of laid-off unemployed persons with enough insurable hours to meet the VER from 2001 to 2016.Footnote 33 The study found that those who reported recent laid-off job separations (the reason for separation was shortage of work) with enough combined hours to meet the VER in their 52-week qualification period declined over time, from 75.4% in 2001 to 70.1% in 2016. This may not fully reflect potential eligibility where previous employment did not result in a ROE being generated. Another departmental study examining the extent to which employers issue a ROE when there is an interruption of earnings found that 30.2% of earnings interruptions in 2014 were not associated with a ROE.Footnote 34
Eligibility for Employment Insurance regular benefits by province
Because the eligibility rates are sensitive to economic conditions and the prevalence of specific employment patterns during the qualifying period (such as, the incidence of full-time versus part-time hours, permanent versus temporary employment etc.), demographic and regional labour force characteristics show significant variation in eligibility outcomes. Table 15 outlines the EI eligibility rates by province over the last five years. In 2016, the lowest eligibility rate was observed in Manitoba (75.3%) and the highest was in Prince Edward Island (98.5%). Compared to the 2015 EICS statistics, the EI eligibility increased in six out of ten provinces while decreased in the rest. The largest increases were observed in British Columbia (+12.1 percentage points) and Nova Scotia (+11.1 percentage points), while the largest decrease was observed in Saskatchewan (-11.0 percentage points) followed by Manitoba (-7.6 percentage points).
| 2012 | 2013 | 2014 | 2015 | 2016 | |
|---|---|---|---|---|---|
| Newfoundland and Labrador | 93.5% | 93.9% | 94.1% | 93.7% | 95.9% |
| Prince Edward Island | 92.8% | 94.4% | 93.4% | 92.7% | 98.5% |
| Nova Scotia | 88.5% | 94.8% | 81.2% | 82.3% | 93.3% |
| New Brunswick | 92.4% | 96.4% | 90.5% | 96.2% | 94.6% |
| Quebec | 81.2% | 86.1% | 84.3% | 81.5% | 86.7% |
| Ontario | 79.7% | 83.1% | 81.0% | 84.8% | 81.3% |
| Manitoba | 82.0% | 85.6% | 91.4% | 82.9% | 75.3% |
| Saskatchewan | 81.2% | 82.3% | 85.4% | 89.9% | 78.9% |
| Alberta | 69.4% | 87.9% | 80.4% | 78.6% | 84.9% |
| British Columbia | 86.4% | 81.5% | 77.3% | 75.2% | 87.3% |
| Canada | 81.9% | 85.8% | 83.1% | 82.8% | 85.4% |
Source: Statistics Canada, Employment Insurance Coverage Survey, 2012 to 2016.
Over time, it can be seen that the Atlantic provinces have the highest EI eligibility rates, while Ontario and the Western provinces have comparatively lower eligibility rates. Between 2012 and 2016, the greatest variability in eligibility rates is found in Alberta (18.5 percentage points) and Manitoba (16.1 percentage points) and the least variability is found in Newfoundland (2.3 percentage points).
Eligibility for Employment Insurance regular benefits by gender and age
Table 16 outlines the EI eligibility rates by gender and age in 2015 and 2016. Historically, a higher proportion of men hold full-time and/or permanent jobs in Canada and a higher proportion of women work in part-time and/or temporary jobs. This difference in employment characteristics among men and women is reflected in the eligibility rates for the two genders. In 2016, the EI eligibility rate of men increased by 5.2 percentage points from the previous year to 87.2%, whereas the eligibility rate of women decreased by 2.7 percentage points from the previous year to 81.6%.
| Eligibility rate in 2015 | Eligibility rate in 2016 | Change (in percentage points) | |
|---|---|---|---|
| Gender | |||
| Men | 82.0% | 87.2% | +5.2 |
| Women | 84.3% | 81.6% | -2.7 |
| Age category | |||
| 24 years old and under | 54.0% | 50.8% | -3.2 |
| 25 to 44 years old | 82.1% | 88.4% | +6.3 |
| 45 years old and over | 90.7% | 94.0% | +3.4 |
| Canada | 82.8% | 85.4% | +2.6 |
Source: Statistics Canada, Employment Insurance Coverage Survey, 2015 and 2016
By age groups, unemployed workers aged 45 and older had the highest eligibility rate at 94.0% in 2016, increasing 3.4 percentage points from the previous year (90.7%). However, the largest increase in eligibility was among those who were 25 to 44 years old—the eligibility rate for them increased by 6.3 percentage points, from 82.1% in 2015 to 88.4% in 2016. Younger workers who are aged between 15 and 24 tend to have lower labour force attachment, and are more likely to quit their jobs to go back to school. This is reflected in their lower eligibility rate; in 2016, the youth eligibility rate declined by 3.2 percentage points to reach 50.8% from the previous year (54.0%).
Eligibility for Employment Insurance regular benefits by type of employment
Under the EI program’s eligibility requirements, previous employment characteristics significantly influence the EI eligibility rate (that is, having worked for a minimum number of insurable hours in the previous 52 weeks or since the start of last claim, whichever is shorter). Intuitively, unemployed workers who previously held full-time positions have a higher eligibility rate because they are more likely to have worked enough hours of insurable employment to qualify for EI regular benefits than part-time workers. Similarly, those who had permanent jobs are also more likely to report a higher eligibility rate than those who were classified as having temporary employment.
Chart 17 illustrates the EI eligibility rates by previous employment characteristics from 2009 to 2016. It can be seen that the eligibility rate for both permanent and temporary workers increased in 2016 from the previous year. In 2016, the eligibility rate for permanent workers was 92.8%, compared to 75.7% for temporary workers and 85.4% for all workers. The gap in eligibility rates between permanent workers and temporary workers decreased to 17.1 percentage points in 2016, down from 17.9 percentage points in the previous year. In the previous seven years, this gap was the lowest in 2014 (9.9 percentage points) and the highest in 2010 (20.0 percentage points).

Text description of Chart 17
| 2009 | 2010 | 2011 | 2012 | 2013 | 2014 | 2015 | 2016 | |
|---|---|---|---|---|---|---|---|---|
| All Workers | 86.2% | 83.9% | 78.4% | 81.9% | 85.8% | 83.1% | 82.8% | 85.4% |
| Permanent workers | 92.2% | 92.4% | 87.2% | 89.9% | 91.4% | 87.7% | 90.0% | 92.8% |
| Temporary workers | 75.3% | 72.3% | 68.3% | 72.2% | 79.0% | 77.7% | 72.2% | 75.7% |
Source: Statistics Canada, Employment Insurance Coverage Survey, 2009 to 2016.
As shown in Chart 18, the eligibility rate of permanent full-time workers was 95.3% in 2016—the highest observed in the last ten years. The eligibility rate for temporary seasonal workers is not far below than that of full-time permanent employees, and the gap between the eligibility rates of these two groups reduced in 2016 compared to the previous year. Temporary seasonal workers have an eligibility rate consistently above part-time permanent employees and temporary non-seasonal workers. The eligibility rates of temporary non-seasonal workers (66.4% in 2016) and permanent part-time workers (62.4% in 2016) have relatively the same trend and experienced fluctuations over the past seven years.

Text description of Chart 18
| 2009 | 2010 | 2011 | 2012 | 2013 | 2014 | 2015 | 2016 | |
|---|---|---|---|---|---|---|---|---|
| Permanent full-time workers | 94.3% | 94.5% | 91.2% | 94.6% | 95.0% | 90.1% | 93.3% | 95.3% |
| Permanent part-time workers | 68.8% | 74.4% | 54.9% | 65.2% | 71.4% | 66.2% | 65.8% | 62.4% |
| Temporary seasonal workers | 81.4% | 83.6% | 81.2% | 75.6% | 85.1% | 84.6% | 82.6% | 87.5% |
| Temporary non-seasonal workers | 70.5% | 64.7% | 60.0% | 69.8% | 74.5% | 73.0% | 64.0% | 66.4% |
Source: Statistics Canada, Employment Insurance Coverage Survey, 2009 to 2016
Access to Employment Insurance regular benefits
Access to EI regular benefits is another way to consider of how well the EI program is working to meet the needs of the labour market in providing EI regular benefits to help the unemployed transition to new employment.Footnote 35 For the purpose of the EI Monitoring and Assessment Report, access to EI regular benefits is measured as the share of unemployed population receiving EI regular benefits. The two main ratios used to measure accessibility are the Beneficiary-to-Unemployed (B/U) ratio and the Beneficiary-to-Unemployed Contributor (B/UC) ratio. Chart 19 shows the comparison of these two ratios for 2015 and 2016.
Both the B/U ratio and the B/UC ratio increased in 2016 compared to 2015. This is because the increase in the number of beneficiaries (+27,300) from 2015 to 2016 was much higher than the increase in the number of unemployed (+2,900) and the number of unemployed contributors (+2,000) during the same time period.

Text description of Chart 19
| 2015 | 2016 | |
|---|---|---|
| Beneficiary-to-Unemployed (B/U) Ratio | 39.8% | 41.8% |
| Beneficiary-to-Unemployed Contributor (B/UC) Ratio | 61.0% | 64.0% |
Sources: Statistics Canada, Employment Insurance Coverage Survey (for data on unemployed (U), and unemployed contributors (UC)); and Statistics Canada, monthly Employment Insurance statistics release, CANSIM table 276-0020 (for data on regular beneficiaries (B)).
The Beneficiary-to-Unemployed (B/U) ratio
The access measure with the broadest population base is the Beneficiary-to-Unemployed (B/U) ratio where the average number of individuals who received EI regular benefits in the reference week of the EICS is expressed as a share of the corresponding unemployed population.Footnote 36 As such, it includes a significant segment of the population who are considered ineligible for EI regular benefits (such as the number of unemployed who have not worked in the previous year or never worked, who did not have a valid job separation, or who were self-employed) and is sensitive to changes in the composition of the unemployed population and the proportion of the unemployed people outside the scope of the EI program coverage.
Chart 20 illustrates the B/U ratio for Canada from 2012 to 2016. Because the total unemployed population is considered within the B/U ratio, its movement is more likely to reflect labour market conditions and EI eligibility fluctuations that are not necessarily associated with EI policies. This makes this ratio less suited to measuring access to EI regular benefits.

Text description of Chart 20
| 2012 | 2013 | 2014 | 2015 | 2016 | |
|---|---|---|---|---|---|
| Beneficiary-to-Unemployed (B/U) ratio (%) | 40.6% | 38.4% | 38.6% | 39.8% | 41.8% |
Note: The B/U Ratio is calculated as follows: (number of EI regular beneficiaries ÷ number of unemployed).
Source: Statistics Canada, Employment Insurance Coverage Survey (for data on the unemployed (U)); and Statistics Canada, monthly Employment Insurance statistics release, CANSIM table 276-0020 (for data on regular beneficiaries (B)).
The Beneficiary-to-Unemployed Contributor (B/UC) ratio
Another access measure, known as the Beneficiary-to-Unemployed Contributor (B/UC) ratio, is the number of EI regular beneficiaries as a share of the unemployed who contributed EI premiums in the previous 12 months. This ratio considers a narrower target population than the B/U ratio. Because the B/UC ratio measures accessibility among unemployed workers for whom the EI regular benefits are designed to provide coverage, and excludes those unemployed who did not contribute EI premiums during their last employment period, this ratio may provide a better assessment of accessibility to EI regular benefits of the EI program.
Chart 21 illustrates the B/UC ratios for Canada from 2012 to 2016. The B/UC ratio increased from 61.0% in 2015 to 64.0% in 2016 (+3.0 percentage points). This increase is attributable to the growth in the number of beneficiaries of EI regular benefits (+5.3%) outpacing the growth in the number of unemployed contributors (+0.2%).

Text description of Chart 21
| 2012 | 2013 | 2014 | 2015 | 2016 | |
|---|---|---|---|---|---|
| Beneficiary-to-Unemployed Contributor (B/UC) ratio (%) | 65.8% | 61.5% | 63.4% | 61.0% | 64.0% |
Note: The B/UC ratio is calculated as follows: (number of EI regular beneficiaries ÷ number of unemployed who contributed to the EI program).
Source: Statistics Canada, Employment Insurance Coverage Survey (for data on the unemployed contributors (UC)); and Statistics Canada, monthly Employment Isurance statistics release, CANSIM table 276-0020 (for data on regular beneficiaries (B)).
Access and eligibility to Employment Insurance regular benefits among the youth
A recent study by ESDC* looked at the EI eligibility characteristics and access to EI benefits among Canada’s youth (those who are aged between 15-24 years). In 2015, a significant proportion (45.6%) of the unemployed young workers consisted of EI non-contributors, due to the rise in young individuals who have never worked, as well as the rise in the number of self-employed and unpaid family workers—a trend that has been observed since the 2008 recession. Among the unemployed young workers who contributed to the EI program, more than half (52.9%) of them had an invalid job separation. This may be attributable to the employment characteristics of the younger workers (they are more likely to quit jobs to go back to school, which is counted as an invalid job separation by the EI program) compared to workers in other age groups.
The EI eligibility rate among the youth was 54.0% in 2015, compared to 82.1% among those who were 25 to 44 years of age, and 90.7% among those who were aged 45 years and over. Over the years, young females were found to have lower EI eligibility rates than young males, except in 2001 and 2015. Between 2000 and 2015, the average EI eligibility rate for young males was 54.7%, compared to 45% for young females.
In terms of access to EI regular benefits, in 2015 the B/U ratio for young unemployed workers was 16.8%, compared to 46.2% for those aged 25-54 years, and 50.5% for older workers aged 55 and over. The B/UC ratio for the youth was 31% in 2015, compared to 67.3% among unemployed workers in the older age groups. Both of these ratios were found to be lower among young females than males.
*ESDC. Access and Eligibility to EI Regular Benefits among Young People in Canada’s Labour Market. (Ottawa: ESDC, Employment Insurance Policy Directorate, 2018).
2.3 Level of Employment Insurance regular benefits
The level of EI regular benefits (that is the weekly regular benefit rate) that an EI claimant is entitled to receive is calculated as 55% of their highest (best) weeks of insurable earnings over the qualifying period, up to the maximum weekly benefit rate. The number of weeks used to determine this level varies from 14 to 22 weeks depending on the unemployment rate of the claimant’s EI economic region. Furthermore, low-income family claimants may be eligible for the Family Supplement Provision which can increase their level of benefits up to 80% of their weekly insurable earnings (see subsection 2.1.1).
During the reporting period, EI regular claimants received on average $449 in weekly regular benefits, a 0.7% increase from $446 in the previous year. This slight increase marks the first time since FY1213 that growth in the average weekly regular benefits was below 1.0%. Year-over-year, only Territories, New Brunswick, Quebec, Ontario, Manitoba and British Columbia reported increases in their level of weekly regular benefits, while other jurisdictions witnessed decreases , except for Prince Edward Island where the average weekly regular benefit remained unchanged. The average level of EI weekly regular benefits at the provincial and territorial level varied from a high of $511 in the Northwest Territories to a low of $419 in Prince Edward Island during the reporting period (see Annex 2.5). Claimants from Atlantic provinces, Quebec and Manitoba had average weekly regular benefit rates that were under the national average.

Text description of Chart 22
| Insurable hours worked | Men's average weekly benefit rate | Women's average weekly benefit rate |
|---|---|---|
| 420 to 559 | $375 | $273 |
| 560 to 699 | $401 | $312 |
| 700 to 839 | $416 | $328 |
| 840 to 979 | $434 | $355 |
| 980 to 1119 | $450 | $371 |
| 1120 to 1259 | $464 | $399 |
| 1260 to 1399 | $475 | $419 |
| 1400 to 1539 | $486 | $457 |
| 1540 to 1679 | $490 | $446 |
| 1680 to 1819 | $495 | $450 |
| 1820 or more | $511 | $472 |
Note:Includes all claims for which at least $1 of EI regular benefits was paid.
Source: Employment and Social Development Canada, Employment insurance (EI) administrative data. Data are based on a 10% sample of EI administrative data.
Consistent with the past several years, men had a higher average weekly regular benefit rate ($474) than women ($412) in FY1617. The gap in the average weekly benefit rate between men and women is observable for all hours of insurable employment worked during the qualifying period and is more apparent at lower levels of labour market attachment (see Chart 22). This gap between the average weekly benefit rates of men and women is gradually closing. Indeed, in FY0910 women’s average weekly benefit rate was 84.6% of men’s, while in FY1617 it reached 86.9%. Among men, those 45 years to 54 years old had the highest average weekly regular benefit rate ($488), while it was those between 25 and 44 years old ($427) among women.
As shown in Table 17, EI regular claims established by claimants between 25 and 44 years old had the highest average weekly EI regular benefit rate in FY1617 ($462), while those established by claimants younger than 25 years old had the lowest ($412). Among all age categories, claimants who were between 45 and 54 years old experienced the highest increase in their weekly benefit rate (+1.3% or +$6), while those under 25 years old were the only ones who reported a decrease (-1.7% or -$7).
| Men | Women | Total | ||||
|---|---|---|---|---|---|---|
| 2015/2016 | 2016/2017 | 2015/2016 | 2016/2017 | 2015/2016 | 2016/2017 | |
| 24 years old and under | $437 | $429 | $363 | $364 | $419 | $412 |
| 25 to 44 years old | $479 | $484 | $421 | $427 | $458 | $462 |
| 45 to 54 years old | $482 | $488 | $408 | $414 | $449 | $455 |
| 55 years old and over | $459 | $463 | $385 | $392 | $431 | $435 |
| Canada | $470 | $474 | $406 | $412 | $446 | $449 |
Note: Includes all claims for which at least $1 in EI regular benefits was paid.
Source: Employment and Social Development Canada, Employment Insurance (EI) administrative data. Data are based on a 10% sample of EI administrative data.
Table 18 shows that during the reporting period, all claimant categories experienced an increase in their average weekly benefit rate, with the largest increase observed for frequent claimants and long-tenured workers. Long-tenured workers were entitled to the highest average weekly regular benefit rate with $489, which compares to $453 for frequent claimants and $429 for occasional claimants.
| Average weekly benefit rate ($) | EI claimants who were entitled to the maximum weekly benefit rate in 2016/2017 (%) | |||
|---|---|---|---|---|
| 2015/2016 | 2016/2017 | Change (%) | ||
| Long-tenured workers | $482 | $489 | +1.6% | 63.7% |
| Occasional claimants | $428 | $429 | +0.3% | 38.1% |
| Frequent claimants | $446 | $453 | +1.6% | 45.7% |
| Canada | $446 | $449 | +0.7% | 46.1% |
Note: Includes all claims for which at least $1 in EI regular benefits was paid.
*See Annex 2.1 for definitions of claimant categories referenced in this table.
Source: Employment and Social Development Canada, Employment Insurance (EI) administrative data. Data are based on a 10% sample of EI administrative data.
The proportion of claims that were paid at the maximum benefit rate (based on the MIE) fell by 2.9 percentage points to 46.1% in FY1617 over the previous year. By gender, 56.9% of men who established a regular claim during the reporting period were entitled to the maximum weekly benefit rate compared to only 29.2% of women. This proportion varied from 30.4% for regular claimants younger than 25 years old to 50.7% for those aged between 25 and 44 years old. As for claimant categories, a sizeable majority (63.7%) of long-tenured workers who had an EI claim established were entitled to the maximum weekly benefit rate compared to only 45.7% of frequent claimants and 38.1% of occasional claimants.
Claimant obligations to search for and accept suitable employment
In order to receive EI benefits under the Employment Insurance Act, an EI regular benefit claimant—with certain exceptions—must be capable of and available for, but unable to obtain, suitable employment and must demonstrate this by searching for and taking advantage of an opportunity for suitable employment. During the reporting period, the criteria for determining what constitutes suitable employment were the following:
- the claimant’s health and physical capabilities allow them to commute to the place of work and to perform the work;
- the hours of work are not incompatible with the claimant’s family obligations or religious beliefs; and
- the nature of the work is not contrary to the claimant’s moral convictions or religious beliefs.
In FY1617, there were 1,510 disqualifications and disentitlements related to failure to search for work (1,340) and refusal of suitable employment (170), an increase of 25.8% from the previous year. However, this represented only 0.1% of all disqualifications and disentitlements and does not take into consideration that benefits would generally have been reinstated once the claimant demonstrated they were fulfilling their responsibility in some situations.
Source: Statistics Canada, Labour Force Survey, CANSIM table 276-0003.
Benefit repayments in the 2015 tax year*
Pursuant to the Employment Insurance Act, EI claimants must repay a percentage of EI benefits they received if their net income for a taxation year exceeds 1.25 times the maximum yearly insurable earnings. In 2015, they were required to repay 30% of the lesser of their net income above $61,875 or 30% of regular or fishing benefits they received in that taxation year. However, claimants who received special benefits or less than one week of either regular or fishing benefits in the preceding ten taxation years were exempt from the benefit repayment requirement.
For the 2015 taxation year, roughly 172,200 claimants repaid a total of $247.5 million in EI benefits. On average, EI claimants subject to the benefit repayment provision repaid $1,437 in 2015; this amount has increased for five consecutive years (see Annex 2.24), up from $1,343 in 2014. EI claimants who repaid a portion of their benefits had received on average $6,185 in EI benefits (any type of benefits, including EI special benefits) in 2015, which compares to $5,829 in 2014.
* 2015 is the most recent taxation year for which data is available.
2.4 Extension of Employment Insurance regular benefits for workers in regions affected by the downturn in commodity prices
Declines in global commodity prices in late 2014 produced sharp and sustained unemployment shocks in commodity-based regions. The Budget Implementation Act, 2016, No.1 included a measure that provided eligible unemployed workers in the 15 regions hardest hit by the downturn in commodity prices with additional weeks of EI regular benefits.Footnote 37
This temporary measure extended the duration of EI regular benefits by five weeks, up to a maximum of 50 weeks of EI regular benefits, for all eligible claimants residing in these 15 EI economic regions. An additional 20 weeks of EI regular benefits (for a total of 25 weeks) was made available to long-tenured workers in the same 15 EI economic regions, up to a maximum of 70 weeks of EI regular benefits.Footnote 38 Those claimants may have spent years working in one industry or for one employer. The additional weeks of EI benefits provided them with the financial support they needed while they searched for work. These benefits were available for one year, beginning on July 3, 2016, and applied to anyone who started a claim for EI regular benefits on or after January 4, 2015, and was still unemployed at the time the measure came into force or during the year following its implementation.Footnote 39,Footnote 40
In order to claim additional weeks of EI regular benefits, eligible EI claimants had their benefit period extended by 12 weeks plus the number of additional weeks of EI benefits they were entitled to receive. For instance, a claimant eligible to receive five additional weeks of EI regular benefits had a benefit period extension of 17 weeks (12+5). Long-tenured workers, entitled to an additional 25 weeks of benefits, had a benefit period extension of 37 weeks (12+25).
Employment Insurance claimants eligible for the additional weeks of Employment Insurance regular benefits
For the purpose of this section, which aims to analyze the impacts of the temporary measure for regions impacted by the downturn in commodity prices, different populations of EI claimants are considered. As this temporary help measure targeted claims that were established as early as January 4, 2015 and because it came into force on July 3, 2016, some claims had already been terminatedFootnote 41 by the time the measure was implemented. If, as of July 3, 2016, a claimant eligible for the temporary support measure was associated with such a terminated claim and was still unemployed, he would then qualify for some additional weeks of EI regular benefits. Claims associated with these individuals are referred to as “reach-back claims”.
Example: Weeks of Employment Insurance benefits paid during the benefit period extension
Robert lives in Calgary and had established a claim for EI regular benefits on March 7, 2015. He was entitled to 14 weeks of EI regular benefits. After being paid 10 weeks of EI regular benefits, he found a job and worked there until June 2016 before being laid off. At the time of implementation of the Budget Implementation Act, 2016, No.1, he was still unemployed and his claim terminated in March 2016 (although he had four weeks of EI regular benefits left to claim). Robert is thus a reach-back claimant. He was not a long-tenured worker and was therefore eligible for five additional weeks of EI regular benefits. On July 3, 2016, he was allowed a benefit period extension of 17 weeks to claim them. During his benefit period extension, he could not claim any of the four weeks of EI regular benefits he had left from his original entitlement.
Sandra lives in Edmonton and established a claim for EI regular benefits on August 15, 2016. She was not considered to be a long-tenured worker. She was entitled to 25 weeks of EI regular benefits plus an additional five extra weeks because of the Budget Implementation Act 2016, No.1. Her benefit period was 69 weeks (52 + an extension of 17 weeks). During the first 52 weeks, she claimed 20 weeks of EI regular benefits. During her benefit period extension, she claimed the remaining 10 weeks of EI regular benefits she had left.
In addition to reach-back claims, there are claims for EI regular benefits that were established after January 4, 2015, and that were still open by the time the Budget Implementation Act, 2016, No.1, came into force.Footnote 42 These claims are referred to as active EI claims.
Finally, claims for EI regular benefits that were established between July 3, 2016, and July 8, 2017, and thus on or after the temporary measure implementation date, are referred to as new claims.
Distinguishing reach-back claims from active and new claims is important because the benefit period extension did not have the same repercussion for all of them. For instance, active and new claims had their benefit period extended before their original benefit period of 52 weeks terminated. Hence, claimants associated with these claims could receive, during their benefit period extension, any weeks of EI regular or special benefits they were entitled to receive in their original 52 weeks benefit period and that they did not claim during that period. Conversely, reach-back claims were terminated when claimants were provided with a new benefit period to receive their additional benefits. As a result, they were not allowed to claim, during their benefit period extension, any regular weeks of EI benefits from their original entitlement that were not claimed during their former benefit period of 52 weeks.
Claims for Employment Insurance regular benefits in regions affected by the downturn in commodity pricesFootnote 43
Among all claims that received additional weeks of EI regular benefits during the reporting period, a greater share were established by men (62.8%) and claimants aged between 25 and 44 years old (41.5%)—see Table 19. Claims established in Alberta also accounted for a more important share of claims that received additional weeks of benefits (48.1%). The share of eligible claims with additional benefits is lower for claims established in the reporting fiscal year (25.6%) when compared with the share for eligible claims established since January 4, 2015 (36.7%). This is notably because many claims established towards the end of the reporting period are not yet terminated at the time of reporting. Even though those claims have not used any additional weeks of benefits at the time of reporting, they still could claim some before ending.
| Claims with additional weeks of EI benefitsp | ||||||
|---|---|---|---|---|---|---|
| Claims established in 2016/2017 | Claims established between January 4, 2015 and March 31, 2017 | |||||
| Number of claims with additional benefits | Share of claims with additional benefits among eligible claims (%) | Distribution of claims among all those with additional benefits (%) | Number of claims with additional benefits | Share of claims with additional benefits among eligible claims (%) | Distribution of claims among all those with additional benefits (%) | |
| Province or territory | ||||||
| Newfoundland and Labrador | 10,140 | 23.4% | 13.3% | 41,500 | 42.5% | 16.3% |
| Ontario | 6,830 | 25.0% | 9.0% | 24,100 | 37.2% | 9.5% |
| Manitoba | 1,850 | 26.2% | 2.4% | 5,650 | 36.6% | 2.2% |
| Saskatchewan | 7,340 | 25.2% | 9.6% | 23,790 | 35.7% | 9.4% |
| Alberta | 38,400 | 26.0% | 50.4% | 122,140 | 35.5% | 48.1% |
| British Columbia | 11,220 | 26.4% | 14.7% | 35,560 | 35.4% | 14.0% |
| Yukon | 320 | 33.3% | 0.4% | 800 | 36.9% | 0.3% |
| Nunavut | 150 | 22.4% | 0.2% | 560 | 41.8% | 0.2% |
| Gender | ||||||
| Men | 45,010 | 23.6% | 59.0% | 159,640 | 34.4% | 62.8% |
| Women | 31,240 | 29.0% | 41.0% | 94,460 | 41.3% | 37.2% |
| Age category | ||||||
| 24 years old and under | 8,130 | 21.2% | 10.7% | 24,430 | 26.7% | 9.6% |
| 25 to 44 years old | 33,060 | 24.4% | 43.4% | 105,470 | 33.5% | 41.5% |
| 45 to 54 years old | 16,480 | 25.9% | 21.6% | 58,800 | 39.8% | 23.1% |
| 55 years old and over | 18,580 | 30.5% | 24.4% | 65,400 | 47.0% | 25.7% |
| EI claimant category* | ||||||
| Long-tenured worker | 17,870 | 21.4% | 23.4% | 71,300 | 34.0% | 28.1% |
| Non long-tenured worker | 58,380 | 27.2% | 76.6% | 182,800 | 37.8% | 71.9% |
| Claim status | ||||||
| Reach-back | N/A | N/A | N/A | 74,430 | 49.8% | 29.3% |
| Active or new | 76,250 | 25.6% | 100.0% | 179,670 | 33.1% | 70.7% |
| Canada | 76,250 | 25.6% | 100.0% | 254,100 | 36.7% | 100.0% |
Note: Data may not add up to the total due to rounding. Includes all claims for which at least $1 of additional benefit was paid.
p Preliminary data.
* See Annex 2.1 for definitions of claimant categories referenced in this table.
Source: Employment and Social Development Canada, Employment Insurance (EI) administrative data. Data are based on a 10% sample of EI administrative data.
While some eligible claimants did not use any additional weeks from the temporary help measure, they nevertheless benefited from the benefit period extension. These claimants either claimed weeks of EI regular benefits from their original entitlement or weeks of special benefits during the benefit period extension. Among all eligible claims established before or during FY1617, there are close to 85,100 that met those criteria (see Table 20). Furthermore, approximately 43,000 claims were associated, during their benefit period extension, with both additional weeks of EI benefits and, either or both, previously unclaimed weeks of regular benefits during their original benefit period or weeks of special benefit claimed during the benefits period extension.
| Claims established in 2016/2017p | Claims established between January 4, 2015 and March 31 2017p | ||||
|---|---|---|---|---|---|
| Number | As a share of eligible claims established (%) | Number | As a share of eligible claims established (%) | ||
| Type of benefits under the temporary support measure | |||||
| Additional weeks of EI regular benefits only | 70,900 | 23.8% | 211,130 | 30.5% | |
| At least one week of additional EI regular benefits and one week of original entitlement in the benefit period extension | 5,350 | 1.8% | 42,970 | 6.2% | |
| Sub-total for claims with at least one week of additional EI regular benefits | 76,250 | 25.6% | 254,100 | 36.7% | |
| Weeks of original entitlement during the benefit period extension only | 28,270 | 9.5% | 85,110 | 12.3% | |
| Canada | 104,520 | 35.0% | 339,210 | 49.0% | |
Note: Data may not add up to the total due to rounding. Includes all claims which benefited from the temporary support measure.
p Preliminary data.
Source: Employment and Social Development Canada, Employment Insurance (EI) administrative data. Data are based on a 10% sample of EI administrative data.
Claim duration, exhaustion rate and benefits paid in regions affected by the downturn in commodity prices
Of the 339,200 claims that benefited from the temporary extension of EI regular benefits, 198,200 were completedFootnote 44 during the reporting fiscal year. The average duration of those claims was 36.9 weeks (28.4 weeks if we exclude weeks associated with the temporary support measure)—see Table 21.
The additional weeks of benefits helped reduce the exhaustion rate (both entitlement and benefit period exhaustion combined) of eligible claims completed in FY1617. The rate declined from 53.2% (before they were provided with additional weeks of EI benefits) to 43.0%. This suggests that while many unemployed individuals needed additional weeks of EI benefits to help them find work, several were able to secure a new job before either using all their additional entitlement or reaching the end of their extended benefit period.
Claims for EI regular benefits that benefited from the temporary extension of EI regular benefits and that were completed during the reporting fiscal year had an average weekly benefit rate of $461. This compares with $489 for regular claims completed in the 15 EI economic regions targeted by the temporary support measure and that did not benefit from the temporary support measure. Regular claims completed in FY1617 that received at least one week of additional benefits and/or at least one week of EI benefits during the benefit period extension were paid an average of $16,263 over their entire duration. Excluding all weeks of benefits due to the temporary help measure, which extended EI regular benefits, the average EI benefits paid to those claimants would have been $12,480. In comparison, claims for EI regular benefits which were completed in those EI economic regions during the reporting fiscal year and that did not benefit from the temporary measure received an average of $7,701
| Excluding weeks of benefits paid under the temporary support measure p | Including weeks of benefits paid under the temporary support measure p | |||
|---|---|---|---|---|
| Average claim duration (in weeks) | Total EI benefits paid per claim ($)* | Average claim duration (in weeks) | Total EI benefits paid per claim ($)* | |
| Province or territory | ||||
| Newfoundland and Labrador | 33.4 | $13,402 | 41.1 | $16,605 |
| Ontario | 27.7 | $11,321 | 35.4 | $14,540 |
| Manitoba | 31.0 | $12,699 | 38.3 | $15,785 |
| Saskatchewan | 27.1 | $12,014 | 35.6 | $15,802 |
| Alberta | 27.4 | $12,894 | 36.7 | $17,226 |
| British Columbia | 26.0 | $11,123 | 33.8 | $14,420 |
| Yukon | 21.8 | $10,315 | 30.5 | $14,273 |
| Nunavut | 35.5 | $17,039 | 43.1 | $20,636 |
| Gender | ||||
| Men | 28.8 | $13,421 | 37.4 | $17,484 |
| Women | 27.7 | $10,805 | 35.9 | $14,089 |
| Age category | ||||
| 24 years old and under | 27.1 | $11,788 | 33.4 | $14,548 |
| 25 to 44 years old | 28.3 | $12,635 | 36.4 | $16,321 |
| 45 to 54 years old | 28.6 | $12,553 | 37.5 | $16,554 |
| 55 years old and over | 29.1 | $12,473 | 38.8 | $16,703 |
| EI claimant category** | ||||
| Long-tenured worker | 28.1 | $13,287 | 44.6 | $20,943 |
| Non long-tenured worker | 28.5 | $12,262 | 34.8 | $15,001 |
| Type of benefits under the temporary support measure | ||||
| Claims with additional regular benefits only | 30.2 | $13,166 | 38.2 | $16,670 |
| Claims with original entitlement weeks or special benefits only during the benefit period extension | 19.8 | $9,021 | 28.5 | $13,036 |
| Claims with weeks of additional regular benefits and weeks of original entitlement or of special benefits in the benefit period extension | 29.1 | $13,031 | 40.4 | $18,159 |
| Canada | 28.4 | $12,480 | 36.9 | $16,263 |
Note: Includes all completed claims which benefited from the temporary support measure.
*Total EI benefits (regular or special) paid to claims established for regular benefits and that were completed in 2016/2017.
**See Annex 2.1 for definitions of claimant categories referenced in this table.
pPreliminary data.
Source: Employment and Social Development Canada, Employment Insurance (EI) administrative data. Data are based on a 10% sample of EI administrative data.
Amount paid to claimants benefiting from the extension of Employment Insurance regular benefits for workers in regions affected by the downturn in commodity prices
During the reporting fiscal year, $998.4 million were paid to EI claimants under the Budget Implementation Act, 2016, No.1. Of that amount, $301.5 million were paid to reach-back claims. The majority (67.6% or $675.0 million) of the benefits paid were associated with additional weeks of regular benefits provided under the Budget Implementation Act, 2016, No.1. The remaining benefits (32.4% or $323.4 millions) stemmed from weeks of EI regular benefit claimants had qualified for prior to the implementation of the temporary help measure or special benefits that were paid during the benefit period extension.
Extension of Employment Insurance regular benefits to unemployed workers with exhausted entitlement in commodity-based regions
According to a study* on the use of the extended regular benefits temporary measure, there were 75,700 reach-back claims (established on or after January 4, 2015 and ended prior to July 3, 2016 in the 15 regions targeted by the Budget Implementation Act, 2016, No.1) that benefited from the temporary support measure. These reach-back claims collected $301.5 million in additional benefits. Among them, about 54,100 claims were previously terminated because the claimants had received all the regular weeks of EI benefits they were entitled to. Another 21,600 had ended because claimants had reached the last week of their claim during which they could receive EI benefits.
Claims associated with long-tenured workers accounted for 31.0% of all reach-back claims that benefited from the temporary support measure. However, they received 64.6% of all additional EI benefits paid, reflecting the greater number of additional weeks they were entitled to receive.
*ESDC, Extension of EI Regular Benefits to Unemployed Workers with Exhausted Entitlement in Commodity-Based Regions (Ottawa: ESDC, Employment Insurance Policy Directorate, 2018).
2.5 Employment Insurance regular benefit entitlement
Eligible claimants who have successfully established an EI claim receive up to a set maximum number of weeks of EI regular benefits (known as their entitlement). Their entitlement is determined by the number of hours of insurable employment worked during the qualifying period and the effective unemployment rate in the claimant’s EI economic region at the time the claim is established (see Annex 2.2 for the entitlement table). This subsection presents detailed analysis on the duration of EI regular benefits, both maximum entitlement and actual weeks used. Statistics presented in the subsection are generally based on claims that were completedFootnote 45 during the fiscal year. Statistics for the reporting fiscal year (FY1617) are preliminary estimates which are subject to revision in the future.
Maximum and actual duration of Employment Insurance regular benefits
Under most circumstances, the maximum entitlement of EI regular benefits available to an EI claimant is between 14 and 45 weeks, depending on the local unemployment rate and the claimant’s accumulated number of hours of insurable employment during the qualifying periodFootnote 46. Higher maximums are associated with greater hours of insurable employment accumulated during the qualifying period and higher regional unemployment rates. The EI program is designed to respond automatically to changes in economic conditions that affect local labour markets. To do so, the country is divided into 62 economic regions. In general, when a region’s unemployment rate rises, the entrance requirement is reduced and the maximum duration of benefits increases. Therefore, the amount of assistance provided adjusts to the changing needs of regions and communities.
The actual duration of a claim is the number of weeks of EI regular benefits an EI claimant receives during a claimFootnote 47. Actual duration is usually lower than maximum duration, reflecting circumstances that can lead to reduced use of EI regular benefits over a claim’s benefit period (such as the claimant has found work, switched to special benefits, became unavailable to work).
Compared with the previous fiscal year, the maximum duration of claims completed during the reporting fiscal year went up by 1.6 weeks to 33.7 weeks. The average actual duration also increased, up 1.2 weeks, to 20.5 weeks (see Chart 23). Those increases contrast with the general declining trend observed during the previous years.

Text description of Chart 23
| 2009/2010 | 2010/2011 | 2011/2012 | 2012/2013 | 2013/2014 | 2014/2015 | 2015/2016 | 2016/2017 | |
|---|---|---|---|---|---|---|---|---|
| Unemployment rate (right scale) | 8.5% | 7.9% | 7.4% | 7.2% | 7.0% | 6.9% | 7.0% | 6.9% |
| Average actual duration in weeks (left scale) | 21.9 | 24.0 | 21.6 | 20.1 | 19.7 | 19.4 | 19.3 | 20.5 |
| Average maximum duration in weeks (left scale) | 38.8 | 41.7 | 35.4 | 33.0 | 32.1 | 31.6 | 32.1 | 33.7 |
Note: Includes all claims completed during the fiscal year for which at least $1 of regular benefit was paid.
*Coincides with the Employment Insurance temporary measures that increased the maximum number of weeks for which regular benefits could be paid.
rRevised data.
pPreliminary data.
Sources: Employment and Social Development Canada, Employment Insurance administrative (EI) data (for data on duration of regular benefits); and Statistics Canada, Labour Force Survey, CANSIM table 282-0007 (for data on unemployment rates). ESDC data are based on a 10% sample of EI administrative data.
A number of factors during the reporting period likely affected benefit duration. Higher unemployment rates in several provinces and territories, at the time the claims were established,Footnote 48 led to increases in maximum and average durations. In addition, the temporary support measure implemented through the Budget Implementation Act, 2016, No.1 also contributed to the increase in duration (both actual and maximum). This measure increased, by at least five weeks, the maximum duration of EI regular benefits for eligible claimants in 15 EI economic regions impacted by the downturn in commodity prices.Footnote 49,Footnote 50 As discussed in subsection 2.2.4, it also increased the actual duration of EI regular benefits in the regions targeted by the measure.
Methodological note: Changes to claims’ duration statistics
In the previous two EI Monitoring and Assessment Reports, preliminary estimates of the actual duration of EI regular benefits were reported based on all claims established during the reporting fiscal year. However, many claims were still not completed by the time of reporting. As a result, statistical adjustments were applied to the data in order to provide reasonable duration estimates.
Starting with this report, actual duration estimates are based on claims that were completed (that is terminated or for which no activity was reported as of August of following fiscal year) during the reporting fiscal year. Incomplete claims that are still active at the end of the fiscal year, whose duration extends into the following fiscal year, are thus excluded from the statistics. The new methodology is expected to provide more precise duration estimates relative to the former one. Moreover, it should also better capture the impact of temporary changes in the EI program or sudden shifts in the economy on the duration of EI regular benefits.
Accordingly, new statistics on maximum duration and proportion of weeks used for claims completed during the fiscal year will also be presented. This will allow having both maximum and actual duration measures that pertain to the same set of claims (that is completed claims).
In general, the average maximum duration of claims for EI regular benefits completed during the reporting fiscal year varied significantly across provinces and territories. These divergences are attributable to differences in labour markets and labour force characteristics. Alberta (44.9 weeks) and Nunavut (44.1 weeks), which both include some of the regions impacted by the downturn in commodity prices and benefited from additional weeks of EI regular benefits implemented as part of the Budget Implementation Act, 2016, No.1, posted the highest average maximum duration. Conversely, Quebec and Ontario had the lowest averages at 30.1 weeks and 31.1 weeks respectively (see Table 22).
Long-tenured workers are generally more likely to accumulate insurable hours of employment well above the minimum requirements for EI regular benefits. As such, they tend to benefit from longer entitlements (40.4 weeks during the reporting fiscal year) relative to frequent claimants (30.2 weeks) who averaged shorter employment spells.
With regards to the average actual duration of EI regular benefits, changes were generally in line with those observed for maximum duration. Provincial and territorial trends, notably affected by the changes in their local labour market conditions, showed greater variability. As such, Alberta (+7.0 weeks) and Saskatchewan (+6.2 weeks) recorded the largest increases in the average actual duration in FY1617.
During the same period, EI regular claims from the Mining, oil and gas extraction sector had, on average, the greatest maximum duration (44.3 weeks), followed by those from Management of companies and enterprises (37.6 weeks). The higher maximum duration levels in these industries, relative to the national average (33.7 weeks), are partly attributed to a large proportion of claimants qualifying as long-tenured workers.
| Average maximum duration (weeks) |
Average actual duration (weeks) |
|||||
|---|---|---|---|---|---|---|
| 2015/2016r | 2016/2017p | Change | 2015/2016r | 2016/2017p | Change | |
| Province or territory | ||||||
| Newfoundland and Labrador | 39.0 | 42.4 | +3.4 | 26.0 | 31.6 | +5.6 |
| Prince Edward Island | 33.5 | 33.8 | +0.3 | 23.3 | 23.1 | -0.2 |
| Nova Scotia | 34.1 | 33.4 | -0.7 | 23.7 | 23.1 | -0.6 |
| New Brunswick | 35.7 | 34.4 | -1.3 | 24.0 | 23.4 | -0.6 |
| Quebec | 30.6 | 30.1 | -0.5 | 18.6 | 18.0 | -0.6 |
| Ontario | 30.7 | 31.1 | +0.4 | 18.3 | 18.6 | +0.3 |
| Manitoba | 30.4 | 32.1 | +1.7 | 17.9 | 19.1 | +1.2 |
| Saskatchewan | 36.4 | 41.6 | +5.2 | 18.3 | 24.5 | +6.2 |
| Alberta | 36.8 | 44.9 | +8.1 | 17.4 | 24.5 | +7.0 |
| British Columbia | 30.8 | 33.0 | +2.2 | 18.4 | 20.0 | +1.6 |
| Yukon | 34.2 | 31.8 | -2.4 | 21.6 | 20.6 | -1.0 |
| Northwest Territories | 36.8 | 34.2 | -2.6 | 26.6 | 21.3 | -5.3 |
| Nunavut | 41.3 | 44.1 | +2.8 | 27.0 | 31.3 | +4.3 |
| Gender | ||||||
| Men | 32.8 | 34.4 | +1.6 | 19.6 | 20.6 | +1.1 |
| Women | 31.0 | 32.5 | +1.5 | 18.9 | 20.1 | +1.2 |
| Age category | ||||||
| 24 years old and under | 31.0 | 32.2 | +1.2 | 17.6 | 18.4 | +0.8 |
| 25 to 44 years old | 32.5 | 34.1 | +1.6 | 18.5 | 19.4 | +0.9 |
| 45 to 54 years old | 32.7 | 34.3 | +1.6 | 19.8 | 21.2 | +1.4 |
| 55 years old and over | 31.2 | 32.9 | +1.7 | 21.1 | 22.7 | +1.7 |
| EI claimant category* | ||||||
| Long-tenured workers | 36.6 | 40.4 | +3.8 | 17.4 | 20.0 | +2.6 |
| Occasional claimants | 31.0 | 31.9 | +1.0 | 19.0 | 19.8 | +0.8 |
| Frequent claimants | 30.0 | 30.2 | +0.2 | 22.1 | 22.8 | +0.7 |
| Canada | 32.1 | 33.7 | +1.6 | 19.3 | 20.5 | +1.2 |
Note: Change in number of weeks is based on unrounded numbers. Includes all claims completed during the fiscal year for which at least $1 of EI regular benefits was paid.
*See Annex 2.1 for definitions of claimant categories referenced in this table.
rRevised data.
pPreliminary data.
Source: Employment and Social Development Canada, Employment Insurance (EI) administrative data. Data are based on a 10% sample of EI administrative data.
In terms of actual duration, completed claims for EI regular benefits by workers from the Mining, oil and gas extraction sector (24.3 weeks) and Finance and insurance (24.2 weeks) had the highest average durations during the reporting fiscal year (see Annex 2.6.2). As in past years, the Educational services industry (12.3 weeks) posted an actual average duration significantly lower than overall average. This is due to its seasonal nature and the relatively short and well-defined "off-season" over the summer months.
Proportion of Employment Insurance regular benefit weeks used
As for duration of EI regular benefits, a few factors may influence the proportion of the entitlement used by claimants. For instance, greater maximum durations are generally associated with lower proportions of regular benefits’ weeks used.
For claims completed in FY1617, the average proportion of weeks of regular benefits used—the average number of weeks of EI regular benefits received by claimants as a share of their maximum entitlement—went up by 0.4 percentage points from the previous fiscal year, to 63.5%.
Indeed, the proportion of weeks of regular benefits used by claims completed in the reporting fiscal year reached its highest level in years in Newfoundland and Labrador (76.0%), Saskatchewan (62.2%) and Yukon (69.9%). It also increased by 5.9 percentage points in Alberta (58.3%), four of the regions the most affected by the downturn in commodity prices (see Table 23).
The temporary measure providing additional weeks of EI regular benefits also led to a noticeable growth in the number of completed claims for EI regular benefits for which claimants could claim the maximum entitlement—45 weeks or more. During the reporting period, this number increased by 70.6% to 190,900—see Table 24. The proportion of EI regular benefit weeks used increased the most for claims associated with the highest entitlements (+6.7 percentage points).
By gender, women and men used the same proportion of their regular benefit weeks in FY1617 (63.5%). Historically, men used to receive slightly fewer weeks of regular benefits relative to their entitlement when compared to women. However, it is the third consecutive year that men either use about the same or a greater share of their entitlement relative to women.
By age group, claimants aged 55 years and older used a greater proportion of their regular benefit weeks (71.4% in the reporting fiscal year) than younger claimants (59.7%). This is notably attributable to, on average, longer periods of both unemployment and of actual benefits duration for older claimants relative to younger claimants.
Also, claimants working while on claim may have a stronger labour market attachment and may also defer weeks of EI benefits. As a result, on average, claimants working while on claim use a lower proportion of their weeks of EI benefits (60.9% during the reporting fiscal year) when compared to claimants who did not work while on claim (66.1%).
Regions with high unemployment rates are also often characterized by weaker labour market conditions. This is partly attributable to the greater importance of seasonal employment in these regions. There is thus a larger share of frequent EI claimants in regions with high unemployment rates relative to EI regions with lower unemployment rates. As frequent claimants tend to use a greater proportion of their entitlement, the proportion of regular benefit entitlement used is the highest for EI claims established in regions with unemployment rates above 13.0%.
| Proportion of weeks of Employment Insurance regular benefits used | |||||
|---|---|---|---|---|---|
| 2012/2013 | 2013/2014 | 2014/2015 | 2015/2016 | 2016/2017p | |
| Province or territory | |||||
| Newfoundland and Labrador | 66.1%r | 69.1%r | 70.8%r | 69.1% | 76.0% |
| Prince Edward Island | 68.5%r | 72.3%r | 71.6%r | 73.0% | 71.4% |
| Nova Scotia | 67.9%r | 70.3%r | 70.5%r | 72.1% | 71.8% |
| New Brunswick | 64.8%r | 66.0%r | 68.0%r | 69.4% | 70.4% |
| Quebec | 61.1%r | 62.7%r | 63.4%r | 63.9% | 62.9% |
| Ontario | 63.2%r | 62.7%r | 62.5%r | 61.8% | 61.7% |
| Manitoba | 61.5%r | 60.8%r | 60.2%r | 61.8% | 61.6% |
| Saskatchewan | 57.6%r | 57.6%r | 58.5%r | 54.0% | 62.2% |
| Alberta | 60.2%r | 57.6%r | 58.8%r | 52.4% | 58.3% |
| British Columbia | 65.3%r | 65.5%r | 64.6%r | 63.4% | 63.8% |
| Yukon | 54.2%r | 56.6%r | 66.2%r | 66.7% | 69.9% |
| Northwest Territories | 61.2%r | 62.5%r | 58.5%r | 73.8% | 64.0% |
| Nunavut | 65.9%r | 66.3%r | 76.1%r | 68.6% | 71.1% |
| Gender | |||||
| Men | 62.2% | 63.1% | 63.9% | 63.4% | 63.5% |
| Women | 63.9% | 64.1% | 63.6% | 62.6% | 63.5% |
| Age category | |||||
| 24 years old and under | 59.9% | 59.8% | 60.0% | 59.9% | 59.7% |
| 25 to 44 years old | 60.5% | 60.7% | 61.0% | 60.2% | 60.0% |
| 45 to 54 years old | 62.9% | 63.9% | 63.9% | 63.5% | 64.3% |
| 55 years old and over | 69.7% | 70.6% | 70.9% | 70.1% | 71.4% |
| EI claimant category* | |||||
| Long-tenured workers | 53.9% | 54.2% | 52.9% | 50.0% | 51.4% |
| Occasional claimants | 63.2% | 62.6% | 63.0% | 63.5% | 64.0% |
| Frequent claimants | 72.0% | 74.4% | 75.5% | 76.2% | 77.1% |
| Working while on claim status | |||||
| Not working while on claim | 66.8% | 66.8% | 67.0% | 66.0% | 66.1% |
| Working while on claim | 59.7% | 60.3% | 60.7% | 60.4% | 60.9% |
| Canada | 62.9%r | 63.5%r | 63.8%r | 63.1% | 63.5% |
Note: Includes all completed claims for which at least $1 of EI regular benefits was paid.
*See Annex 2.1 for definitions of claimant categories referenced in this table.
rRevised data.
pPreliminary data.
Source: Employment and Social Development Canada, Employment Insurance (EI) administrative data. Data are based on a 10% sample of EI administrative data.
| Completed claims for regular benefits | Proportion of entitlement used | |||||
|---|---|---|---|---|---|---|
| Number in 2015/2016 | Number in 2016/2017p | Change (%) | Proportion in 2015/2016 |
Proportion in 2016/2017p |
Change (ppts) | |
| Weeks of EI regular entitlement | ||||||
| Between 14 and 19 weeks | 115,330 | 118,510 | +2.8% | 82.5% | 82.5% | -0.1 |
| Between 20 and 24 weeks | 242,240 | 226,500 | -6.5% | 75.9% | 75.6% | -0.3 |
| Between 25 and 29 weeks | 223,240 | 223,890 | +0.3% | 65.5% | 65.7% | +0.2 |
| Between 30 and 34 weeks | 174,940 | 172,590 | -1.3% | 61.5% | 62.0% | +0.6 |
| Between 35 and 39 weeks | 269,140 | 272,560 | +1.3% | 57.4% | 57.2% | -0.2 |
| Between 40 and 44 weeks | 227,420 | 218,940 | -3.7% | 54.8% | 58.9% | +4.1 |
| 45 weeks or more | 111,920 | 190,910 | +70.6% | 43.8% | 50.5% | +6.7 |
| Unemployment rate in the economic region at the time the claim was established | ||||||
| 6.0% or less | 264,200 | 201,050 | -23.9% | 62.0% | 64.5% | +2.5 |
| Between 6.1% and 8.0% | 554,550 | 656,430 | +18.4% | 62.3% | 62.1% | -0.2 |
| Between 8.1% and 10.0% | 297,200 | 302,350 | +1.7% | 62.5% | 62.3% | -0.1 |
| Between 10.1% and 13.0% | 93,140 | 106,210 | +14.0% | 64.6% | 61.8% | -2.8 |
| 13.1% or more | 155,220 | 157,970 | +1.8% | 68.2% | 71.5% | +3.3 |
| Canada | 1,364,310r | 1,424,010 | +4.4% | 63.1% | 63.5% | +0.4 |
Note: Change in percentage change and in percentage points are based on unrounded numbers. Includes all completed claims for which at least $1 of regular benefits was paid.
rRevised data.
pPreliminary data.
Source: Employment and Social Development Canada, Employment Insurance (EI) administrative data. Data are based on a 10% sample of EI administrative data.
2.6 Exhaustion of Employment Insurance regular benefits
Claimants are said to have exhausted their entitlement when the number of weeks of benefits received (actual duration) equals the full entitlement available over the course of the benefit period. In some cases, the incidence of exhaustion of regular benefit entitlement can inform analysis related to the adequacy of the temporary income support that is provided to those looking for suitable employment following a job separation. Since a claim must be completedFootnote 51 to determine its status as exhausted or non-exhausted, the analysis in this section focuses on regular claims completed during the reporting fiscal year (FY1617), regardless of the claim’s establishment date.
Entitlement exhaustion of Employment Insurance regular benefits
Of all regular claims completed during the reporting fiscal year, 34.5% (or 491,300) closed with exhausted entitlement. As depicted in Chart 24, the volume of regular claims with exhausted entitlement increased between FY1516 and FY1617. This increase follows a decline posted in FY1516. The decrease observed in FY1516 was notably attributable to the extension of EI regular benefits in the 15 EI economic regions hardest hit by the downturn in commodity prices. The measure provided additional weeks of EI benefits to many EI regular claimants in these regions and extended their benefit period. In doing so, it extended their claim into FY1617 whereas they would have otherwise exhausted in FY1516. This shift contributed to the increase in the exhaustion rate observed during the reporting period. It has been estimated that in the absence of the temporary measure, the exhaustion rates would have been 33.3% for FY1516 and 34.2% in FY1617.

Text description of Chart 24
| 2009/2010 | 2010/2011 | 2011/2012 | 2012/2013 | 2013/2014 | 2014/2015 | 2015/2016 | 2016/2017 | |
|---|---|---|---|---|---|---|---|---|
| Entitlement exhausted claims in thousands (left scale) | 491.7r | 417.8r | 460.0r | 455.2r | 458.1r | 456.0r | 425.8r | 491.3p |
| Entitlement exhaustion rate (right scale) | 29.6%r | 26.0%r | 30.0%r | 31.8%r | 33.5%r | 33.3%r | 31.2%r | 34.5%p |
Note: Includes completed claims for which at least $1 of regular benefits was paid.
rRevised data.
pPreliminary data.
Source: Employment and Social Development Canada, Employment Insurance (EI) administrative data. Data are based on a 10% sample of EI administrative data.
The national entitlement exhaustion rate increased by 3.3 percentage points over the one recorded a year ago and reached its highest level in years. The exhaustion rate almost doubled in Saskatchewan (+18.6 percentage points—ppts) and in Alberta (+16.4 ppts)—see Table 25. It also posted significant increases in Newfoundland and Labrador (+16.8 ppts), Yukon (+12.9 ppts) and Nunavut (+12.8 ppts). Nunavut, Newfoundland and Labrador and Yukon presented the highest entitlement exhaustion rates during the reporting fiscal year (47.4%, 47.1% and 45.1% respectively).
By gender, claims established by women generally have a higher entitlement exhaustion rate (36.7% in FY1617) than those established by men (33.2%). This is due, in part, to fewer weeks of entitlement on average for women. Across age groups, claim exhaustion rates are fairly comparable. A notable exception is associated with claims established by claimants aged 55 years and over. These claimants tend to exhaust their entitlement more often which may be reflective of the challenges they face in securing new employment following a job loss.
| Entitlement exhaustion rate | |||
|---|---|---|---|
| 2015/2016r | 2016/2017p | Change (ppts) | |
| Province or territory | |||
| Newfoundland and Labrador * | 30.3% | 47.1% | +16.8 |
| Prince Edward Island | 39.3% | 36.8% | -2.5 |
| Nova Scotia | 39.0% | 40.6% | +1.6 |
| New Brunswick | 32.2% | 36.0% | +3.8 |
| Quebec | 32.8% | 32.0% | -0.8 |
| Ontario * | 32.0% | 33.3% | +1.3 |
| Manitoba * | 30.3% | 33.0% | +2.6 |
| Saskatchewan * | 19.0% | 37.6% | +18.6 |
| Alberta * | 17.5% | 33.9% | +16.4 |
| British Columbia * | 32.2% | 36.4% | +4.2 |
| Yukon * | 32.2% | 45.1% | +12.9 |
| Northwest Territories | 46.5% | 36.3% | -10.3 |
| Nunavut* | 34.5% | 47.4% | +12.8 |
| Gender | |||
| Men | 30.5% | 33.2% | +2.8 |
| Women | 32.4% | 36.7% | +4.3 |
| Age category | |||
| 24 years old and under | 28.9% | 32.1% | +3.2 |
| 25 to 44 years old | 28.7% | 30.9% | +2.2 |
| 45 to 54 years old | 30.4% | 34.4% | +4.0 |
| 55 years old and over | 38.2% | 43.0% | +4.8 |
| EI claimant category** | |||
| Long-tenured workers | 22.8% | 24.6% | +1.8 |
| Occasional claimants | 32.5% | 36.5% | +4.0 |
| Frequent claimants | 37.0% | 41.3% | +4.3 |
| Canada | 31.2% | 34.5% | +3.3 |
Note: Change in percentage points is based on unrounded numbers. Includes all completed claims for which at least $1 of regular benefits was paid.
*Provinces and territories associated with regions provided with additional weeks of EI regular benefits under the Budget Implementation Act, 2016, No.1. As claimants who started a claim for EI regular benefits on or after January 4, 2015 and were still unemployed were eligible to receive those additional weeks of EI benefits, even though they previously exhausted their entitlement or their benefit period, these extended benefits reduced the 2015/2016 exhaustion rates in those provinces and territories.
**See Annex 2.1 for definitions of claimant categories referenced in this table.
rRevised data.
pPreliminary data.
Source: Employment and Social Development Canada, Employment Insurance (EI) administrative data. Data are based on a 10% sample of EI administrative data.
Benefit period exhaustion vs entitlement exhaustion
In addition to entitlement exhaustion, claims may also end because their benefit period—the period during which an EI claimant may receive EI benefitsFootnote 52—closes before all potential regular benefit weeks’ of entitlement have been paid. Whenever this occurs, unless the claimant stopped filing EI biweekly reports,Footnote 53 the claim is considered to have exhausted its benefit period. These claims represented 17.5% of all completed regular claims in the reporting fiscal year.
The circumstances that result in benefit period exhaustion are generally different than those associated with entitlement exhaustion. Variables affecting the duration of an EI claim will influence benefit period exhaustion. These include the regular benefit entitlement, the weeks worked while on claim (leading to deferred benefit weeks) and the use of special benefits (adding another type of entitlement to the claim).
For instance, a much greater proportion of claims that exhausted the benefit period is associated with at least one week worked while on claim (70.7% in FY1617) compared with claims that ended because they exhausted their entitlement (37.4%)—see Table 26. Claims that exhaust the benefit period with Working While on Claim, have on average, a greater number of weeks worked while on claim (17.1 weeks during the reporting fiscal year) relative to claims that exhaust their entitlement (11.5 weeks). Claimants associated with benefit period exhaustion are thus more likely to accumulate enough hours of insurable employment during their benefit period to meet the eligibility requirements to establish a new claim following the end of their claim. As a result, a much greater proportion of claimants associated with claims that exhausted the benefit period requalify for a new claim within four weeks following the termination of their claim (69.6% in FY1617 compared with 13.7% for claims that exhausted their entitlement).
| Entitlement exhausted claims | Benefit period exhausted claims | |||
|---|---|---|---|---|
| 2015/2016 | 2016/2017p | 2015/2016 | 2016/2017p | |
| Exhaustion rate | 31.2%r | 34.5% | 22.7%r | 17.5% |
| Exhaustion rate by seasonality status | ||||
| Seasonal claimant | 24.9% r | 29.7% | 34.9%r | 28.3% |
| Non-seasonal claimant | 34.0%r | 36.5% | 17.3%r | 13.1% |
| Exhaustion rate by local unemployment rate at the time the claim was established | ||||
| 6.0% or less | 29.5% | 37.0% | 18.2% | 14.6% |
| 6.1% to 8.0% | 32.8% | 33.9% | 17.6% | 14.7% |
| 8.1% to 10.0% | 31.9% | 33.7% | 23.9% | 19.3% |
| 10.1% to 13.0% | 28.8% | 30.9% | 31.4% | 17.8% |
| 13.1% or above | 28.6% | 37.7% | 41.4% | 29.0% |
| Proportion of claims involving at least one week worked while on claim | 36.4% | 37.4% | 71.8% | 70.7% |
| Requalification rate for EI benefits | 10.2%r | 13.8% | 72.5% r | 69.7% |
| Average weeks worked while on claim* | 11.9 | 11.5 | 15.8 | 17.1 |
| Average weeks of regular benefits paid | 27.4 | 29.1 | 18.9 | 19.7 |
| Share of mixed claims (collected special benefits) | 10.5% | 9.8% | 15.8% | 17.9% |
| Average proportion of entitlement used | 100.0% | 100.0% | 56.7%r | 58.2% |
Note: Includes all completed claims for which at least $1 of regular benefits was paid.
rRevised data.
pPreliminary data.
*Includes only claims with at least one week worked while on claim.
Source: Employment and Social Development Canada, Employment Insurance (EI) administrative data. Data are based on a 10% sample of EI administrative data.
The type of exhaustion is also reflective of the characteristics of beneficiaries’ claim. Indeed, a greater share of claims that have exhausted their benefit period had some sort of interaction with special benefits (17.9%) compared with claims that exhausted their entitlement (9.8%). Claims that exhausted the benefit period were also paid fewer weeks of EI regular benefits (19.7 weeks in the reporting period) relative to claims that exhausted their entitlement (29.1 weeks).
Entitlement exhaustion of Employment Insurance regular benefits: seasonal claimants and seasonal gappers
Historically, entitlement exhaustion rates are lower for seasonal claims (29.7%)Footnote 54 than for non-seasonal claims (36.5%)—see Table 26. This is attributable to the fact that many seasonal employees are only temporarily laid off and are likely to find work in the same industry and potentially with the same employer during the next season.Footnote 55 Also, when a layoff is outside of seasonal cyclicality, for reasons such as the deterioration of local labour market conditions, it can result in longer periods on EI and a more difficult job search.
Some claimants who used all their weeks of entitlement may go through a period without any income (from either employment or EI benefits). This can notably occur to seasonal claimants. It is indeed possible that these claimants—known as seasonal gappers—have not accumulated sufficient hours of insurable employment during their qualifying period for their entitlement to cover the entire duration of their unemployment spell. Local labour markets and the seasonal nature of their work may also make finding work more difficult during their claim or from the end of the claim to the start of the season. Among all seasonal claims completed in the reporting fiscal year and which exhausted their entitlement close to 9,300 were characterised as a seasonal gapper. There are many other EI claimants experiencing an income gap between the exhaustion of their entitlements and their return to employment that are not included in the specific and relatively narrow definition of seasonal gappers used in this report.Footnote 56
A 2016 evaluationFootnote 57 examining Pilot Project 15—which extended EI regular benefits in 21 EI economic regions with high unemployment rates during a period of economic recovery to reduce the number of seasonal workers facing an income gap—found that it reduced both the probability of becoming a seasonal gapper and the duration of the period without income for seasonal gappers. However, seasonal gappers represented a very small proportion (4.6%) of all claimants benefiting from the extended weeks of benefits.
2.7 Working While on Claim provision
The Employment Insurance Act’s Working While on Claim (WWC) provision is intended to help claimants stay connected with the labour market by encouraging them to accept available work while receiving EI benefits and to earn additional income while on claim. Under the WWC provision, claimants may earn employment income up to a specified earnings threshold determined by the prevailing legislation or pilot project with either reduced or full EI benefits. Above this threshold, a claimant’s weekly EI benefit is reduced dollar-for-dollar. If the benefit is reduced to zero, the week of entitlement is deferred for later use within the claim’s benefit period.Footnote 58 During the reporting period (FY1617), the WWC provision applied to regular, fishing, parental, compassionate care and parents of critically ill children benefits.Footnote 59
Example: Employment Insurance benefits under Working While on Claim pilots
Nancy is unemployed and receives $350 in EI regular benefits on a weekly basis (55% of her average weekly insurable earnings of $636). She finds a part-time temporary job paying $300 per week while she continues to look for suitable permanent employment.
Under the default provisions of Pilot Project 20, for each dollar in employment income, she continues to receive 50 cents EI regular benefits, up to 90% of her average weekly insurable earnings ($572). Under these provisions, her total weekly income would be $500 ($300 in employment earnings and $200 in EI benefits).
Under the optional reversion provisions of Pilot Project 20 (rules of Pilot Project 17), she can earn the greater of $75 or 40% of her weekly benefit rate of $350 without any reduction in EI benefits. Under these provisions, her income would be $490 per week ($300 in employment earnings and $190 in EI benefits).
During the reporting fiscal year, the effective WWC provisions were associated with Pilot Project 19 (August 2, 2015 to August 6, 2016) and Pilot Project 20 (August 7, 2016 to August 11, 2018). Under these provisions, a claimant was able to keep 50 cents of EI benefits for every dollar earned while on claim, up to a maximum of 90% of the average weekly insurable earnings used to establish his or her weekly benefit rate, before benefits were reduced dollar-for-dollar.Footnote 60 Pilot Projects 19Footnote 61 and 20 also allowed claimants to elect to revert to the rules of Pilot Project 17 (no reduction in EI benefits up to the greater of 40% of their weekly benefits or $75 and dollar-for-dollar reduction thereafter).Footnote 62 Of all claims established in the reporting fiscal year, approximately 2,400 claims were subject to the Pilot Project 17 WWC provisions. Almost half of claimants who elected to revert were from Quebec (49.2%).Footnote 63
While the present section focuses on claimants that could be identified as earning employment income arising out of part-time or full-time work while on claim, it is worth noting that the working while on claim provisions are applicable to a broader range of earnings, such as pensions or severance pay.
Number of Employment Insurance regular claims and claimants Working While on ClaimFootnote 64
Methodological note: Differences in the shares of claimants and completed claims associated with Working While on Claim
The previous EI Monitoring and Assessment Report presented Working While on Claim (WWC) statistics using a claimant-based approach. It reported estimates of the number (or share) of claimants that worked at least one week while on claim during the fiscal year among all claimants with an active claim during that period, regardless of when these claims were established.
In the current report, both claim- and claimant-based statistics are presented. The claim-based statistics are associated with claims completed during the reporting fiscal year.
In general, claimant-based statistics differ from claim-based ones. Claimant-based statistics have the advantage of better aligning measured WWC activity with the labour market conditions observed during the associated fiscal year and the prevailing WWC provisions. Accordingly, the number of claimants WWC is higher than the number of claims WWC. This is because the claimant-based approach accounts for all claimants that had an active claim during the reporting fiscal year while the claim-based methodology limits the analysis to claims that were completed during the reporting fiscal year.
Conversely, the claim-based approach provides a better estimate of the relative incidence of WWC. This is because it looks at the incidence of WWC during the claim’s life and not only during a specific period (such as during the reporting fiscal year). As claims are often active over more than one fiscal year and because WWC activity may occur over a short period of time during a given fiscal year, claimants who did not work while on claim during the reporting fiscal year will not be considered as WWC according to the claimant-based statistics. As a result, the claimant-based methodology considers some claimants, who have actually worked while on claim, as not having done so.
As a result, levels of WWC activity are usually higher according to the claimant-based approach. Conversely, the proportion of claims or claimants WWC is usually higher according to the claim-based approach. Consequently claim-based statistics presented in this year’s report should be preferred when information on the relative frequency of WWC is sought.
Of all claimants with an active claimFootnote 65 in FY1617, 817,000 (or 43.1%) worked at least one week while on claim during the reporting period (see Table 27). This proportion is lower relative to the one associated with completed claims in the reporting fiscal year with at least one week worked while on claim (49.7%). This divergence is attributable to differences in the two measures.
| Claimants with an active claim during the fiscal year who have worked at least one week while on claim during the fiscal year |
Completed claims with at least one week worked while on claim over the claim’s life | |||
|---|---|---|---|---|
| Number | Share (%) | Numberp | Share (%)p | |
| Region | ||||
| Newfoundland and Labrador | 47,040 | 54.5% | 34,830 | 59.8% |
| Prince Edward Island | 9,690 | 47.8% | 8,970 | 52.3% |
| Nova Scotia | 38,460 | 48.2% | 34,300 | 54.3% |
| New Brunswick | 48,180 | 54.8% | 44,740 | 60.0% |
| Quebec | 271,580 | 51.1% | 246,390 | 57.3% |
| Ontario | 185,460 | 35.9% | 163,170 | 41.9% |
| Manitoba | 20,030 | 36.1% | 17,940 | 43.2% |
| Saskatchewan | 20,400 | 35.2% | 15,480 | 43.2% |
| Alberta | 91,160 | 36.5% | 73,950 | 43.9% |
| British Columbia | 77,940 | 40.5% | 66,380 | 47.0% |
| Territories | 2,100 | 33.8% | 1,760 | 39.8% |
| Gender | ||||
| Men | 499,210 | 42.1% | 439,380 | 48.8% |
| Women | 317,830 | 44.6% | 268,530 | 51.3% |
| Age category | ||||
| 24 years old and under | 77,420 | 41.3% | 73,210 | 50.3% |
| 25 to 44 years old | 384,430 | 45.3% | 334,160 | 52.3% |
| 45 to 54 years old | 211,150 | 49.4% | 182,940 | 56.7% |
| 55 years old and over | 144,040 | 33.3% | 117,600 | 37.1% |
| Seasonality | ||||
| Seasonal* | n/a | n/a | 237,030 | 57.8% |
| Non-seasonal | n/a | n/a | 470,880 | 46.4% |
| Canada | 817,040 | 43.1% | 707,910 | 49.7% |
Note: Includes all claimants (or claims) to which at least $1 of regular benefits was paid.
*See Annex 2.1 for definitions of seasonal claims referenced in this table.
pPreliminary data.
Source: Employment Social Development Canada, Employment Insurance (EI) administrative data. Data are based on a 10% sample of EI administrative data.
The proportion of regular claimants (or completed claims) with at least one week worked while on claim varies across regions and industries. This is likely a reflection of the claimants’ local labour market conditions. Greater shares of EI regular claimants WWC correlates with regions—Atlantic provinces (52.3% in FY1617) and Quebec (51.1%)—and with industries—Educational services (55.8%) and Construction (49.7%)—that have a higher proportion of seasonal claimants. This is possibly due to the greater re-employment opportunities should the benefit period of the claimants exceed the length of the “off-season”.
Weeks worked while on claim
This section analyzes the WWC provision from the perspective of weeks worked while on claim. It focuses on EI regular weeks. It examines whether or not employment income was reported during a week in which a claimant was entitled to receive EI regular benefits during the fiscal year, regardless of when the claim was established.
The proportion of weeks of EI regular benefits worked while on claim increased for the first time in five years to 23.2% during the reporting fiscal year (see Chart 25). The average number of weeks worked while on claim has been on a downward trend. It reached 11.2 weeks for claims completed in FY1617, down from the peak of 13.9 weeks five years earlier. Of those weeks worked while on claim, a little more than half (6.0 weeks on average) were deferred.

Text description of Chart 25
| 2009/2010 | 2010/2011 | 2011/2012 | 2012/2013 | 2013/2014 | 2014/2015 | 2015/2016 | 2016/2017 | |
|---|---|---|---|---|---|---|---|---|
| Share of all EI regular weeks worked while on claim (right scale) | 24.8% | 26.2% | 27.4% | 26.6% | 25.0% | 24.2% | 22.9% | 23.2% |
| Average number of weeks worked while on claim per claim (left scale) | 12.9 | 12.8 | 13.9 | 11.9 | 11.6 | 11.3 | 11.5 | 11.2 |
Note: Includes all claims for which at least $1 of regular benefits was paid.
rRevised data.
pPreliminary data.
*Coincides with the Employment Insurance (EI) temporary measures that increased the maximum number of weeks for which regular benefits could be paid.
**Based on claims completed during the fiscal year.
Source: Employment and Social Development Canada, Employment Insurance (EI) administrative data. ESDC data are based on a 10% sample of EI administrative data.
The declines in the proportion of and the average number of weeks worked while on claim over the past years are partly attributable to changes in the WWC pilot projects and labour market conditions. The lower share of seasonal claimants among EI regular claimants (see subsection 2.2.8 Employment Insurance regular benefits and seasonal claimants) also contributed to the decreases. The higher proportion of EI regular claimants based in Western provinces, who have historically been less likely to work while on claim, also partly explains these declining trends.
An analysis by demographic characteristics shows that a greater proportion of seasonal claimants, women, claimants between 45 years old and 54 years old and those living in Atlantic Canada or Quebec generally were WWC (see Table 27). The proportion of weeks worked while on claim is also usually higher for these claimants. However, over time, the share of weeks worked while on claim has trended down in most regions and demographic groups (see Table 28).
| 2012/2013 | 2013/2014 | 2014/2015 | 2015/2016 | 2016/2017 | |
|---|---|---|---|---|---|
| Region | |||||
| Newfoundland and Labrador | 30.7% | 28.2% | 27.0% | 25.8% | 27.4% |
| Prince Edward Island | 30.3% | 27.9% | 25.9% | 25.1% | 26.0% |
| Nova Scotia | 31.0% | 29.4% | 27.8% | 26.7% | 26.7% |
| New Brunswick | 34.6% | 33.3% | 32.4% | 31.2% | 31.7% |
| Quebec | 33.6% | 32.2% | 31.2% | 31.2% | 32.5% |
| Ontario | 19.5% | 18.0% | 17.7% | 17.1% | 17.1% |
| Manitoba | 14.5% | 14.1% | 12.7% | 12.1% | 12.4% |
| Saskatchewan | 15.1% | 13.5% | 12.9% | 12.6% | 13.3% |
| Alberta | 15.2% | 13.8% | 11.8% | 10.7% | 13.5% |
| British Columbia | 22.2% | 20.5% | 19.9% | 18.7% | 19.4% |
| Territories | 13.0% | 11.1% | 11.1% | 12.5% | 11.4% |
| Gender | |||||
| Men | 25.4% | 23.7% | 23.1% | 21.5% | 22.0% |
| Women | 28.6% | 27.0% | 26.1% | 25.6% | 25.4% |
| Age category | |||||
| 24 years old and under | 24.1% | 22.9% | 22.7% | 21.1% | 21.4% |
| 25 to 44 years old | 27.2% | 25.6% | 25.0% | 23.7% | 24.3% |
| 45 to 54 years old | 32.1% | 30.6% | 29.5% | 28.2% | 28.3% |
| 55 years old and over | 20.3% | 18.4% | 17.7% | 16.9% | 17.0% |
| Seasonality** | |||||
| Seasonal | 34.2% | 32.9% | 32.1% | 31.1% | 31.7% |
| Non-seasonal | 23.3% | 21.3% | 20.5% | 19.4% | 19.8% |
| Canada | 26.6% | 25.0% | 24.2% | 22.9% | 23.2% |
Note: Includes all claims for which at least $1 of regular benefits was paid.
*Data are based on the weeks worked while on claim during the specified period, regardless of when the claim was established.
**See Annex 2.1 for definitions of seasonal claims referenced in this table.
Source: Employment and Social Development Canada, Employment Insurance (EI) administrative data. Data are based on a 10% sample of EI administrative data.
Adjustments to WWC pilot projects over the years, combined with shifting economic conditions, have likely contributed to changing patterns in weeks worked while on claim. Under prior WWC provisions, EI benefits were not reduced below a certain threshold (25% of the claimant’s weekly benefits or $50 under the legislation and 40% of the claimant’s weekly benefits or $75 under Pilot Projects 12 and 17). However, they were reduced dollar-for-dollar thereafter and provided little incentive for EI claimants to work additional hours. Conversely, under the provisions of pilots in effect during the reporting fiscal year—Pilot Projects 19 and 20Footnote 66—a claimant’s total income (from EI benefits and employment earnings) increases with hours worked, until it reaches 90% of their weekly insurable earnings, strengthening labour market attachment.
As a result, the provisions of the most recent pilots in effect have likely smoothed the distribution of hours worked by EI claimants relative to the provision of previous pilot projects or the legislation, and increased work intensity (see Chart 26).Footnote 67

Text description of Chart 26
| Weekly earnings as a share of weekly EI regular benefits | Legislation (April 2004 to November 2005) | Pilot Projects 12 and 17 (December 2008 to July 2012) | Pilot projects 18, 19 and 20 (August 2012 to March 2017) |
|---|---|---|---|
| 0%-10% | 2.1% | 3.0% | 2.5% |
| 11%-20% | 6.0% | 5.3% | 3.9% |
| 21%-30% | 12.1% | 8.4% | 5.4% |
| 31%-40% | 7.2% | 14.7% | 6.5% |
| 41%-50% | 5.1% | 6.5% | 4.8% |
| 51%-60% | 4.1% | 4.2% | 4.3% |
| 61%-70% | 4.1% | 3.8% | 4.4% |
| 71%-80% | 4.0% | 3.7% | 4.5% |
| 81%-90% | 4.0% | 3.6% | 4.4% |
| 91%-100% | 4.0% | 3.6% | 4.6% |
| 101%-110% | 4.1% | 3.7% | 4.8% |
| 111%-120% | 4.0% | 3.9% | 5.1% |
| 121%-130% | 4.6% | 4.1% | 5.4% |
| 131%-140% | 5.0% | 4.6% | 6.1% |
| 141%-150% | 5.7% | 5.2% | 6.7% |
| 151%-160% | 6.7% | 5.8% | 7.5% |
| 161%-170% | 7.7% | 7.0% | 8.5% |
| 171%-180% | 9.6% | 9.0% | 10.5% |
| Estimated Weekly Days of Work | |||
| Between 1/2 a day and a day | 25% allowable earnings threshold (legislation) | 40% allowable earnings threshold (Pilots 12 and 17) | |
| Between 1-2 days | |||
| Between 2-3 days | |||
| About 3 days or more | No longer receiving benefits; deferred week (legislation) | No longer receiving benefits; deferred week (Pilots 12 and 17) | No longer receiving benefits; deferred week (50% from first $1) (Pilots 18 and 19) |
*Data are based on the weeks worked while on claim during the specified period, regardless of when the claim was established.
**Excludes weeks worked while on claim with missing data, claims with weekly earnings as a share of weekly EI regular benefits above 180% and claims that reverted to Pilot Project 17.
***Days worked are estimated by calculating the proportion of their full-time wage worked and converting it to days. For example, if a claimant worked for 20% of his/her benefit rate, recalling that the benefit rate is 55% of the full-time wage, then the claimant is working 11% (20% x 55%) of his/her full-time wage, or approximately 1/2 day (11%x 5 days). This assumes that working claimants are earning approximately the same hourly wage as in their preivous employment with which they qualified for benefits, that they had been working full time prior to establishing a claim and that they had earned the maximum insurable earnings or below.
Source: Employment and Social Development Canada, Employment Insurance (EI) administrative data. ESDC data are based on a 10% sample of EI administrative data.
This increase in work intensity since the implementation of WWC Pilot Project 18 is also reflected in the average weekly income—weekly EI regular benefits and employment earnings—of EI regular claimants WWC. Table 29 shows that the difference between the total weekly income of claimants WWC and those not WWC is higher since the provisions of Pilot Project 18 came into force in August 2012. This increase is primarily attributable to higher real average weekly employment earnings during weeks worked while on claim under the provisions of Pilot Projects 18, 19 and 20 ($584 during the reporting period)Footnote 68. Table 29 also shows that while claimants working while on claim had, over the course of the entire claim, a higher average total weekly income than those who did not work while on claim, they received on average less EI benefits ($248 per week against $329 for those not working while on claim).Footnote 69
| 2010/2011 | 2011/2012 | 2012/2013 | 2013/2014 | 2014/2015 | 2015/2016 | 2016/2017 | |
|---|---|---|---|---|---|---|---|
| Pilot 12 | Pilots 12 and 17 | Pilots 12, 17 and 18 | Pilots 17 and 18 | Pilot 18 | Pilots 18 and 19 | Pilots 18, 19 and 20 | |
| Claims without Working While on Claim | |||||||
| Average real weekly income (EI regular benefits only) | $298 | $298 | $302 | $311 | $320 | $327 | $329 |
| Claims with Working While on Claim (all weeks**) | |||||||
| Average real weekly EI regular benefits | $229 | $225 | $224 | $227 | $234 | $243 | $248 |
| Average real weekly employment earnings | $198 | $209 | $228 | $234 | $236 | $232 | $229 |
| Average real weekly income (EI regular benefits and employment earnings) | $427 | $434 | $452 | $461 | $470 | $475 | $478 |
| Difference in real average weekly income between claims with WWC and claims without WWC | |||||||
| Difference | +$129 | +$136 | +$150 | +$150 | +$150 | +$149 | +$148 |
| Employment earnings during weeks worked only*** | |||||||
| Average real weekly employment earnings | $487 | $491 | $511 | $559 | $573 | $585 | $584 |
Note: Based on claims that were terminated or were dormant and remained inactive as of August the following fiscal year, no matter when they were established.
*Earnings and EI benefits are adjusted in real 2002 dollars using the All Items Consumer Price Index.
**Claims working while on claim in this report includes claims with deferred weeks of EI benefits (that have thus $0 of EI benefits paid and high amount of employment earnings). The figures presented are the sum of all regular benefits and/or employment earnings divided by the number of weeks the claim was active. As a consequence, when compared with statistics presented in the FY1516 report, which did not consider claims with deferred weeks, the average real weekly EI benefits paid are lower and the average real weekly employment earnings are higher.
***The average real weekly employment earnings are total employment earnings divided by the number of weeks worked while on claim.
Sources: Employment and Social Development Canada, Employment Insurance (EI) administrative data (for data on claims with WWC) and Statistics Canada, CANSIM table 326-0020 (for data on the consumer price index). Data are based on a 10% sample of EI administrative data
Factors associated with Working While on Claim
A 2015 study* looking at claimants who only received EI regular benefits and worked while on claim in 2010 found that the longer the duration of a claim, the more likely the claimant was to work while on claim and to work for more than one employer. Specifically, for claims lasting 14 weeks or less, 48% worked while on claim and 14% worked for more than one employer. Those claims lasting 45 weeks or more had 67% of claimants Working While on Claim (WWC), with 30% working for more than one employer. The number of weeks worked as well as the number of “full-time” weeks (defined as a claimant having their benefits reduced to zero and therefore deferring the week) also increased with the duration of the claim. Also, 74% of these claimants who only received EI regular benefits and worked while on claim did so for a single employer. The average working claimant worked over a period of approximately 12.5 weeks.
According to this study, 79% of working claimants had worked for the same employer previous to their claim. Also, following the termination of their claim, 82% stayed with the same employer they worked for on claim. In total, 95% of working claimants worked at least one week for the same employer before or after their claim. A subset of these claimants worked both before and after the claim, which made up 65% of working claimants. While not put forward by the study itself, these statistics could suggest that many claimants are being laid-off during a temporary work-shortage, with the possibility of returning intermittently during their EI claim as required, and returning full-time when the work-shortage subsides. This could explain the high correlation of WWC with seasonal industries and claims which produce and follow work-shortage trends.
*ESDC, Who are Workers Working for When Working While on Claim? (Ottawa: ESDC, Evaluation Directorate, 2016).
2.8 Employment Insurance regular benefits and seasonal claimants
EI claimants who established at least three regular or fishing claims in the previous five years from the reference year, with at least two of these claims having started during the same period of the year as the current claim, are referred to as seasonal claimants.Footnote 70 By definition, seasonal claimants overlap with the frequent, occasional and long-tenured claimant categories.Footnote 71
The total number of seasonal claims in FY1617 was 408,400, down from 452,400 claims in FY1516. This represents a decline of 44,000 (-9.7%) claims in FY1617 compared to the previous fiscal year. Among these seasonal claims, 380,700 claims (93.2%) were EI regular claims and the remaining 27,700 claims (6.8%) were for EI fishing benefits. The analysis presented in the following subsections is focused on seasonal regular claims.Footnote 72
The share of seasonal regular claims among all regular claims was 28.8% in FY1617, representing a decline for the third consecutive year, and below the 10 year average of 29.1% (see Chart 27). The declining share of seasonal claims can be attributed to the increase in the share of non-seasonal regular claims associated with the persisting downturn in commodity prices, combined with the forest fires in Alberta (see Chapter 1 for detailed discussion). This is because non-seasonal regular claims are generally more responsive to business cycle fluctuations than seasonal regular claims.

Text description of Chart 27
| 2002/2003 | 2003/2004 | 2004/2005 | 2005/2006 | 2006/2007 | 2007/2008 | 2008/2009 | 2009/2010 | 2010/2011 | 2011/2012 | 2012/2013 | 2013/2014 | 2014/2015 | 2015/2016 | 2016/2017 | ||
|---|---|---|---|---|---|---|---|---|---|---|---|---|---|---|---|---|
| In percent | Seasonal claims as a share of regular claims (left scale) | 28.7% | 26.7% | 27.9% | 27.5% | 29.1% | 30.4% | 30.7% | 25.8% | 27.3% | 29.0% | 30.9% | 31.9% | 31.3% | 29.7% | 28.8% |
| In thousands | New seasonal regular claims established (right scale) | 397.9 | 410.4 | 406.0 | 410.0 | 408.5 | 395.2 | 412.7 | 417.4 | 381.8 | 412.2 | 419.9 | 422.4 | 419.7 | 425.7 | 380.7 |
Note: Includes claims for which at least $1 of regular benefits was paid.
*See Annex 2.1 for definitions of seasonal claims references in this chart.
Source: Employment and Social Development Canada, Employment Insurance (EI) administrative data. Data are based on a 10% sample of EI administrative data.
Table 30 outlines the number of regular claims and the number of seasonal regular claims, along with the share of seasonal regular claims as a percentage of total regular claims by province and territory, gender, age category and industry in FY1617. It can be seen that the share of seasonal regular claims is highest in the Atlantic provinces, especially in Prince Edward Island (49.9%) and New Brunswick (47.9%). In Quebec, the likelihood of an EI regular claim being established by a seasonal claimant was also fairly high (38.5%). This share is much lower in the Western provinces and the Territories.
| Regular claims (number) |
Seasonal regular claims (number) |
Seasonal regular claims as a % of regular claims |
|
|---|---|---|---|
| Region | |||
| Newfoundland and Labrador | 55,590 | 17,130 | 30.8% |
| Prince Edward Island | 16,910 | 8,430 | 49.9% |
| Nova Scotia | 62,610 | 24,630 | 39.3% |
| New Brunswick | 70,120 | 33,620 | 47.9% |
| Quebec | 405,460 | 156,020 | 38.5% |
| Ontario | 366,810 | 92,340 | 25.2% |
| Manitoba | 39,310 | 9,970 | 25.4% |
| Saskatchewan | 34,090 | 4,800 | 14.1% |
| Alberta | 141,140 | 8,650 | 6.1% |
| British Columbia | 124,830 | 24,410 | 19.6% |
| Territories | 4,260 | 680 | 16.0% |
| Gender | |||
| Men | 806,660 | 232,770 | 28.9% |
| Women | 514,470 | 147,910 | 28.7% |
| Age category | |||
| 24 years old and under | 126,880 | 8,130 | 6.4% |
| 25 to 44 years old | 588,420 | 142,730 | 24.3% |
| 45 to 54 years old | 298,500 | 103,330 | 34.6% |
| 55 years old and over | 307,330 | 126,490 | 41.2% |
| Industry | |||
| Goods-producing industries | 484,720 | 159,220 | 32.8% |
| Services-producing industries | 762,630 | 207,540 | 27.2% |
| Unclassified | 73,780 | 13,920 | 18.9% |
| Canada | 1,321,130 | 380,680 | 28.8% |
*Includes claims for which at least $1 of regular benefits was paid.
**Seasonal regular claims are those claims, for which at least $1 of regular benefits was paid, by claimants who have established at least three regular or fishing claims in the last five years, two of which had to have started during the same period of year as the current claim. This period is defined as the 8 weeks before and 8 weeks after the current claim commenced, for a total window of 17 weeks.
Source: Employment and Social Development Canada, Employment Insurance (EI) administrative data. Data are based on a 10% sample of EI administrative data
The share of seasonal regular claims is similar for men and women. In terms of age groups, the largest share is observed for claimants aged 55 years and over (41.2%), followed by those in the 45 to 54 age group (34.6%). The share of seasonal regular claims is noticeably low for younger claimants aged 24 years and under (6.4%). This is partly because although a greater proportion of younger individuals work in seasonal jobs relative to other age groups, they are more likely to quit jobs to return to school—which is an invalid reason for separation and does not qualify to receive EI benefits (see subsection 2.2 for detailed discussion on coverage, eligibility and access).
Seasonal workers in the Labour Force Survey
Every month, Statistics Canada provides information on employment, unemployment and other key labour market indicators by a variety of demographic characteristics through the Labour Force Survey (LFS). The LFS defines seasonal workers as those whose employment is in an industry where employment levels rise and fall with the seasons. This is different from the definition used for EI claim purposes, which is not related to a claimant’s industry of employment, and instead is based on the claimant’s recent history of EI regular or fishing benefits use.
According to the LFS, there were 440,000 seasonal workers in FY1617,* increasing 1.3% from FY1516. Seasonal workers represented 2.9% of all employees and 21.5% of all temporary workers in FY1617, showing no change in shares from the previous fiscal year. These rates are slightly below the average share of seasonal workers among all employees (3.0%), and the average share of seasonal workers among all temporary employees (22.5%) over the last 10 years.
Historically, men aged between 15 and 24 years are more likely to work in seasonal jobs (which is mostly attributable to summer employment patterns for students). According to the LFS, men represented 63.0% of all seasonal employees in FY1617. Workers who were 15 to 24 years old represented 40.5% of all seasonal employees in FY1617.
* Statistics Canada, Labour Force Survey, CANSIM table 282-0079.
In terms of industry sectors, the share of seasonal regular claims is higher in the goods-producing industries (32.8%) than in the services-producing industries (27.2%). As outlined in Table 30, the high frequency of seasonal claimants in the Atlantic provinces may be attributed to the composition of its industries, which contains a larger share of goods-producing industries, leading to a much higher proportion of seasonal employment in this sector (16.6% in FY1617) relative to the rest of the country (4.0% in FY1617). Chart 28 shows the distribution of regular seasonal and non-seasonal claims in FY1617. It can be seen that the share of seasonal claims in the Atlantic provinces and Quebec is higher than the share of non-seasonal claims, whereas in Ontario, the Western provinces and the Territories, the share of non-seasonal claims is higher than the share of seasonal claims. The Atlantic provinces and Quebec, respectively, accounted for 22.0% and 41.0% of all seasonal regular claims in FY1617, compared to, respectively, 12.9% and 26.5% of all non-seasonal regular claims established.
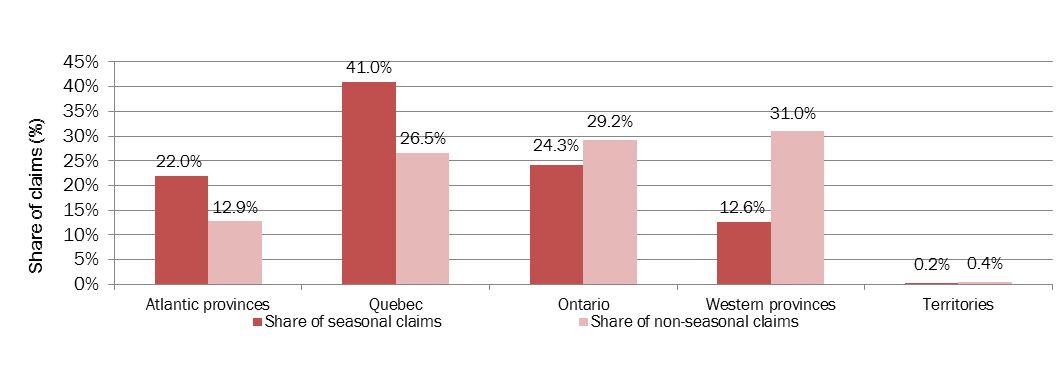
Text description of Chart 28
| Region | Share of seasonal claims (%) | Share of non-seasonal claims (%) |
|---|---|---|
| Atlantic provinces | 22.0% | 12.9% |
| Quebec | 41.0% | 26.5% |
| Ontario | 24.3% | 29.2% |
| Western provinces | 12.6% | 31.0% |
| Territories | 0.2% | 0.4% |
Note: Includes all claims for which at least $1 of regular benefits was paid.
*See Annex 2.1 for definitions of seasonal claims referenced in this chart.
Source: Employment and Social Development Canada, Employment Insurance (EI) administrative data. Data are based on a 10% sample of EI administrative data.
Table 31 outlines the distribution of EI seasonal regular claims established by quarter during the FY1617. It can be seen that close to half (45.5%) of all seasonal regular claims were established in the third quarter (October to December) of the fiscal year, as production slows down in many seasonal industries during that quarter. Some variations are also notable across industries and gender. For example, while seasonal regular claims established by men and workers in the goods-producing industries tend to be concentrated in the third quarter of the fiscal year (58.3% and 60.4%, respectively), those established by women and workers in the services-producing industries are more concentrated in the second quarter (July to September) of the fiscal year (45.1% and 35.7%, respectively). This is likely related to the summer “off-season” in the Educational services industry, reflecting the closure of elementary and high schools during that period of the year.
| Total seasonal regular claims | Distribution of seasonal regular claims by quarter (%) | ||||
|---|---|---|---|---|---|
| Q1 (April to June) |
Q2 (July to September) |
Q3 (October to December) |
Q4 (January to March) |
||
| Region | |||||
| Atlantic provinces | 83,810 | 18.3% | 18.8% | 45.5% | 17.5% |
| Quebec | 156,020 | 13.9% | 20.0% | 53.3% | 12.7% |
| Ontario | 92,340 | 12.6% | 35.5% | 38.7% | 13.1% |
| Western provinces | 47,830 | 20.4% | 36.5% | 33.0% | 10.2% |
| Territories | 680 | 14.7% | 11.8% | 63.2% | 10.3% |
| Gender | |||||
| Men | 232,770 | 10.9% | 13.2% | 58.3% | 17.7% |
| Women | 147,910 | 22.5% | 45.1% | 25.3% | 7.1% |
| Industry | |||||
| Goods-producing industries | 159,220 | 8.1% | 13.6% | 60.4% | 17.9% |
| Services-producing industries | 207,540 | 21.4% | 35.7% | 33.2% | 9.7% |
| Unclassified | 13,920 | 9.8% | 12.6% | 57.3% | 20.3% |
| Canada | 380,680 | 15.4% | 25.6% | 45.5% | 13.5% |
Note: Includes claims for which at least $1 of EI regular benefits was paid.
*See Annex 2.1 for definitions of seasonal claims referenced in this table.
Source: Employment and Social Development Canada, Employment Insurance (EI) administrative data. Data are based on a 10% sample of EI administrative data.
Eligibility for Employment Insurance regular benefits among seasonal claimants
The annually published Employment Insurance Coverage Survey (EICS) by Statistics Canada for 2016 shows that the eligibility rate for regular benefits among temporary seasonal workers was higher than that for temporary non-seasonal workers,Footnote 73 but lower than that for permanent full-time workers. In 2016, 87.5% of unemployed seasonal workers who had paid EI premiums and had a valid job separation (that is, were laid off or quit with just cause) were eligible for regular benefits, compared to 66.4% of other temporary non-seasonal workers who were eligible. This eligibility rate for unemployed seasonal workers in 2016 was higher than their eligibility rate in the previous year (82.6%).
Duration of Employment Insurance regular benefits among seasonal claimants
The average maximum durationFootnote 74 of seasonal regular claims completed in FY1617 was 29.9 weeks, decreasing by 1.3 weeks from the previous year (31.2 weeks). The average maximum duration of completed non-seasonal regular claims was 34.3 weeks in FY1617 and 35.2 weeks in FY1516.
Methodological note:
Starting in FY1617, the average maximum duration and the average actual duration of seasonal claims are estimated based on completed claims, whereas previously they were calculated based on total claims established during the fiscal year. Completed claims include those that are terminated and those that are dormant and remained inactive as of August the following fiscal year. Statistics for the fiscal year analyzed in this report are preliminary and will be revised in the next report.
The average actual durationFootnote 75 of EI regular benefits for seasonal claims completed in FY1617 was 18.6 weeks, compared to 17.9 weeks in the previous fiscal year. For non-seasonal regular claimants, the average actual duration was 21.2 weeks for claims completed in FY1617 and 19.9 weeks in FY1516. Both the average maximum duration and the average actual duration of regular benefits are generally shorter among seasonal regular claimants than for non-seasonal regular claimants, reflecting the fact that the seasonal claimants generally accumulate fewer hours of insurable employment prior to establishing a claim than the non-seasonal claimants.
Overlapping definitions of seasonal and frequent claimants: internal analysis
Frequent claimants refer to those who have had three or more EI regular or fishing claims and have collected benefits for a total of more than 60 weeks in the past five years. On the other hand, seasonal claimants are defined as those who established three or more regular or fishing claims in the five fiscal years preceding the reference year of which at least two were established at the same time of year as their claim in the reference year. By definition, there is a significant overlap between frequent and seasonal claimants.
While both seasonal and frequent claimants must have established three or more claims in the past five years, they differ on two criteria: 1) frequent claimants have received a total of more than 60 weeks on EI regular or fishing benefits, while seasonal claimants do not need to receive EI benefits for a set number of weeks; and 2) the timing of establishing claims determines a claimant’s status as seasonal, while there is no such requirement for defining frequent claimants.
As outlined in Table 32, it can be seen that a greater number of EI regular claimants qualify as seasonal claimants relative to frequent claimants (380,680 seasonal claims compared to 285,690 frequent claims in FY1617). This suggests many seasonal regular claimants collect less than 60 weeks of regular benefits over a five-year period. At the same time, a large proportion of frequent claimants can be considered to be seasonal claimants as shown in Chart 29.
| 2010/2011 | 2011/2012 | 2012/2013 | 2013/2014 | 2014/2015 | 2015/2016 | 2016/2017 | |
|---|---|---|---|---|---|---|---|
| Frequent | 309,230 | 321,040 | 319,580 | 309,780 | 304,700 | 307,790 | 285,690 |
| Seasonal | 381,810 | 412,230 | 419,930 | 422,410 | 419,720 | 425,690 | 380,680 |
*See Annex 2.1 for definitions of frequent and seasonal claims referenced in this table.
Source: Employment and Social Development Canada, Employment Insurance (EI) administrative data. Data are based on a 10% sample of EI administrative data.

Text description of Chart 29
| Frequent, non-seasonal | Frequent and seasonal | Non-frequent, seasonal | |
|---|---|---|---|
| Level of claims | 56,800 | 228,900 | 151,800 |
| Share of total frequent and seasonal claims | 13.0% | 52.3% | 34.7% |
*See Annex 2.1 for definitions of frequent and seasonal claims referenced in this chart
Source: Employment and Social Development Canada, Employment Insurance (EI) administrative data. Data are based on a 10% sample of EI administrative data.
Table 33 shows the comparison among EI regular claims completed in FY1617 among frequent seasonal, frequent non-seasonal and non-frequent seasonal claimants . There is not much difference between the frequent seasonal and frequent non-seasonal claimants in the average duration and the proportion of regular benefits paid. However, between the two non-overlapping populations, it can been seen that the non-seasonal frequent claimants had much longer average duration of regular benefits, used a greater proportion of regular weeks of benefits, and were more likely to exhaust their regular entitlement relative to the non-frequent seasonal claimants.
| Average duration of EI regular benefits (in weeks)p | Proportion of regular benefits paid p | Exhaustion rate p | |
|---|---|---|---|
| Frequent non-seasonal claims | 22.9 | 76.4% | 46.3% |
| Frequent and seasonal claims | 22.7 | 77.2% | 40.4% |
| Non-frequent seasonal claims | 12.2 | 41.2% | 12.8% |
Note: Completed claims include those that are terminated and those that are dormant and remained inactive as of August the following fiscal year.
*See Annex 2.1 for definitions of frequent and seasonal claims referenced in this table.
pPreliminary data.
Source: Employment and Social Development Canada, Employment Insurance (EI) administrative data. Data are based on a 10% sample of EI administrative data.
Page details
- Date modified: