
Archived - Report on Federal Tax Expenditures - Concepts, Estimates and Evaluations 2017: part 10
In Canada, as in many other countries, consumption taxes are an important source of government revenue. In 1991, the Government of Canada adopted the Goods and Services Tax (GST). The GST applies to the sale price of a wide range of goods and services consumed by households, such as telephone services, clothing, automobiles and new homes. The wide range of goods and services subject to the GST allows for a relatively low rate and facilitates administration for businesses and the Government.
To ensure fairness, the GST Credit was implemented at the same time the GST was introduced in order to reduce the fiscal burden of this tax on low- or modest-income Canadians and thus counter the generally regressive features of consumption taxes. This paper presents an evaluation of the GST Credit.[2] It begins with an overview of the history of the credit and of its main rules. It also discusses federal GST revenues and amounts paid under the GST Credit. It then presents an evaluation of the GST Credit in terms of its relevance, effectiveness, equity and efficiency, including the merit of alternative measures.
The main results of the evaluation suggest that the GST Credit pursues a relevant objective—namely to alleviate the regressive features of consumption taxation—and that it effectively meets its objective, as it truly helps reduce the regressive nature of the GST for low- and modest-income populations. The evaluation also concludes that the credit is fair, as it actually benefits the populations targeted by the credit. Finally, the evaluation indicates that the GST Credit likely achieves the objective of improving the incidence of the GST more efficiently than alternative mechanisms, such as tax exemptions or multiple tax rates.
2.1 History
The GST Credit was implemented in 1991, the year in which the federal government replaced the Federal Sales Tax (FST) with the GST. When it was abolished, the FST, which had been in effect since 1924, applied at a general rate of 13.5% on goods manufactured in Canada at the time they were sold by the manufacturer, including when they were destined for export.[3] For imported goods, the FST was applied to their duty-paid value and therefore on prices that did not include marketing and distribution expenses, unlike goods manufactured in Canada. The GST, which replaced this tax, originally applied at a lower flat rate of 7% (since reduced to 5%) to a wider range of goods and services.[4] This reform aimed to make the tax system fairer, more efficient and easier to administer, and to increase investment and global competitiveness by providing a tax exemption for inputs used in the production of goods and services destined for export.
One of the concerns raised during the development of the GST was the potential impact that the new tax could have on lower-income households. To ensure that these households would not bear a greater tax burden than before the implementation of the GST, the GST Credit was implemented. It replaced and enhanced the Federal Sales Tax Credit in effect since 1986.[5] The 1989 budget indicated that the implementation of an enhanced credit, combined with sales tax reform and other changes to the direct taxation of individuals, should yield a fairer tax system overall.
2.2 Main Rules
The GST Credit is a non-taxable quarterly payment made by the federal government to low- or modest-income individuals or families to offset all or some of the GST they pay on goods and services consumed.
To be eligible for the credit, a person must be a resident of Canada for income tax purposes and be in one of the following situations:
- is 19 years of age or older before the month in which the quarterly payment is issued;
- has (or previously had) a spouse or common-law partner; or
- is (or previously was) a parent and lives (or previously lived) with his or her child.
To receive the credit in a given year (benefit year), the person needs to have filed an income tax return for the year preceding the year for which the credit is being claimed (base year), even if no income was received in that year.[6]
The value of the credit provided in a benefit year depends on the adjusted family net income and the family situation reported by the taxpayer in the base year.[7] Specifically, the maximum amounts payable for the July 2016 to June 2017 period (for the 2015 taxation year) are as follows:
- an adult receives a basic adult credit of $276 per year;
- families with children aged 18 and under receive a basic child credit of $145 per year for each child;
- in lieu of the basic child credit, single parents can claim the full basic adult credit of $276 per year for one dependent child;
- single parents are eligible for an additional credit of $145 per year in addition to their basic credit, child credits and full basic adult credit for the first dependent child;
- single adults without children are eligible for an additional credit of up to $145 per year (depending on income) in addition to the basic credit.
For individuals and families whose annual income exceeds the phase-out threshold, the amount of the credit is reduced at a rate of 5% of adjusted family net income in excess of the threshold. The phase-out threshold for the 2016-2017 benefit year is $35,926.
Chart 1 shows the GST Credit amounts payable to some family types in 2016-2017.
Chart 1
GST Credit Amounts for the 2016-2017 Benefit Year, by Family Type and Adjusted Family Net Income Reported in 2015
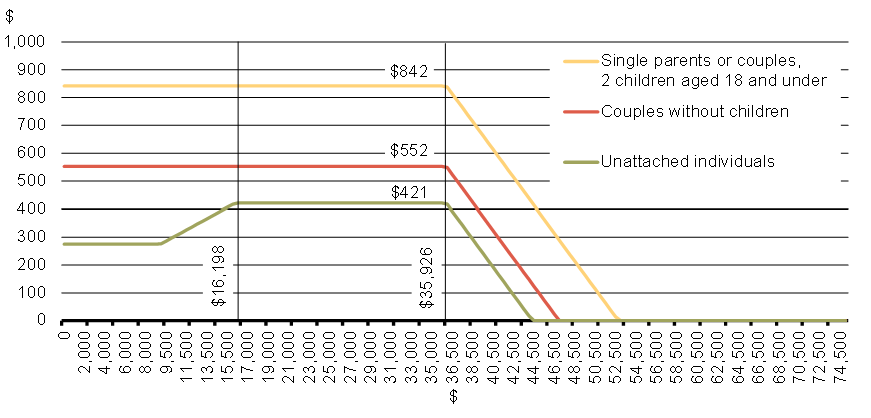
Source: Department of Finance Canada, based on information contained in the Canada Revenue Agency booklet entitled GST/HST Credit Including related provincial credits and benefits for the period from July 2016 to June 2017.
Prior to the implementation of the GST Credit, it was decided that the parameters for determining the credit amounts would be indexed to increases in the Consumer Price Index in excess of 3%.[8] This rule meant that, in the 1990s, the parameters of the credit were adjusted in only two years, the 1992-1993 and 1993-1994 benefit years. In subsequent years, the change in the Consumer Price Index did not exceed 3%; as a result the parameters were not adjusted until the end of the 1990s. Following the 2000 budget, the indexation rule was changed to provide for full indexation of the parameters of the credit. This change took effect beginning in the 2000-2001 benefit year.
When the GST rate was reduced in 2006 and 2008, no changes were made to the parameters of the credit. They remained at their existing level and continued to be fully indexed. A table presented in the Annex shows the evolution of the GST rate and the various parameters of the credit since the early 1990s.
2.3 Federal GST Revenues and GST Credit Expenditures
GST revenues totalled $37.3 billion in the 2015-2016 fiscal year.[9] Of this amount, $4.4 billion was paid out under the GST Credit. That year, net GST revenues totalled $33.0 billion and represented 11.1% of total net federal revenues.
As shown in Chart 2, net FST and GST revenues have followed a general upward trend over the last 30 years (solid line). Expenditures for credits related to these taxes increased following the transition from the FST to the GST, but have remained relatively stable since then, after adjusting for inflation (dashed line). GST revenues as a proportion of total revenues today are similar to when the GST was implemented, but are slightly lower than FST revenues as a proportion of total revenues in the late 1980s (dotted line).
Chart 2
Net FST and GST Revenues, Expenditures Under the FST and GST Credits, and FST and GST Revenues as a Proportion of Total Federal Revenues, 1988 to 2015

3.1 Relevance
As stated previously, the main objective of the GST Credit is to mitigate the regressive features of consumption taxation. This credit is therefore one of the measures aimed at increasing vertical equity within the tax system, as noted in the 1989 budget. The concept of vertical equity refers to the equitable treatment of individuals who are not in the same situation. One can generally say that vertical equity is achieved when the tax burden is distributed among individuals based on each person's ability to pay. However, as there is no consensus on the best way to define and measure an individual's ability to pay, it is difficult to draw firm conclusions regarding the vertical equity of the tax system or of a specific tax measure.[10]
The regressivity or progressivity of a tax is usually measured by taxes paid as a proportion of annual income, the effective tax rate. If the effective tax rate is higher for taxpayers with higher incomes and lower for those with lower incomes, a tax is said to be progressive. When the opposite is true, the tax is said to be regressive.
In the case of consumption taxes, the tax rate imposed on goods and services is not based on the income of those paying the taxes. Studies on consumer spending show that current consumption represents a larger share of the current income of low-income individuals than of those with middle or high incomes. As a result, lower-income individuals tend to devote a larger share of their annual income to paying consumption taxes than higher-income individuals, which explains the regressive nature of consumption taxes.
Chart 3 shows the effective GST tax rate for families in each of the 10 income deciles, without taking into account the GST Credit.[11] These results were obtained using version 18.0 of Statistics Canada's Social Policy Simulation Database and Model (SPSD/M). Version 18.0 was used instead of the more recent version 22.3 because it allows for simulations regarding the tax system over the entire period which is of particular interest for this evaluation, i.e. the 1992-2010 period when specific changes may have had an impact on the effectiveness of the GST Credit (see next section). The overall impact of the GST Credit in 2010 is similar to its impact in subsequent years; therefore, the results of this evaluation are valid for the credit today.
The results indicate that the GST paid by Canadian families is indeed regressive when considered relative to their annual disposable income. In effect, the lower a family's income, the higher the share of annual disposable income devoted to paying the GST.[12] For example, in 2010, families in the 1st and 2nd income deciles devoted 3.8% and 3.5% of their total disposable family income to paying the GST, while those in the middle deciles (5th and 6th deciles) devoted 3.1% and 2.9% respectively, and those in the highest deciles (9th and 10th deciles) devoted 2.7% and 2.1%. Note that for families in the 3rd to 8th deciles, the GST appears to be only slightly regressive.
Chart 3
Share of Disposable Family Income (in %) Devoted to Paying Gross GST, by Decile of Disposable Family Income, 2010
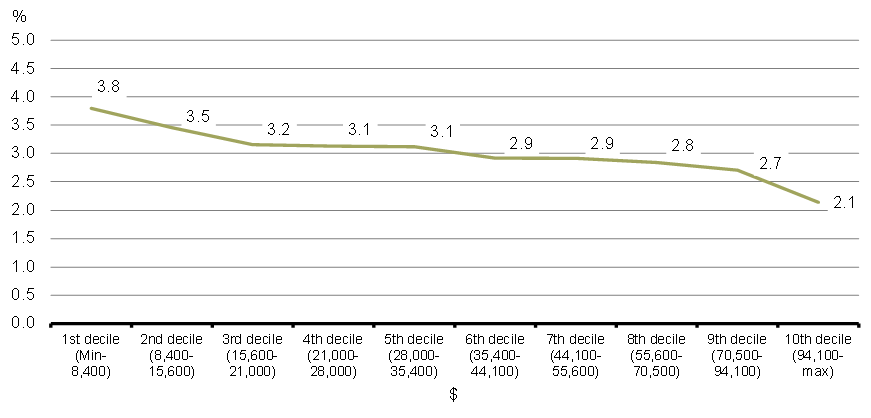
Notes: The unit of analysis is the nuclear family, which includes the members of a couple and their children under the age of 18. This concept is the one that is closest to the one used by the Canada Revenue Agency to calculate the amount of the GST Credit, i.e. the one including the filer and his or her spouse. Disposable family income that is taken into account consists of total family income, including market income (such as taxable and non-taxable capital gains and dividends), transfer income and all of the spouses' pension income (including Registered Retirement Savings Plan withdrawals), minus payroll deductions and income taxes. Source: Simulation results based on version 18.0 of Statistics Canada's Social Policy Simulation Database and Model. Assumptions and calculations underlying the simulation results were specified by the Department of Finance Canada, and responsibility for the use and interpretation of the results is entirely that of the authors.
Some researchers disagree with the premise that consumption taxes are regressive. They consider a general consumption tax, such as the GST, to be less regressive over an entire lifetime, possibly proportional or even progressive, given that the amounts saved today will finance the purchase of goods and services in future years and that the tax will be imposed at that time on those purchases. In support of this view, some studies evaluate the impact of consumption taxes on annual consumption rather than annual income, based on the premise that annual consumption better captures the "permanent income" of individuals than does annual income.[13]
While these studies raise doubts about the incidence of consumption taxes, most countries that collect consumption taxes have concerns regarding the impact that these taxes can have on lower-income populations, and use various mechanisms to mitigate this impact.
3.2 Effectiveness
While the previous section concludes that the GST Credit pursues a relevant objective, this section seeks to evaluate how effectively the credit achieves this objective. It uses the SPSD/M to analyze the credit's impact on the effective tax rate of the GST, and aims to determine if the credit actually helps reduce the regressive features of the federal consumption tax and, if so, to what degree.[14] This section also examines how that contribution has evolved over time.
In general, the analyses presented below indicate that the GST Credit achieves its objective of reducing the regressive features of the GST for low- or modest-income populations. This finding is true today, as it was in the early 1990s, i.e. in the first years following implementation of the GST. The analyses suggest that the rule of partial indexation of the GST Credit that was in place in the 1990s slightly reduced the effectiveness of the credit in achieving its objective of mitigating the regressive features of the GST. However, this rule was changed in the 2000 budget to provide for full indexation of the credit. Moreover, the cut to the GST rate, combined with the continued relative generosity of the credit in the 2000s, mean that low- or modest-income families now devote a smaller or similar share of their disposable income to paying the GST (net of the credit) than in the first years following the introduction of the GST.
Incidence of the GST Credit
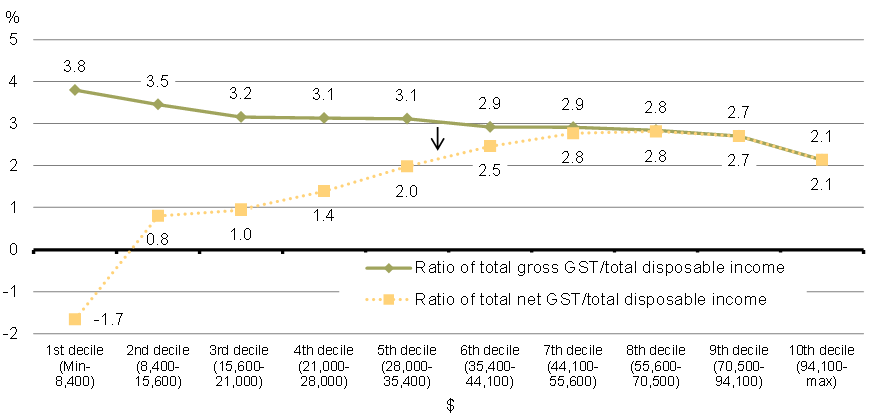
The dotted line in Chart 4 shows total GST paid by families as a proportion of their total disposable income, taking the GST Credit into account. This line shows that the GST Credit makes the federal consumption tax progressive up to the 8th income decile. Taking into account both the tax and the credit, the share of income devoted to paying the GST is lowest among families in the 1st income decile (-1.7%), increases to 0.8% for families in the 2nd income decile, continues to gradually increase until the 8th decile, and then decreases. For those in the 1st decile, the effective GST tax rate is negative when the credit is taken into account. This phenomenon is explained by the fact that, for a significant proportion of families in the lowest income decile, the value of the credit received is greater than the amount of GST paid over the course of the year.[15]
Therefore, the GST Credit effectively meets its objective of mitigating the regressive features of the federal consumption tax because, with the credit, the regressive incidence of the GST is reversed and becomes progressive for the first eight income deciles. Beyond a certain threshold of disposable family income (approximately $70,500 in 2010), the credit no longer has an impact on the regressive features of the GST, which is to be expected as the credit targets only low- or modest-income taxpayers.
Chart 4
Share of Disposable Family Income (in %) Devoted to Paying the GST, Gross and Net of the GST Credit, by Decile of Disposable Family Income, 2010
Trend in the Incidence of the GST Credit
Since the implementation of the GST and the GST Credit in the early 1990s, a number of factors have had an impact on the effectiveness of the GST Credit in alleviating the regressive features of the GST among low- or modest-income populations. These factors include: 1) the partial indexation rule of the GST Credit in the 1990s; and 2) the cuts in the GST rate while maintaining the parameters of the credit in the 2000s. To be able to draw conclusions regarding the evolution of the GST Credit's contribution to reducing the regressive features of the federal consumption tax over time, the net effect of these two factors must be considered.
Evolution of the Effective Tax Rate of Net GST
In the 1990s, the GST Credit was only adjusted if inflation exceeded 3%, resulting in the credit being increased in only two years, the 1992-1993 and 1993-1994 benefit years. This led to an erosion in the value of the credit during this period relative to GST amounts paid, i.e. the credit is now lower than if all credit parameters had been fully indexed to take into account the rise in the cost of living during the period from 1993-1994 to 1999-2000.
As the prices of goods and services rise each year, GST paid for their consumption rises as well, and as a result the partial indexation rule of the credit can be expected to have increased the net value of GST paid by the population benefiting from the credit. A comparison of effective net GST tax rates for families in each income decile in 1993 and 1999 reveals an increase in net GST paid by low- or modest-income families during this period. Chart 5 shows that, between 1993 and 1999, the period during which the credit was partially indexed, the share of income devoted to paying net GST increased among families in the lower income deciles and to a lesser degree among families in the three upper deciles. The fact that these proportions increased more in the lower income deciles than in the upper deciles is consistent with expectations, as the credit targets low- or modest-income populations.[16]
Chart 5
Share of Disposable Family Income (in %) Devoted to Paying Net GST, by Decile of Disposable Family Income, 1993 and 1999
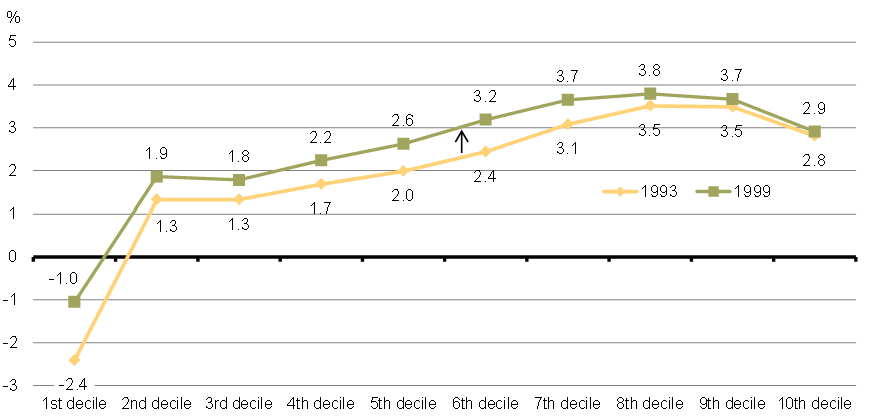
Source: Simulation results based on version 18.0 of Statistics Canada's Social Policy Simulation Database and Model. Assumptions and calculations underlying the simulation results were specified by the Department of Finance Canada, and responsibility for the use and interpretation of the results is entirely that of the authors.
In the 2000s, the Government chose first to restore the full indexation of the personal income tax system, and thus of the GST Credit, in order to fully protect taxpayers from inflation. It then lowered the GST rate from 7% to 6% on July 1, 2006 and from 6% to 5% on January 1, 2008, while maintaining the existing GST Credit rates for low- or modest-income Canadians, as well as the rebate for new housing and purchases by public service bodies.
These changes also had an impact on the share of disposable income that families devoted to paying net GST. The 2007 Economic Statement indicated that maintaining the GST credit level would translate into $1.1 billion in benefits annually for low- or modest-income families.[17] Chart 6 shows that the reductions in the GST rate, while the value of the credit's parameters were maintained, resulted in a reduction in the share of income devoted to paying net GST for all families, including low- or modest-income families. In fact, in 2010, the effective tax rates for families in each income decile were lower than the rates in 2005, the year preceding the first GST rate reduction.
Share of Disposable Family Income (in %) Devoted to Paying Net GST, by Decile of Disposable Family Income, 2005 and 2010 (and 1993)

Source: Simulation results based on version 18.0 of Statistics Canada's Social Policy Simulation Database and Model. Assumptions and calculations underlying the simulation results were specified by the Department of Finance Canada, and responsibility for the use and interpretation of the results is entirely that of the authors.
Chart 6 also shows that, following the reduction in the GST rate from 7% to 5%, the share of income devoted to paying net GST by families in the 2nd, 3rd and 4th income deciles fell to below 1993 levels. This means that, overall, most low- or modest-income families (i.e. with annual disposable income between $8,400 and $28,000 in 2010) now devote a smaller share of their disposable income to paying net GST than in the first years following the introduction of the GST. Thus, for this population, the two successive cuts to the GST, while the credit parameters were maintained at their existing level, more than offset the erosion of the credit's value that resulted from the partial indexation rule applied in the 1990s. For families at the middle of the income distribution (i.e. those in the 5th and 6th deciles, or with disposable income between $28,000 and $44,100 in 2010), the cut to the GST rate ensured that they now dedicate about the same share of their annual disposable income to paying net GST as in 1993. Families in the four upper deciles were little affected by the erosion of the credit's value, but benefited from the cuts to the GST rate due to their consumption level. They therefore saw their effective net GST tax rate fall during this period.
Evolution of the Credit's Impact on the Effective GST Tax Rate
The comparison over time of the decrease in GST paid that is attributable to the GST Credit shows that the partial indexation rule applied in the 1990s effectively resulted in a reduction in the relative generosity of the credit and that, on the other hand, the cuts to the GST rate while the credit parameters were maintained at their existing values increased the relative generosity of the credit. Overall, the decisions regarding the GST and the GST Credit in the 1990s and 2000s led to an impact of the credit that is now about the same as it was in the early 1990s for families in the first four income deciles, and slightly lower among families in the middle of the income distribution.
While Chart 7 shows that the share of total GST paid by families in each income decile changed very little between 1993 and 2010, it also shows that a much larger share of total GST Credit payments is now provided to families at the lower end of the income distribution (the first four deciles), and that families in the highest part of the income distribution do not benefit as much from the credit as they did in the past.
Chart 7
Proportion (in %) of Total GST Paid by Families in Each Decile (Left) and Proportion (in %) of Total GST Credit Payments Going to Families in Each Decile (Right), 1993 and 2010


3.3 Equity
This section examines the impact of the GST Credit on various groups and provides an overview of the number of credit recipients and amounts received, based on statistics published by the Canada Revenue Agency.[18] The analysis indicates that the GST Credit is generally fair, as it benefits the group of taxpayers targeted by the measure, i.e. those who report personal income or couple income that can be considered low or modest.
Table 1 presents statistics on the number of GST Credit recipients based on their province of residence. A total of $4.1 billion was paid under the GST Credit in the 2014-2015 benefit year, to more than 10 million Canadians, the equivalent of $402 per recipient.
Table 1 shows that GST Credit recipients are distributed fairly proportionally to the size of the population aged 15 and over in each province and territory of Canada. There is a slight over-representation of recipients in Newfoundland and Labrador and Quebec, and an under-representation of recipients in Ontario and Alberta. The average amount paid per recipient varies little from one province or territory to another, apart from Manitoba, Saskatchewan and Nunavut, where it is higher due to the financial and family situations of residents of those jurisdictions. In particular, the data indicate that GST Credit recipients in these three regions are more likely to be part of a family with three or more children. For example, 12.2% of credit recipients in Nunavut are part of such families, compared to 2.2% of recipients in Canada as a whole.
Table 1
Number of GST Credit Recipients, Total Value of Payments and Average Payment by Province and Territory, 2014-2015 Benefit Year
| % of the population | Number of GST Credit recipients | % of the total number of recipients | Total value of payments ($ million) | % of the total value of payments | Average payment per recipient ($) | |
|---|---|---|---|---|---|---|
| Total for Canada | 100.0 | 10,098,880 | 100.0 | 4,059 | 100 | 402 |
| Newfoundland and Labrador | 1.5 | 187,060 | 1.9 | 75 | 1.9 | 403 |
| Prince Edward Island | 0.4 | 43,740 | 0.4 | 17 | 0.4 | 398 |
| Nova Scotia | 2.7 | 295,550 | 2.9 | 118 | 2.9 | 400 |
| New Brunswick | 2.2 | 243,460 | 2.4 | 98 | 2.4 | 403 |
| Quebec | 23.3 | 2,618,080 | 25.9 | 1,033 | 25.5 | 395 |
| Ontario | 38.5 | 3,842,290 | 38.0 | 1,553 | 38.3 | 404 |
| Manitoba | 3.5 | 370,370 | 3.7 | 154 | 3.8 | 415 |
| Saskatchewan | 3.0 | 284,490 | 2.8 | 120 | 3.0 | 422 |
| Alberta | 11.3 | 856,740 | 8.5 | 349 | 8.6 | 407 |
| British Columbia | 13.3 | 1,329,700 | 13.2 | 530 | 13.1 | 399 |
| Northwest Territories | 0.1 | 10,310 | 0.1 | 4 | 0.1 | 409 |
| Yukon | 0.1 | 8,410 | 0.1 | 3 | 0.1 | 400 |
| Nunavut | 0.1 | 8,020 | 0.1 | 4 | 0.1 | 503 |
| Notes: The distribution of the population corresponds to the distribution of the population aged 15 and over by province and territory on July 1, 2014. Totals may not add due to rounding. Sources: Canada Revenue Agency, GST/HST Credit Statistics – 2014-2015 (2013 tax year); Statistics Canada, CANSIM table 051-0001. |
||||||
Table 2 presents the number of recipients and payment amounts based on the marital status of recipients and the number of dependent children. More than 84% of GST Credit recipients are not in a couple and more than 89% do not have any dependent children. Although people living in a couple are less likely to receive the credit, those who do receive it receive a higher average credit amount ($578) than people who are not living in a couple ($369). Moreover, since those with more dependent children are entitled to a larger credit, it is expected that the average credit received by recipients increases with the number of children, from $633 for those with one dependent child to $871 for those with three or more dependent children.
Table 2
Number of GST Credit Recipients, Total Value of Payments and Average Payment by Marital Status and Number of Dependent Children, 2014-2015 Benefit Year
| Number of GST Credit recipients | % of the total number of recipients | Total value of payments ($ million) | % of the total value of payments | Average payment per recipient ($) | |
|---|---|---|---|---|---|
| Total | 10,098,880 | 100.0 | 4,059 | 100.0 | 402 |
| Marital status | |||||
| Not in a couple | 8,509,040 | 84.3 | 3,140 | 77.4 | 369 |
| In a couple | 1,589,840 | 15.7 | 919 | 22.6 | 578 |
| Children | |||||
| No children | 9,010,290 | 89.2 | 3,295 | 81.2 | 365 |
| 1 child | 517,420 | 5.1 | 328 | 8.1 | 633 |
| 2 children | 350,080 | 3.5 | 244 | 6.0 | 696 |
| 3 or more children | 221,090 | 2.2 | 193 | 4.7 | 871 |
| Source: Canada Revenue Agency, GST/HST Credit Statistics – 2014-2015 (2013 tax year). | |||||
Table 3 presents the number of recipients and payment amounts based on the net family income level of recipients. Given that eligibility for the GST Credit and its value are determined based on the net family income of individuals, it is not surprising that the largest proportion of recipients have a low or modest income. Nearly one third of all credit recipients (32.1%) reported net family income of less than $10,000 in 2013, 28.8% reported income between $10,000 and $20,000, and 37.0% reported income between $20,000 and $40,000. A very small proportion of recipients (0.04%) reported net family income of $50,000 or more in 2013. As the average value of the credit is lower among those who reported net family income of less than $10,000, this group did not receive a third of total payments, but rather a quarter. Almost all GST Credit amounts in 2014-2015 went to people who reported net family income of less than $40,000.
Table 3
Number of GST Credit Recipients, Total Value of Payments and Average Payment by Net Family Income in 2013, 2014-2015 Benefit Year
| Number of GST Credit recipients | % of the total number of recipients | Total value of payments ($ million) | % of the total value of payments | Average payment per recipient ($) | |
|---|---|---|---|---|---|
| Total | 10,098,880 | 100.0 | 4,059 | 100.0 | 402 |
| Under $10,000 | 3,241,440 | 32.1 | 995 | 24.5 | 307 |
| $10,000 to $19,999 | 2,905,680 | 28.8 | 1,273 | 31.4 | 438 |
| $20,000 to $29,999 | 2,096,630 | 20.8 | 996 | 24.5 | 475 |
| $30,000 to $39,999 | 1,635,430 | 16.2 | 719 | 17.7 | 440 |
| $40,000 to $49,999 | 215,480 | 2.1 | 75 | 1.8 | 346 |
| $50,000 or more | 4,230 | 0.0 | 1 | 0.0 | 320 |
| Notes: Net family income is net income reported on line 236 of the income tax return. For individuals with a spouse, the net incomes of the two spouses are combined. Source: Canada Revenue Agency, GST/HST Credit Statistics – 2014-2015 (2013 tax year). |
|||||
Previous results suggest that the GST Credit benefits those who are the most in need. However, results published by Statistics Canada in 2006 raise some concerns in that regard, showing that a sizeable proportion of families who receive the GST Credit are not in a low-income situation (74% in 2003), and that a non-negligible proportion of them have high incomes (8% had a family income of $100,000 or more in 2003).[19] There are two primary explanations for the differences between the results of the Statistics Canada study and those presented in Table 3 of this paper. First, the thresholds used to determine GST Credit eligibility are significantly above the thresholds used by Statistics Canada to determine low-income status.[20] This aligns with the GST Credit's main objective, which is to soften the burden of the GST for both low- and modest-income families. The second explanation relates to the choice of the unit of analysis considered. The Statistics Canada study relies on the hypothesis that incomes are shared amongst all members of an economic family, i.e. the income of all related persons living under the same roof, while only personal income and that of a spouse are taken into account when determining an individual's eligibility for the GST Credit. According to the GST Credit rules, a young adult who is 19 years of age or older who lives with his or her parents can, for example, receive the full credit amount if his or her employment earnings are below the phase-out threshold, regardless of the parents' income, while in the Statistics Canada study, this same young adult would be considered low-income only if his or her parents also report low incomes. This explains why Statistics Canada also finds that almost all high-income GST Credit recipients are neither the main income earner for the family nor his/her spouse, but rather are their children or parents.
3.4 Efficiency
This section examines the efficiency of the GST Credit, i.e. whether the costs incurred to provide the benefits of this measure are minimized. It concludes that the GST Credit seems to more efficiently meet the objective of alleviating the regressive features of the GST than would some alternative mechanisms, such as multiple rates or the exemption of certain goods and services.
Regarding the administration of the GST Credit, an internal audit conducted in 2006 by the Canada Revenue Agency concluded that the management of this program was highly effective in achieving service objectives, primarily regarding respect for deadlines and accuracy in processing benefit claims, modifications and payments.[21] Also, compliance costs for taxpayers are minimal, as the Canada Revenue Agency automatically determines whether or not individuals are entitled to the credit when they file an income tax and benefit return.[22] Only new residents of Canada must complete a form in order to claim the credit.
Costs incurred by the federal government each year for the GST Credit are equivalent to the total payments made to families, i.e. some $4.4 billion in 2015-2016. Measures other than a refundable tax credit—such as lower rates or exemptions for certain goods and services consumed by low- or modest-income individuals—could also be used to mitigate the regressive nature of consumption taxes, and one can ask if these alternative measures would achieve this objective at a lower cost.
The evidence available in this regard suggests that the credit represents the most efficient option for achieving the desired objective.[23] Several problems are associated with the use of these alternative measures, and many economists are opposed to their use, on the basis that the costs incurred by these measures are greater than the benefits that they could provide in terms of progressivity. First, it is practically impossible to target goods and services consumed exclusively by low- or modest-income taxpayers. Consequently, a potentially large share of the total fiscal benefits provided for such goods and services could go to consumers other than those with low or modest incomes, reducing the efficiency of the measures. Moreover, these measures require that tax authorities and businesses identify which goods and services are eligible for the various rates and exemptions, resulting in additional administrative and compliance costs. Finally, these measures can encourage consumers to change their consumption choices in favour of goods and services taxed at a lower rate, distorting economic decisions.
In addition to being less complex administratively, financial compensation for lower-income families, including through refundable tax credits, is generally considered a more efficient means of countering the regressive features of consumption taxation, as it more appropriately targets populations in need and is less likely to result in consumption behaviours that are not optimal from an economic standpoint.
This paper presents an evaluation of the relevance, effectiveness, equity and efficiency of the GST Credit. Overall, it concludes that the credit does not present any significant shortcomings regarding the four guiding principles of the evaluation.
First, it concludes that the credit is relevant, as it aims to alleviate the regressive features of the federal consumption tax in Canada and thus increase the vertical equity of the tax system. It then finds that the GST Credit is effective, as it achieves its objective of reducing the regressive features of the federal consumption tax for populations at the bottom of the income distribution. The evaluation also concludes that the credit is fair, as it effectively benefits the targeted populations. Finally, the analysis indicates that alternative mechanisms to refundable tax credits that aim to counter the regressive features of a consumption tax would not likely achieve this objective at a lower cost. It therefore concludes that the GST Credit is an efficient measure.
Annex – GST Rate and GST Credit Parameters, Base Year 1990 to 2015
| Base or taxation year | GST rate % |
Benefit year for the GST Credit | Amount for adults $ |
Amount for children/single supplement $ |
Phase-out threshold $ | Phase-in threshold for single supplement $ |
|---|---|---|---|---|---|---|
| 1990 | FST | 1991-1992 | 190 | 100 | 24,769 | 6,169 |
| 1991 | 7.0 | 1992-1993 | 193 | 102 | 25,215 | 6,280 |
| 1992 | 7.0 | 1993-1994 | 199 | 105 | 25,921 | 6,456 |
| 1993 | 7.0 | 1994-1995 | 199 | 105 | 25,921 | 6,456 |
| 1994 | 7.0 | 1995-1996 | 199 | 105 | 25,921 | 6,456 |
| 1995 | 7.0 | 1996-1997 | 199 | 105 | 25,921 | 6,456 |
| 1996 | 7.0 | 1997-1998 | 199 | 105 | 25,921 | 6,456 |
| 1997 | 7.0 | 1998-1999 | 199 | 105 | 25,921 | 6,456 |
| 1998 | 7.0 | 1999-2000 | 199 | 105 | 25,921 | 6,456 |
| 1999 | 7.0 | 2000-2001 | 205 | 107 | 26,284 | 6,546 |
| 2000 | 7.0 | 2001-2002 | 207 | 109 | 26,941 | 6,710 |
| 2001 | 7.0 | 2002-2003 | 213 | 112 | 27,749 | 6,911 |
| 2002 | 7.0 | 2003-2004 | 216 | 114 | 28,193 | 7,022 |
| 2003 | 7.0 | 2004-2005 | 224 | 118 | 29,123 | 7,253 |
| 2004 | 7.0 | 2005-2006 | 227 | 120 | 29,618 | 7,377 |
| 2005 | 7.0 | 2006-2007 | 232 | 122 | 30,270 | 7,539 |
| 2006 | 6.0 | 2007-2008 | 237 | 125 | 30,936 | 7,705 |
| 2007 | 6.0 | 2008-2009 | 242 | 127 | 31,524 | 7,851 |
| 2008 | 5.0 | 2009-2010 | 248 | 130 | 32,312 | 8,047 |
| 2009 | 5.0 | 2010-2011 | 250 | 131 | 32,506 | 8,096 |
| 2010 | 5.0 | 2011-2012 | 253 | 133 | 32,961 | 8,209 |
| 2011 | 5.0 | 2012-2013 | 260 | 137 | 33,884 | 8,439 |
| 2012 | 5.0 | 2013-2014 | 265 | 139 | 34,561 | 8,608 |
| 2013 | 5.0 | 2014-2015 | 268 | 141 | 34,872 | 8,685 |
| 2014 | 5.0 | 2015-2016 | 272 | 143 | 35,465 | 8,833 |
| 2015 | 5.0 | 2016-2017 | 276 | 145 | 35,926 | 8,948 |
| Notes: The GST was introduced on January 1, 1991. The rate was reduced from 7% to 6% as of July 1, 2006, and then from 6% to 5% as of January 1, 2008. Source: Department of Finance Canada. |
||||||
Battle, Ken (1998). No Taxation Without Indexation, Caledon Institute of Social Policy, June 1998, ISBN 1-894159-07-1.
Bickley, James M. (2003). Value Added Tax: Concepts, Policy Issues, and OECD Experiences, Novinka Books.
Bird, Richard and Michael Smart (2016). "Finances of the Nation," Canadian Tax Journal, 64:2, pp. 417-442.
Carlson, George N. and Melanie K. Patrick (1989). "Addressing the Regressivity of a Value-Added Tax," National Tax Journal, 42:3, September 1989, pp. 344-346.
Chawla, Raj K. (2006). "The GST Credit," Perspectives on Labour and Income, Statistics Canada, Catalogue no. 75-001-XIE, Vol. 7, No. 6, June 2006.
De Boo (1989). Tax Reform Phase Two. Goods and Services Tax: A Summary, Special Release, August 8, 1989.
Department of Finance Canada (1990). Goods and Services Tax: A Summary, October 1990.
Godbout, Luc and Suzie St-Cerny (2011). "Are Consumption Taxes Regressive in Quebec?", Canadian Tax Journal.
Lee, Marc (2007). Eroding Tax Fairness: Tax Incidence in Canada, 1990 to 2005, Canadian Centre for Policy Alternatives, November 2007.
Organisation for Economic Co-operation and Development (2014). The Distributional Effects of Consumption Taxes in OECD Countries, OECD Tax Policy Studies.
Tremblay-Pepin, Simon and Francis Fortier (2014). Les taxes à la consommation et les inégalités au Québec. Institut de recherche et d'informations socio-économiques, Research Report, September 2014.
1 The analysis presented in this paper was prepared by Dominique Fleury, Economist, Tax Policy Branch, Department of Finance Canada. Enquiries regarding Department of Finance Canada publications can be sent to fin.financepublic-financepublique.fin@canada.ca.
2 To improve the effectiveness of collection and administration, some provinces have in recent years chosen to harmonize their own sales taxes with the GST and have it administered by the Canada Revenue Agency. Thus, Nova Scotia, New Brunswick and Newfoundland and Labrador adopted the Harmonized Sales Tax (HST) in 1997, followed by Ontario in July 2010 and Prince Edward Island in April 2013. The HST tax base is almost identical to that of the GST, and the HST is applied at the same rate as the GST, plus a provincial component that can vary depending on the province. This paper examines the federal component of the HST and therefore refers only to the GST.
3 Certain goods were taxed at a lower rate, such as construction materials, while others, such as tobacco, were taxed at a higher rate.
4 The GST rate was reduced from 7% to 6% on July 1, 2006, and then from 6% to 5% on January 1, 2008.
5 Other mitigation measures were also implemented, including certain exemptions and zero-rating (see Part 3 of this report for a full list of these measures).
6 For the purposes of the GST Credit, a benefit year is from the beginning of July to the end of June. During the benefit year, payments are made quarterly, in July, October, January and April.
7 Adjusted family net income is the amount entered on line 236 of the individual's income tax return. For individuals who have a spouse, the spouse's net income is added to their income to obtain family net income. Family net income does not include the net income of dependent children. Adjusted family net income corresponds to family net income minus net amounts received from the Universal Child Care Benefit (which was eliminated in 2016) and a Registered Disability Savings Plan.
8 Department of Finance Canada, Goods and Services Tax: A Summary, October 1990, p. 14.
9 Source: Public Accounts of Canada. The Government's 2015-2016 fiscal year is from April 1, 2015 to March 31, 2016. The $37.3 billion excludes $2.0 billion that was allocated to departments to fund their purchases of goods and services from outside parties.
10 In contrast, the concept of horizontal equity refers to the equitable treatment of individuals in the same situation, e.g. taxpayers in the same income class.
11 An analysis by decile sheds light on the level and evolution of income for families who are in one of the 10 segments of the income distribution. The 1st segment, also known as the 1st decile, includes the 10% of families with the lowest disposable incomes, while the last segment, referred to as the 10th decile, includes the 10% of families with the highest disposable incomes. An unattached individual is considered to be a single-individual family. The GST paid on the purchase of new housing was excluded from the analysis. Although the GST paid on new housing represents approximately 20% of GST revenues each year, in a competitive market builders can adjust their prices to absorb a portion of the tax, to the benefit of families. Moreover, the impact of the portion of the tax that is absorbed by families is generally spread over the period during which the purchase of the property is financed (typically several years when the purchase is financed through a mortgage).
12 Annual disposable income is income after transfers and taxes. It is the income available to families for consumption.
13 See for instance the Organisation for Economic Co-operation and Development (2014) study as well as the Bird and Smart (2016) study, which concluded that the GST (before the GST Credit) is not regressive, but slightly progressive in Canada.
14 This evaluation uses effective GST rates calculated based on annual disposable family income, since the GST Credit is paid based on family income, not on consumption levels.
15 The proportion of families in the 1st decile who were in this situation is estimated at 68.3% in 2010. This proportion could be overestimated, as the simulation model used to obtain these estimates is based on the following assumption: in a household that includes more than one nuclear family, the proportion of expenses paid by each nuclear family is equivalent to each family's share of the household's income. For example, in a household consisting of a couple earning $100,000 per year and their 20-year-old child who reports no income, the share of the household's expenses attributed to the young adult is 0%. Thus, the amount of GST paid by that young person is set at $0. This is a reasonable assumption, but may not perfectly reflect reality.
16 Although high-income families do not benefit from the credit, the share of income devoted by these families to net GST also rose slightly during this period. This trend is due to the fact that the share of income devoted to paying gross GST increased during this period among all income deciles due to a larger increase in the total amount of GST paid by families compared to the increase in their disposable income.
17 Department of Finance Canada, Economic Statement, October 30, 2007, p. 81.
18 GST Credit recipients are individuals who have received at least one credit payment in the benefit year.
19 Chawla, Raj K. (2006), "The GST Credit," Perspectives on Labour and Income, Statistics Canada, Catalogue no. 75-001-XIE, Vol. 7, No. 6, June 2006.
20 The low-income status of individuals was established using Statistics Canada's low-income cutoff measure. The low-income cutoffs are available in the Statistics Canada publication Low Income Lines, 2013-2014.
21 Canada Revenue Agency, "Benefit Programs," Corporate Audit and Evaluation Branch, November 2006.
22 Since 2014, filers no longer need to indicate on their return that they wish to claim the credit.
23 See, for example, Godbout, Luc and Suzie St-Cerny (2011),"Are Consumption Taxes Regressive in Quebec?", Canadian Tax Journal, pp. 471-472; Bickley, James M. (2003), Value Added Tax: Concepts, Policy Issues, and OECD Experiences, Novinka Books, pp. 19-21; Carlson, George N. and Melanie K. Patrick (1989), "Addressing the Regressivity of a Value-Added Tax," National Tax Journal, 42:3, September 1989, pp. 344-346.
Page details
- Date modified: