
A Strong Economy That Is Working for the Middle Class
Backgrounder
The Government’s plan to invest in the middle class and in the economy is working. Canada is now the fastest growing economy in the Group of Seven (G7) (Chart 1). Consumer confidence and household consumption are the main drivers of this strong growth, thanks in part to the impact of the Canada Child Benefit (CCB). Canada’s economy has created over 450,000 jobs since late 2015, and the unemployment rate has dropped to its lowest level since 2008. Youth unemployment is at a historic low, and gross domestic product (GDP) growth is forecast to be 3.1 per cent in 2017—significantly above expectations at the beginning of the year.
Chart 1
The Canadian economy is outpacing its peers and outperforming expectations
G7 Real GDP Growth Over the Past Year
Canada 2017 Real GDP Growth Outlook
Reflecting this recent economic strength, the fiscal outlook has improved significantly, with the outlook for the deficit improving by over $6.5 billion annually on average over the forecast horizon, relative to Budget 2017. As a result, the federal debt-to GDP ratio has been placed firmly on a downward track, and is projected to drop below 31% more than 3 years earlier than forecast in Budget 2017.
The fiscal projections presented in the 2017 Fall Economic Statement are based on an average of the September 2017 private sector economic outlook survey. Changes in economic growth assumptions can also have large impacts on the budgetary balance and debt-to-GDP profile over an extended projection horizon.
For example, if the Government based current fiscal projections on the average of the top four individual forecasts for nominal GDP growth, the budgetary balance would improve by $3.7 billion per year on average (Chart 2). Further, this would result in a federal debt-to-GDP ratio of 26.5 per cent, its lowest level since 1977.
Chart 2
Continued economic strength would accelerate deficit reduction
Federal Budgetary Balance
Federal Debt-to-GDP Ratio
Conversely, basing fiscal projections on the average of the bottom four individual forecasts for nominal GDP growth, the budgetary balance would worsen by $3.9 billion per year on average, and the federal debt-to-GDP ratio would still decline, but be 1.5 percentage points of GDP higher in 2022–23.
Chart 3
Federal Debt-to-GDP Ratio

The Government remains committed to sound fiscal management—balancing the need to make smart investments to support economic growth while preserving Canada’s low-debt advantage for current and future generations (Chart 3).
Recent Developments in the Canadian Economy
Canadian economic growth has accelerated sharply since the second half of 2016 (Chart 4). Over the last four quarters, the Canadian economy has had its fastest rate of growth since the beginning of 2006, and growth is becoming more balanced across sectors and regions.
Chart 4
The Canadian economy is resurgent, with average growth of over 3½ per cent in the last four quarters
Real GDP Growth

As global crude oil prices have stabilized, so has the economic situation in energy-producing provinces. Growth has also been robust outside of energy-producing regions. For example:
- Growth in the Maritime provinces in 2017 is expected to be at its strongest pace since 2010;
- The unemployment rate in Quebec is near its lowest level since at least 1976;
- Ontario has posted its longest back-to-back stretch of real GDP growth of above 2 per cent in over 15 years; and
- The British Columbia economy has created over 140,000 net new jobs since the beginning of last year—an increase of almost 6 per cent.
“To support the economy, the government introduced tax cuts for the middle class, expanded family benefits, and raised infrastructure spending...[This agenda] has succeeded in revitalizing the economy after a tough year in 2015.”
—International Monetary Fund
Household consumption has been the main contributor to economic growth over the past year, and has been fairly broad-based across consumption categories and regions. It has been underpinned by solid employment gains, low interest rates, and, since July 2016, by the ongoing support of the CCB to families. Household consumption has also strengthened alongside rising consumer confidence (Chart 5), which has been boosted by a more generous CCB and tax cuts for the middle class. Recent strength in economic activity will likely translate into jobs and income gains, which should support continued consumption growth in the near term.
Chart 5
Consumer confidence has strengthened across most of the country, boosting consumer spending
Consumer Confidence
Consumer Confidence and Household Consumption
Business investment is now also growing, underpinned by stronger economic activity in both the resource and non-resource sectors, much improved business sentiment, and transformative investments in infrastructure. The Bank of Canada’s Business Outlook Survey shows a strong improvement in business investment intentions over the last year (Chart 6).
Chart 6
Business investment is growing, with survey results pointing to ongoing gains
Growth in Real Business Investment and Selected Components
Bank of Canada’s Business Outlook Survey (BOS) Indicator and Business Investment Growth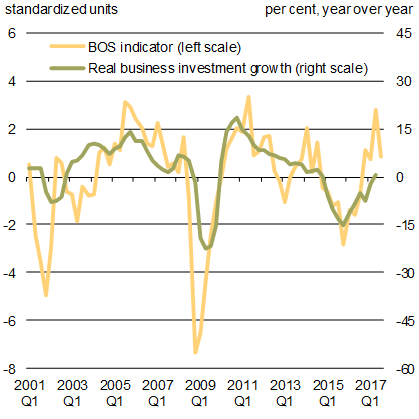
Page details
- Date modified: