Facts and figures


Source: Canadian Human Rights Commission


- Racialized Canadians earn an average of 81 cents to the dollar compared to other Canadians.

- Black males living in Toronto are 3 times more likely to be stopped and asked for identification by police.

- Employers are about 40% more likely to interview a job applicant with an English-sounding name despite identical education, skills and experience.

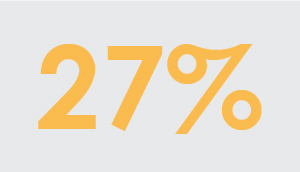
- 27% of the federal prison population in 2017 were Indigenous people, who only comprised 4.1% of the Canadian population (Statistics Canada, 2018).

- Employers are about 60% more likely to interview a job applicant with a Francophone-sounding name in Quebec, despite similar education, experience and skills (Commission des droits de la personne et de la jeunesse du Québec 2012, in French only, PDF format).
Page details
- Date modified: