
Evaluation of the Employment Insurance sickness benefits
From: Employment and Social Development Canada
On this page
- List of abbreviations
- List of figures
- List of tables
- Introduction
- Main findings
- Conclusions and recommendations
- Management response and action plan
- Annex A: Terminology
- Annex B: Evaluation questions
- Annex C: Lines of evidence
- Annex D: Data limitations
- Annex E: Factors analysis methodology
- Annex F: Survival analysis methodology
- Annex G: Incremental impact methodology
- Annex H: Bibliography
Alternate formats

Large print, braille, MP3 (audio), e-text and DAISY formats are available on demand by ordering online or calling 1 800 O-Canada (1-800-622-6232). If you use a teletypewriter (TTY), call 1-800-926-9105.
List of abbreviations
- CPPD
- Canada Pension Plan Disability
- CRA
- Canada Revenue Agency
- EI
- Employment Insurance
- ESDC
- Employment and Social Development Canada
- ROE
- Record of Employment
- SUB
- Supplemental Unemployment Benefit
List of figures
- Figure 1: Reported illnesses or injuries for EI sickness claimants
- Figure 2: 5 year average employment income and total income prior to 2011 illness job separation
- Figure 3: Share of illness job separators receiving workers compensation, 2011 illness job separation
- Figure 4: Employment income before and after an illness separation, 2006 to 2016
- Figure 5: Difference in total income between EI claimants and comparable non-claimants following a 2011 illness separation
- Figure 6: Share of 2011 illness job separators who were employed in each year post-2011
- Figure 7: Share of illness job separators by sources of income they received in Year 1 and Year 5 following a 2011 illness separation
- Figure 8: Pure sickness claimants who used 15 weeks of benefits without any income support
- Figure 9: Weeks between the end of a pure sickness claim and the return to work for those who used 15 weeks of benefits
- Figure 10: Proportion of pure sickness claimants who return to the same employer
- Figure 11: Speed of return to work by type of illness or injury
- Figure 12: Pure sickness claimants who received CPPD or social assistance in 2011
- Figure 13: Time between sickness and CPPD for pure sickness claimants who exhaust, 2011
- Figure 14: Observed EI sickness claims vs. predicted, Canada, 2000 to 2016
- Figure 15: Pure sickness claimants and regular claimants with multiple sickness spells, 2001 to 2016
- Figure 16: Regular claimants with multiple sickness spells as a share of all sickness claims, 2001 to 2016
- Figure 17: Number of spells for regular claims with multiple sickness spells, 2016
- Figure 18: Number of spells for pure sickness claims with multiple sickness spells, 2016
- Figure 19: Share of 90 survey respondents who reported illnesses or injuries for regular claimants with multiple sickness spells
- Figure 20: Share of 171 survey respondents who reported illnesses or injuries for pure sickness claims with multiple sickness spells
- Figure 21: Short-term sickness plans offered by employers interviewed for this evaluation
Introduction
This evaluation provides an assessment of the Employment Insurance (EI) sickness benefits based on the use, the accessibility, as well as the impact of the benefits on post-illness separation outcomes.
The focus of the evaluation is on EI claimants receiving sickness benefits from 2000 to 2016, excluding self-employed workers. Self-employed workers were examined in the Evaluation of Employment Insurance Special Benefits for Self-employed Workers (2016).
The analysis in this evaluation report uses information and data up to year 2016 and therefore does not cover specific measures associated with the COVID-19 pandemic.
Terminology, information on the lines of evidence and methodology are be found in Annexes A to H.
For ease of reading, the terms “claimant” and “claim” are interchangeable throughout the report to reflect the fact that some claimants have more than one claim during the period of analysis.
Key evaluation results
There were 3 main findings from the evaluation:
- the duration of the benefits is adequate for most claimants, but those with severe and/or long-term illnesses are more likely to use the full 15 weeks of sickness benefits and remain sick hereafter
- there has been significant growth in claims for the EI Sickness benefits nationally since 2000 that can be explained, in part, by demographic changes, and
- access to employer short-term sickness/disability plans is not uniform across the labour force in Canada. Without such coverage, EI sickness benefits remain the main support for many workers
Based on these findings, the evaluation recommends the following to the Department for the sickness benefits:
- explore and report on the possibility of new data linkages to inform policy development on the Employment Insurance sickness benefits, and
- examine Employment Insurance regular claims with sickness spells to better understand the interaction between these benefit types
Program description
The EI sickness benefits provide critical income support to Canadians.
Since 1971, the sickness benefits have been payable to individuals unable to work because of illness, injury or quarantine but who would otherwise be available for work if not for their incapacity due to medical reasons.
The EI Sickness Benefits are designed to provide temporary income replacement to help ease the financial burden of claimants so that they can focus on restoring their health and returning to work.
In fiscal year 2017 to 2018, $1.7 billion of EI sickness benefits were paid to 411,870 claims (or roughly $4,160 per claim).
Some illness job separators are covered under employer short-term sickness plans which can result in them not claiming EI sickness benefits at all or claiming them once they have exhausted their employer benefits—in other words, EI as a “second” payer.
EI sickness benefits provide:
- up to 15 weeks of temporary income support, at an amount equal to 55% of the average weekly insurable earnings up to a maximum weekly amount. In 2020, this maximum weekly amount is $573
To qualify for the sickness benefits, workers need the following:
- accumulated at least 600 hours of insurable employment during the 52-week period before the start date of their claim or since their last EI claim (whichever is shorter)
- obtained a medical certificate signed by a doctor or approved medical practitioner. See Annex A for a description of medical certificates
- experienced an EI sickness-eligible job separation— for example a reduction in their normal weekly earnings by at least 40% due to illness, injury or quarantine. For more information on the EI Program, refer to the annual Monitoring and Assessment Report produced by the Canada Employment Insurance Commission
Key changes to the EI sickness benefits: 1971 to 2018
- 1971
- Sickness benefits were introduced as part of the Unemployment Insurance (UI) program along with the Premium Reduction Program and the Supplemental Unemployment Benefit Plans.
- 1990
- Individuals were allowed to combine sickness and maternity benefits during a UI claim.
- 1996
- Unemployment Insurance changed to Employment Insurance (EI) and to an hours-based system.
- 2000
- The number of insurable hours to qualify for sickness benefits and other special benefits decreased from 700 to 600 hours.
- 2010
- Self-employed workers have the option of participating in the EI Program for special benefits, including sickness benefits.
- 2012
- Claimants no longer have to provide their medical certificate to the Department upon application. They must keep their certificate in case it is asked for at a later date.
- 2013
- Claimants can switch to sickness benefits from parental benefits.
- 2014
- Claimants can switch to sickness benefits from Parents of Critically Ill Children or Compassionate Care Benefits.
- 2017
- EI waiting period reduced from 2 to 1 week.
- 2018
- To facilitate a claimant’s transition back to work, new provisions were introduced to allow claimants to retain some of their earnings while on claim.
International comparison
- France
- Provides benefits replacing, on average, 50% of basic daily wages up to a maximum, for those who are ill or injured and meet a minimum amount of employment hours or income in the past 3 to 6 months, for up to 6 months, depending on different requirements.
- Germany
- Provides benefits replacing 70 to 90% of most recent take-home pay, for those who fall ill and meet a monthly income threshold, for up to 78 weeks of benefits over 3 years.
- U.K.
- Provides a weekly benefit of at least $157, for those unable to work due to illness for more than 4 consecutive days, for up to 28 weeks of benefits.
Source: Annex H has a list of references for these international comparisons.
EI sickness claimants
| Characteristics | In 20161 | Trend since year 2000 |
|---|---|---|
| Number of EI Sickness Claims | 390,020 | EI sickness claims have increased by 49.1% since year 2000 |
| Gender | 55.3% for women 44.7% for men |
The share of sickness claims established by women has varied between 55.0% and 58.3% |
| Regions and provinces (Territories are excluded due to small sample size) | 16.3% Atlantic 31.3% Quebec 27.1% Ontario 12.1% Prairies 13.2% BC |
The distribution has remained stable since year 2000, with 2 exceptions Proportion of sickness claims in Atlantic Canada increased by 3.9 percentage points Proportion of sickness claims in the Prairies regions decreased by 1.8 percentage points |
| Industry | 4.1% Primary 10.8% Construction 12.5% Manufacturing 50.5% Services 13.0% Government |
Reflective of changes in the labour force, there has been an increase in the shares of claims from workers within the Construction industry by 3.6 percentage points, and in the Government by 2.7 percentage points For the Manufacturing industry, it experienced a steady decline by 7.5 percentage points |
| Age groups | 6.4% 15 to 24 years old 20.4% 25 to 34 years old 20.4% 35 to 44 years old 24.3% 45 to 54 years old 23.3% 55 to 64 years old 5.1% 65 years and older |
The age profile of EI sickness claimants has become older The share of claimants 55 years of age and older more than doubled with 14.6 percentage points and outpaced this age category in labour force share |
1 Claimant profiles used 2016 EI Administrative Data as the benefit period for claims established in late 2017 were not yet complete at the time of analysis.
Sickness benefits in combination with other EI benefits
It is possible that an illness or injury may coincide with other life events where claimants would be eligible to receive other benefits besides sickness. Such life events could include:
- the birth of a child
- loss in employment
The EI Program allows claimants to receive other types of benefits—either before or after their illness or injury—within the same claim in which there were sickness benefits paid. In other words, a sickness combination claim without having to re-qualify through a separate application process.
| Combinations of claims and sickness benefits | Description | Share in 2016 |
|---|---|---|
| Sickness only | Claims where an individual only collects sickness benefits throughout the duration of their claim (in other words, a pure sickness claim) | 52.5% or 204,830 claims |
| Sickness and regular benefits | Includes those claims where individuals are laid-off from their employment, and then become sick, or, individuals who are sick, and then are laid-off from their employment | 35.8% or 139,720 claims |
| Sickness benefits and maternity and/or parental benefits |
Includes those claims where individuals are sick before or after the birth (or adoption) of their child. For examples sickness and maternity; sickness and parental; or sickness with maternity and parental benefit types | 6.6% or 25,690 claims |
| Sickness benefits and other Employment Insurance benefits | Includes those claims where individuals are using sickness in combination with any of the following EI benefits: compassionate care benefits, fishing benefits, parents of critically ill children, or work-sharing benefits | 4.9% or 19,780 claims |
| All types of combinations | Sickness benefits with/without other EI benefits | 100% or 390,020 |
Nature of the illness or injury for sickness claimants
An individual is not asked to provide the type of illness or injury in order to receive the EI sickness benefits. Rather a medical certificate must be obtained from a certified practitioner that indicates the number of weeks that they are unable to work (see Annex A for more information on eligible practitioners).
To better understand the type of illness or injury, the Survey of Workers (the Survey) was administered in 2018 to ask illness job separators who did not claim EI sickness benefits and EI sickness claimants specific questions on the illness or injury that led to their separation.
EI sickness claimants of the survey responded as follows:
- chronic conditions were responsible for 38% of cases, followed closely by acute traumas at 37%, with episodic conditions representing the remaining 25%
- close to 66% reported being affected by an illness as opposed to an injury or quarantine. Within this group, over half reported that their illness was not from a previous condition
- around 25% reported that their illness or injury resulted from a workplace incident

Text description for figure 1
| Illnesses or injury | Share of respondents in percentages. These percentages do not add up to 100% since respondents can select more than one type of illness or injury. Less than 3% of illnesses or injuries could not be categorized. |
|---|---|
| Physically-limiting condition | 19.1% |
| Stress/ anxiety/ mental health issues | 17.3% |
| Injury due to trauma | 16.8% |
| Surgery | 12.0% |
| Cardiovascular disease | 9.4% |
| Musculoskeletal disease | 9.2% |
| Long-term illness or injury | 7.1% |
| Cancer | 6.7% |
| Short-term illness or injury | 7.1% |
| Pregnancy-related condition | 5.2% |
| Nervous system or sensory illness | 3.3% |
Factors leading to an EI sickness claim
A statistical model known as “probit regression” shows that demographic and socio-economic factors are more important than the type of illness when determining the likelihood of whether someone claims or does not claim sickness benefits.
All reported results are statistically significant at the 10% level, at minimum. Coefficients reported are marginal effects evaluated at the mean.
More likely to claim:
- temporary employment prior to illness (+16.9% more likely to claim EI sickness compared to permanent employment)
- worked in the government industry prior to illness. (+11.4% more likely to claim EI sickness compared to service industry)
- reported their illness as stress, anxiety, or mental health issues (+7.3% more likely to claim EI sickness compared to a physically-limiting condition)
- age where the older the individual, the more likely they are to claim EI sickness (+3.4% more likely to claim EI sickness per additional decade of age)
No effect on claiming sickness benefits:
- gender and educational attainment had no statistically significant effect on claiming EI sickness
Less likely to claim:
- income: the higher the employment income of the individual, the less likely they are to claim sickness (2.4% less likely to claim EI sickness per $10,000 of additional income)
- worked in the manufacturing industry prior to illness (9.9% less likely to claim sickness compared to service industry)
- reported their illness as a pregnancy-related condition (10.7% less likely to claim sickness compared to a physically-limiting condition)
- received payments from a short-term disability plan (33.5% less likely to claim sickness compared to not receiving short-term disability benefits)
Eligibility: Meeting the 600 insurable hours threshold for EI sickness.
While the share of non-claimants among workers with an illness or injury job separation has been steadily increasing—from 44% in 2000 to 49% in 2017—this does not appear to be a function of decreased eligibility.
Since 2014, approximately 4 out of every 5 non-claimants had sufficient hours to be eligible for EI sickness—an improvement from 2000 (74%).
A partial explanation is related to the share of non-claimants employed by a business that participates in the Premium Reduction Program (PRP). It has increased from 33% in 2000 to 43% in 2017.
EI sickness claimants compared to those who do not claim
Age and gender distribution
Compared to eligible non-claimants with an illness, injury or quarantine job separation, sickness claimants are somewhat older. In fact, 28% are 55 years of age or older compared to 24% for eligible non-claimants. Women account for slightly more 55% versus 54% for eligible non-claimants in 2016 (see Annex A for a glossary of terms).
Income before illness
As shown in figure 2, EI sickness claimants and eligible non-claimants have different income levels prior to their illness or injury, on average.
- During the 5-year period preceding illness job separations that occurred in 2011, eligible non-claimants earned $8,000 more per year in employment income relative to claimants ($38,828 versus $30,472, on average)
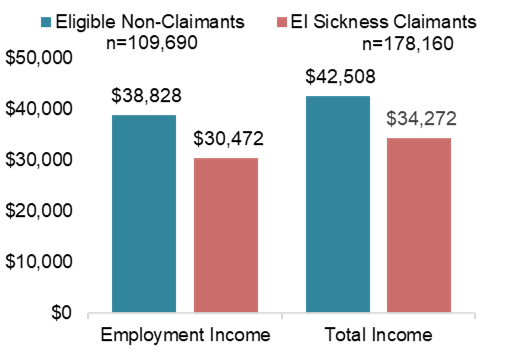
Text description of figure 2
| Type of illness job separators | Employment income | Total income |
|---|---|---|
| Eligible non-claimants | $38,828 | $42,508 |
| EI sickness claimants | $30,472 | $34,272 |
Types of illness or injury
In terms of illness or injury, there were no significant differences in the types of illnesses or injuries between claimants and non-claimants reported in the survey.
However, sickness claimants were less likely to report that their illness or injury was related to work—26% versus 33%.
Figure 3 shows that eligible non-claimants were much more likely to receive Workers Compensation benefits than claimants in the year of their illness job separation—13.9% versus 5.9%.
As expected, this program is first-payer for those who are eligible. The benefits are for the most part, more generous than EI benefits.

Text description of figure 3
| Years before and after separation | EI sickness claimants | Eligible non-claimants |
|---|---|---|
| -5 | 5.3% | 5.3% |
| -4 | 5.5% | 5.9% |
| -3 | 5.6% | 5.8% |
| -2 | 5.5% | 5.8% |
| -1 | 6.1% | 6.3% |
| 0 | 5.9% | 13.9% |
| 1 | 5.2% | 9.2% |
| 2 | 5.5% | 6.7% |
| 3 | 5.2% | 5.9% |
| 4 | 4.9% | 5.5% |
| 5 | 4.3% | 4.8% |
EI claimants experienced a greater reduction to their employment income than eligible non-claimants following an illness separation.
Among claimants, sickness benefits represented approximately 20% of total income in the year of illness separation and 2% the following year.
Using the most recent tax year of 2016, a post-illness separation analysis was conducted to show their employment income after 5 years from their job separation in 2011. The following changes were observed:
- employment income fell by 30% for EI sickness claimants in the first year following their illness separation. Eligible and non-claimants saw a 20% reduction following their job separation due to illness
- unadjusted for other factors, total income for eligible non-claimants was, on average, much higher in the post-illness separation period of 2012 to 2016, and even exceeded their pre-illness levels, compared to EI sickness claimants
- while employment income appears to start to recover for both non-claimants and claimants between 2012 and 2013, the 2 years following their separation, they continue to fall from 2014 to 2016 for both groups

Text description of figure 4
| Year | EI sickness claimants | Eligible non-claimants |
|---|---|---|
| 2006 | $27,484 | $35,422 |
| 2007 | $29,025 | $37,570 |
| 2008 | $30,717 | $39,147 |
| 2009 | $31,259 | $39,378 |
| 2010 | $33,874 | $42,625 |
| 2011 | $27,231 | $36,901 |
| 2012 | $23,639 | $33,814 |
| 2013 | $25,997 | $35,259 |
| 2014 | $25,781 | $34,523 |
| 2015 | $25,006 | $33,440 |
| 2016 | $24,246 | $32,285 |
Comparison group for figure 4
In order to have a representative comparison group for EI sickness claimants, the analysis used eligible non-claimants, in other words, those who had 600 insurable hours but did not claim EI sickness.
There are many other characteristics that further differentiate these 2 groups, for example income, short-term disability plan, age, are taken into account for the incremental impact analysis.
Incremental impact results
While the descriptive analysis of figure 4 compares all EI sickness claimants to eligible non-claimants, this incremental impact analysis further groups (matches) illness job separators by similar types of characteristics. These characteristics include gender, age, industry, province of residence, pre-claim income, presence of short-term disability plan. When this level of matching is carried out, the difference in total income, while negative, is considerably smaller than the reduction shown descriptively in figure 4.
The small negative statistically significant results in the second and third year is likely attributable to the fact that this model still lacks key variables that would have an effect an individual’s post-illness separation income. These variables are education level, type of illness or injury, severity of illness or injury, detailed information on short-term disability.
For more information, please see a full methodology note in Annex G.
After controlling for various socio-demographic characteristics, the difference in total income between EI claimants and non-claimants is considerably smaller.
The difference in total income between sickness claimants and a comparable group of non-claimants is small and statistically insignificant during the period where the claimant is in receipt of benefits. This difference was found after controlling for age, gender, workers compensation status and eligibility for an employer offering short-term disability plans. The following 2 key differences are worth noting:
- the negative impact is significant in the second and third year following the illness job separation
- the gap subsequently narrows in later years and becomes statistically insignificant
While data from the Survey could not be used in the incremental impact analysis due to insufficient post-separation data, the negative impact in the second and third year could be attributable to the severity and/or long-term nature of their illness or injury (see Annex G).

Text description of figure 5
| Year | Incremental impact |
|---|---|
| 2011 | -$78 |
| 2012 | -$479 |
| 2013 | -$962 |
| 2014 | -$789 |
| 2015 | -$739 |
| 2016 | -$671 |
Return to work and other income sources
While the vast majority of claimants and eligible non-claimants returned to work within the first year following an illness job separation at 90%, EI sickness claimants returned at a slightly slower rate or at 87% (see figure 6).
Though not shown in figure 6, in fact, not only were sickness claimants slower to return to work, but they were also more likely to leave the workforce by 2015 (21%) relative to eligible non-claimants (17%). Leaving the workforce was defined as having not declared employment earnings for at least 2015 and 2016.
In figure 7, a higher rate of leaving the workforce and lower levels of employment income result in claimants being more likely to rely on other sources of public income supports compared to non-claimants.

Text description of figure 6
| Year | Non-claimants | Sickness claimants |
|---|---|---|
| 2012 | 90.1% | 86.6% |
| 2013 | 85.9% | 82.5% |
| 2014 | 82.2% | 78.4% |
| 2015 | 78.7% | 74.9% |
| 2016 | 75.3% | 71.7% |

Text description of figure 7
| Year | Old Age Security | Canadian Pension Plan Disability | Social Assistance |
|---|---|---|---|
| Year 1 | 4.4% | 3.7% | 5.5% |
| Year 5 | 10.1% | 6.1% | 5.4% |
| Year | Old Age Security | Canadian Pension Plan Disability | Social Assistance |
|---|---|---|---|
| Year 1 | 3.4% | 2.3% | 3.2% |
| Year 5 | 7.9% | 4.3% | 3.5% |
Main findings
Finding #1
The duration of the benefit is adequate for most claimants, but those with severe and/or long-term illnesses are more likely to use the full 15 weeks of sickness benefits and remain sick hereafter.
From 2000 to 2016, a majority of claimants did not use or “exhaust” the potential full 15 weeks of entitlement available for an EI sickness claim. In 2016, 64% of all sickness claimants used less than the maximum number of weeks. Among this group, average duration of sickness benefits was 7 weeks.
The number of weeks of sickness benefits an individual used depends on a several socio-economic and demographic factors, as well as the illness or injury.
Using survival analysis as shown in Annex F, the duration of a claim varies based on several factors.
A shorter claim was associated with the following:
- higher income and a statistical significance at the 1% level
- a short-term health condition such as a flu, compared to a physically-limiting condition, and a statistical significance at the 1% level
- claimants who worked in marketing/sales/services or in clerical/administrative occupations prior to the illness or injury, compared to technical/trade occupations. Occupational factor had a statistical significance at the 5% level and the 10% level, respectively
A longer claim was associated with the following:
- a pure sickness claim compared to a sickness combination claim (a statistical significance at the 1% level)
- older claimants (a statistical significance at the 1% level)
- claimants who had cancer, or stress/anxiety, or mental health issues, compared to a physically-limiting condition (a statistical significance at the 1% level)
- claimants who had a nervous system and sensory illness (a statistical significance at the 5% level)
Exhausting the 15 weeks of EI sickness benefits
A little over 1-in-3 EI sickness claimants in 2016 or 36% used the full 15 weeks of benefits. This is a trend that has risen since 2009 with 33%.
In 2016, the share of claimants using all 15 weeks was higher among pure sickness claims (44%) than sickness combination claims (27%).
Similar to the results on duration and using a probabilistic regression, the probability of using all 15 weeks of sickness benefits was higher for illnesses or injuries associated with more severe/long-term issues, older claimants, and those only claiming sickness benefits.
The following factors affect the probability of exhausting the sickness benefit with a statistical significance at the 5% level:
- clerical or administrative occupations, (-15%) compared to a technical / trade occupations
- unemployed status prior to illness, (-15%) compared to being employed
- short-term illness (-13%) compared to a long-term illness
- Quebec resident (-9%) compared to a resident of Atlantic Canada
For factors that affect the probability of exhausting the sickness benefit with a statistical significance at the 1% level, include:
- claimants with cancer conditions (+24%) compared to a physically-limiting condition
- claimants with stress/anxiety or mental health issues (+16%) compared to a physically- limiting condition
- British Columbia resident (+15%) compared to a resident of Atlantic Canada
- pure sickness claim (+9%) compared to a sickness combination claim
- older claimants (+0.4% per year)
Weeks of no income among pure sickness claimants
Figure 8 shows that less than two-thirds of survey respondents who only claimed EI sickness, also used all 15 weeks of benefits. They reported having weeks with no income support during their illness. Percentages in figure 8 are for those who responded to the survey question. Due to rounding, they do not add up to 100%. Responses from the Survey of workers were linked with the EI administrative data.
For over 70% of them, this amounted to 5 weeks or fewer. These claimants appeared to be more commonly affected by severe health problems such as:
- cancer
- cardiovascular or nervous system illnesses, or
- mental health issues

Text description of figure 8
| Range of weeks | Percentage |
|---|---|
| Reported zero weeks of no income support | 35% |
| 5 or fewer | 38% |
| Between 6 and 10 | 16% |
| Between 11 and 15 | 2% |
| More than 15 | 10% |
Survey respondents who only claimed sickness, and used all 15 weeks of benefits, have a longer gap between the end of their sickness benefits and their return to work (many did not return at all).
About 55% of 226 who responded to the Survey question exhausted their benefits and returned to work. They were pure sickness claimants. About 30% returning within 10 weeks after the end of their claim. Still, 45% did not return to work by the time of the Survey as shown in figure 9.
The length of leave duration may include individuals accessing employer paid long-term disability plans following weeks of EI sickness benefits. Information confirming the receipt of benefits from this type of wage-replacement plans was not available.

Text description of figure 9
| Range of weeks | Percentage |
|---|---|
| Less than 5 weeks | 23% |
| 5 to 10 weeks | 7% |
| 10 to 20 weeks | 8% |
| 20 to 40 weeks | 9% |
| More than 40 weeks | 9% |
| Did not return to work | 45% |
Pure sickness claimants returning to work
Among claimants who only received sickness benefits and returned to work in figure 10, non-exhaustees are more likely to return to the same employer than exhaustees (see figure 10).
For exhaustees, reasons for not returning to the same employer included that the job was no longer available or they could not perform their previous task.
However, in cases where the claimant did not return to the same employer, there was no statistical difference in the reasons provided between exhaustees and non-exhaustees.
Of those who returned to work after having only claimed sickness benefits, exhaustees (48%) were more likely to have a gradual return to work than non-exhaustees (30%).
Gradual returns to work included working fewer hours or days per week.

Text description of figure 10
| Type of EI claimant | Percentage |
|---|---|
| Non-exhaustees | 85% |
| Exhaustees | 75% |
Additional analysis using the Survey of workers shows that certain types of illnesses and injuries significantly affect the length of time that it takes an individual to return to work.
A slower return to work was associated with more severe and/or long-term illnesses, such as cancer, cardiovascular, and nervous system and sensory illnesses (see figure 11). Pregnancy-related conditions led to the slowest returns to work, likely related to ongoing parental care. Comparatively, a faster return to work was associated with surgeries and episodic conditions.
Though less relevant in magnitude due to non-proportional hazards, the direction of the effect in figure 11 remains reliable.

Text description for figure 11
| Type of illness or injury | Proportional hazard | Statistical significance at 5% |
|---|---|---|
| Surgery | 1.612 | Significant |
| Episodic condition | 1.453 | Significant |
| Short-term issue or disease | 1.2973 | Not significant |
| Trauma | 1.187 | Not significant |
| Long-term issue or disease | 1.076 | Not significant |
| Stress/anxiety/mental health issues | 0.822 | Not significant |
| Musculoskeletal disease | 0.818 | Not significant |
| Cancer | 0.664 | Significant |
| Cardiovascular | 0.655 | Significant |
| Nervous system and sensory iIllness | 0.465 | Significant |
| Pregnancy-related xondition | 0.378 | Significant |
In addition to the type of illness or injury, results from the survival analysis highlight key labour market and sociodemographic characteristics that also play a critical role in the return to work (see Annex F).
The speed of returning to work from illness or injury was faster for claimants with the following characteristics and a statistical significance level of 1%:
- a post-secondary degree
- higher income
- illness/injury not work-related
- no EI sickness benefits
The speed of returning to work from illness or injury was slower for claimants who were older and in receipt sickness benefit before returning to work. These 2 characteristics have a statistical significance level of 1%. Claimants in receipt of short-term disability and those who had a temporary employment position were slower to return to work after an illness or injury. These 2 characteristics have a statistical significance level of 5%.
Pure sickness claimants and disability benefits
The higher likelihood of pure sickness claimants who exhaust their sickness benefits, and who did not return to work, may be partially explained by the severity and/or long-term nature of their illness or injury.
Pure sickness claimants who exhaust their benefits were 5 times more likely to receive Canada Pension Plan Disability (CPPD) benefits in the year following an illness separation than those pure sickness claimants who did not exhaust their benefits (figure 12).
The use of provincial Social Assistance among these claimants was at least 3 times higher when compared to non-exhaustees. This suggests that individuals may be utilizing the “disability” component of certain Social Assistance plans, for example the Ontario Disability Support Program as they attempt to re-enter the work force, or, as income support while they wait for a decision of CPPD benefits (figure 12).
EI sickness benefits and Canada Pension Plan Disability benefit
The pathway from EI sickness to CPPD is complex, as both programs have different criteria for eligibility, with CPPD designed for “severe and prolonged” illnesses (see Annex A for definitions and a complete description of the CPPD program).
Figure 12 shows that 10% of pure sickness claimants received disability benefits, 60% received disability benefits during their EI claim, or, 4 months following the end of their claim.
Given the 4-month waiting period for CPPD benefits, this would suggest that most claimants applied and were found to be eligible for disability benefits prior to the end of their sickness claim – the first 5 bars in figure 13 and Annex A for a description of CPPD waiting period.
Due to data limitations, it is not possible to ascertain whether the receipt of CPPD benefits relates to the same injury or illness that triggered the EI Sickness claim.


Text description of figure 12
| Type of benefits received | Non-exhaustees | Exhaustees |
|---|---|---|
| Received CPPD benefits | 2% | 10% |
| Received Social Assistance | 3% | 9% |
Text description of figure 13
| Time between sickness and CPPD | Percentage |
|---|---|
| Within EI Claim | 8% |
| 1 to 4 weeks after | 6% |
| 5 to 16 weeks after | 46% |
| 17 to 52 weeks after | 26% |
| 52+ weeks after | 14% |
Finding #2
There has been significant growth in claims for the EI sickness benefits nationally since 2000 that can be explained, in part, by demographic changes.
Figure 14 shows that the number of sickness claims established between 2000 and 2016 increased by 49.1%, from 261,580 to 390,020.
While some of this was due to population growth and aging of the labour force, much of this growth is not attributable to demographic changes in the labour force such as age, gender, or income.
If the incidence of claims by age group was unchanged, the number of claims would have increased by 55 claims per 100,000 labour force participants, from 2000 to 2016 due to the aging workforce.
Instead the incidence of sickness claims went up by 354 over this period, from 1,648 per 100,000 labour force participants in 2000 to 2,002 in 2016, representing more than 5 times the predicted increase.

Text description of figure 14
| Year | Observed EI sickness claims | Predicted number of EI sickness claims |
|---|---|---|
| 2000 | 261,158 | 261,121 |
| 2001 | 273,540 | 265,469 |
| 2002 | 281,280 | 273,567 |
| 2003 | 306,180 | 280,743 |
| 2004 | 311,610 | 284,828 |
| 2005 | 320,570 | 287,420 |
| 2006 | 327,230 | 291,378 |
| 2007 | 335,120 | 297,520 |
| 2008 | 355,000 | 302,179 |
| 2009 | 354,310 | 306,465 |
| 2010 | 335,870 | 311,178 |
| 2011 | 351,270 | 314,307 |
| 2012 | 351,930 | 318,448 |
| 2013 | 351,500 | 323,072 |
| 2014 | 367,190 | 324,634 |
| 2015 | 375,450 | 327,406 |
| 2016 | 390,020 | 331,063 |
While the overall increase in total sickness claims cannot be fully explained by demographic changes, most of the increase in the number of pure sickness claims can be.
Out of the estimated gap of about 58,000 claims between the observed and predicted number of claims in 2016, approximately 20,000—or about 33%—relates to pure sickness claims. The remaining gap relates to a growing number and share of all sickness claims where regular benefits are paid.
Explanatory note 1: Predicting the number of EI sickness claims
The predicted number of sickness claims is estimated according to the proportion of the labour force population receiving sickness benefits by gender, age and province as of 2000—in other words, the incidence of claiming sickness benefits. In particular, the predicted number of EI sickness claims is calculated by assuming that the incidence rates observed in 2000 would remain constant over the period from 2001 to 2016.
For instance, at the national level, the incidence of claiming sickness benefits in 2000 was relatively higher for women and generally increased with age. Therefore, as the labour force population grew and aged from 2001 to 2016, the predicted number of sickness claims commensurably grew as well (see red-dashed line in Figure 14).
In December 31, 2000, the number of insurable hours to qualify for sickness benefits and other special benefits decreased from 700 to 600 hours. Sensitivity analysis found that using the 2000 incidence rate (before the change), or the 2001 incidence level (after the change) did not have a significant effect on the predicted number of EI claims.
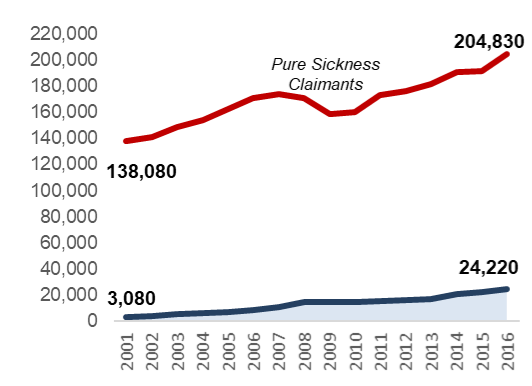
Text description of figure 15
| Year | Regular claimants multiple sickness spells | Pure sickness claimants |
|---|---|---|
| 2001 | 3,080 | 138,060 |
| 2002 | 3,620 | 140,960 |
| 2003 | 5,340 | 148,640 |
| 2004 | 6,440 | 154,160 |
| 2005 | 6,990 | 162,390 |
| 2006 | 8,240 | 170,750 |
| 2007 | 11,120 | 174,150 |
| 2008 | 14,560 | 170,780 |
| 2009 | 14,730 | 158,810 |
| 2010 | 14,910 | 160,430 |
| 2011 | 15,370 | 173,100 |
| 2012 | 16,280 | 176,570 |
| 2013 | 17,090 | 181,220 |
| 2014 | 20,630 | 190,640 |
| 2015 | 22,390 | 191,780 |
| 2016 | 24,220 | 204,830 |
One of the potential factors behind the increase in EI sickness claims is a greater incidence of claims where regular benefits are paid first and are followed by multiple spells of sickness benefits.
A regular claim with multiple sickness spells is defined as a claim that started with regular benefits and combined with at least 2 non-consecutive EI sickness spells. For example, after starting and receiving regular benefits, a claimant falls ill and reports 2 weeks of sickness. Once available to work, the claimant reverts back to receiving regular benefits prior to returning on sickness benefits due to another bout of illness.
Almost all claims (92%) that combine multiple spells of sickness with regular benefits are claims where regular benefits were paid first, in other words, a period of sickness following a layoff.
In 2016, of 139,720 claims 24,220 had multiple spells of sickness. Claimants who are laid-off may be eligible to receive up to 15 weeks of sickness benefits because of an illness, injury, or quarantine within the same claim. However, the maximum number of combined weeks (regular + other special benefits, including sickness) cannot exceed 50 weeks.
As shown in Figure 15, regular claims with multiple sickness spells only represent a fraction of claims compared to pure sickness. However, the total number of these claims increased more rapidly, from 3,080 in 2001 to 24,220 in 2016.
The growth does not appear to be driven by an increase in regular claims. Specifically, Figure 16 shows that these types of claims increased by about 6 times since 2001. Yet the total number of regular claims in 2016 is lower compared to 2001 level.

Text description of figure 16
| Year | Share of regular claims with multiple sickness spells |
|---|---|
| 2001 | 1.13% |
| 2002 | 1.29% |
| 2003 | 1.74% |
| 2004 | 2.07% |
| 2005 | 2.18% |
| 2006 | 2.52% |
| 2007 | 3.32% |
| 2008 | 4.10% |
| 2009 | 4.16% |
| 2010 | 4.44% |
| 2011 | 4.38% |
| 2012 | 4.63% |
| 2013 | 4.86% |
| 2014 | 5.62% |
| 2015 | 5.96% |
| 2016 | 6.22% |
Compared to those with pure sickness claims, claimants who combined regular and sickness benefits were more likely to have multiple spells of sickness within the same claim.
In 2016, claims starting with regular benefits and having multiple spells of sickness represented 17% of all claims that combined regular and sickness benefits. Comparatively, among pure sickness claims, about 13% had multiple spells of sickness (or 25,800 of 204,830 claims).
A pure sickness claim with multiple spells is defined as having an interruption in their sickness benefits related to a non-benefit reason. For example, a claimant starts their claim by collecting 5 weeks of sickness then reported 2 weeks of earnings followed by another 6 weeks of sickness benefits.
In contrast with regular claims where benefits were combined, the share of pure sickness claimants having multiple spells grew from 11% to 13% since 2001.
Not only did regular claimants have a higher incidence of having multiple spells of sickness, but their average number of spells within the same claim was higher.
Half or 50% of regular claimants with multiple sickness spells had 2 and 3 spells within the same claim in Figure 17 compared to only 16% for pure sickness claimants in Figure 18.
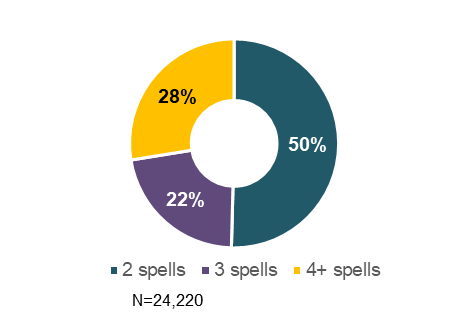

Text description of figure 17
| Number of spells | Percentage |
|---|---|
| 2 spells | 50% |
| 3 spells | 22% |
| 4+ spells | 28% |
Text description of figure 18
| Number of spells | Percentage |
|---|---|
| 2 spells | 84% |
| 3 spells | 11% |
| 4+ spells | 5% |
In fact, regular claims with multiple spells of sickness tended to have shorter spells of sickness than pure sickness claims with multiple spells.
Though not shown above, the proportion of regular claims with sickness spells of 2 weeks or less was higher (80%) compared to pure sickness claims (35%).
Regardless of claim pattern, EI sickness claimants are always required to obtain a medical certificate as an eligibility requirement for the benefit.
A higher prevalence of multiple sickness spells among regular claimants points to illnesses and injuries that could be more short-term and episodic in nature. By analyzing data from the Survey of workers, Figures 19 and 20 show that regular claimants with multiple spells were 6 times more likely to report their illness or injury as short-term, compared to pure sickness claimants with multiple spells. In other words, 24% for regular claimants with multiple sickness spells versus 4% pure sickness claimants with multiple sickness spells.
Though not shown in the figures above, further examination revealed that 27% of regular claimants with multiple sickness spells indicated that their illness or injury was caused by an episodic condition compared to 19% for pure sickness claimants who had multiple spells of sickness.
It is acknowledged that the sample sizes from the Survey are relatively small for these types of claimants ranging between 90 to 171 respondents and may not be completely reflective of the actual population.


Text description of figure 19
| Type of illness or injury | Percentage |
|---|---|
| Short-term illness or injury | 24% |
| Long-term illness or injury | 12% |
| Injury due to trauma | 11% |
| Cancer | 2% |
| Stress/anxiety/mental health issues | 3% |
| Musculoskeletal disease | 13% |
Text description of figure 20
| Type of illness or injury | Percentage |
|---|---|
| Short-term illness or injury | 4% |
| Long-term illness or injury | 10% |
| Injury due to trauma | 18% |
| Cancer | 7% |
| Stress/anxiety/mental health issues | 21% |
| Musculoskeletal disease | 9% |
Finding #3
Access to employer short-term sickness/disability plans is not uniform across the labour force in Canada. Without such coverage, EI sickness benefits remain the main support for many workers.
Employer short-term sickness plans, including sick days and short-term disability, play an equally important role in providing Canadians with support during a period of illness or injury.
In many cases, the coverage provided under an employer plan may be sufficient to not require an individual to apply for EI Sickness, as individuals must generally use all employer plan benefits (first-payer) before receiving sickness benefits (second-payer).
As noted under the characteristics leading to a sickness claim section, receiving short-term disability benefits reduces the probability of claiming sickness benefits.
To address a data gap about the types of short-term sickness plans offered by employers, the evaluation included key informant interviews with 42 employers from small, medium and large businesses.
Employers without a formal short-term disability plan or sick days
Among 9 employers who did not offer any formal sick days or short-term disability plans, 8 were small businesses with fewer than 50 people and 1 was a medium-sized business with 50 to 499 people. Thirty-three employers interviewed also provided long-term disability benefits to their employees. For more information see Annex H and the report entitled: “Findings from the Employer Consultation for the Evaluation of Employment Insurance”, a technical study available upon request.
Employers indicated the following reasons for not offering such plans were:
- medium-term absences in their organization were low to non-existent
- employees preferred that money be spent on other kinds of benefits, and
- employers and employees were already paying EI premiums to cover EI sickness benefits which provide income support for medium-term illness or injury

Text description of figure 21
Figure 21 represents a circle diagram providing a descriptive of the short-term sickness plans offered by employers. The figure shows that out of 42 employers interviewed for this evaluation:
- 9 had no formal short-term disability plans or sick days
- 4 had bankable sick days
- 5 had non-bankable sick days
- 24 had sick days and a short-term disability plan
Employers with a formal short-term disability plan or sick days
Most employers interviewed indicated that they provided some level of short-term sickness plan, but there was significant variation in the generosity of these plans.
Of the 29 employers who provided details on their sick day plans:
- 6 offered 5 days or less
- 16 offered 6 to 10 days
- 5 offered 11 to 15 days
- 2 offered an unlimited number of days
In all cases where sick days were provided with a short-term disability plan, the number of sick days offered was sufficient to cover the waiting period of the short-term disability plan and provided a level of income support equal to 100% of wages.
The type of coverage varied significantly. Among 19 employers, below are details of their short-term disability plans in terms of level of income support:
- 10 offered a wage replacement between 55% and 74%
- 5 offered a wage replacement between 75% and 99%
- 4 offered a wage replacement of 100%
Status of employment
- Part time - Coverage varied across employers, with some employers offering the same level of benefits as full-time workers, while other organizations provided no coverage at all
- Seasonal - Typically no coverage was provided, except when seasonal workers made up a significant portion of their workforce and/or the season was long (6 to 8 months)
- Casual/on-call - No coverage provided
- Temporary/contract - A small component of the workforce for those interviewed and were usually not provided any coverage
Transitioning back to work
Almost all employers reported that they provide some level of support to help workers transition back to work, which included:
- partial hours/graduated return to work
- modification of duties
- ergonomic adjustments
- work from home
Explanatory note 2: The Premium Reduction Program and Supplemental Unemployment Benefit Plans
The Premium Reduction Program and Supplemental Unemployment Benefit Plans are available to employers to provide greater short-term sickness coverage for their employees to help them regain their health in order to return to work. Awareness and use of both programs among the 42 employers interviewed was relatively low.
Premium Reduction Program
Employers who provide a short-term disability plan to their employees that meets minimum requirements set out in the Employment Insurance Act and Regulations, can register with Service Canada to be entitled to pay a lower rate for their EI premiums.
A total of 16 employers reported being aware of the program with only 11 were actively using it.
Administrative data shows that in 2017, 27.9% of illness job separators were associated with an employer who provided a short-term disability plan that qualified for a premium reduction at the time of the separation. Data did not allow for the identification of individuals in receipt of these benefits.
The following main reasons were provided by employers for not taking advantage of the program:
- their short-term disability plan was not eligible
- a belief it would not reduce their costs
Supplemental Unemployment Benefit plans
Employers have the option to register a Supplemental Unemployment Benefit (SUB) Plan with Service Canada. SUB plans provide employees with additional income during an EI claim resulting from a period of unemployment due to the following reasons: a temporary stoppage of work, training, illness, injury or quarantine. These plans top up employees’ weekly earnings without affecting their EI benefits.
A total of 14 employers reported that they were aware of the ability to register a such a plan with only 2 were registered with such a plan.
Administrative data shows that in 2017, only 5.4% of EI sickness claims were associated with such a plan.
Reasons provided by employers for not having a registered SUB plan were:
- they could not afford the extra cost of topping up benefits
- they felt that EI sickness benefits were sufficient
Conclusions and recommendations
The EI sickness benefits provide critical short-term income support to workers in various life situations who fall ill or are injured and are unable to work, $1.7 billion to over 400,000 workers in 2017 to 2018. For many of these workers, the sickness benefits are their only source of short-term disability benefits while they transition back to work or onto long-term disability programs.
Overall, the evaluation report provides evidence that the sickness benefits have been effective in meeting its core objective of providing short-term income replacement so individuals can focus on restoring their health and returning to work.
In particular, this report found that:
- 15 weeks of benefits remain an adequate duration of short-term income replacement for the majority of claimants as they transition back to work, and
- the incremental impact of receiving sickness benefits is not statistically significant in the long-term, while in the short-term the negative impact is more than likely linked to the severity/long-term nature of the illness or injury
However, the evaluation identified areas where there were limitations with assessing the full impact of the interaction between the type of illness or injury and the utilization of sickness benefits.
As such, the Evaluation Directorate offers the following recommendations:
Recommendation 1: Explore and report on the possibility of new data linkages to inform policy development on the Employment Insurance sickness benefit
Recommendation 2: Examine Employment Insurance regular claims with sickness spells to better understand the interaction between these benefit types
Management response and action plan
Recommendation 1
Explore and report on the possibility of new data linkages to inform policy development on the sickness benefits.
The Department would like to thank the Evaluation Directorate for its work on the program evaluation of the Employment Insurance (EI) sickness benefits which included extensive quantitative analysis complemented by surveys of employers and workers. Preliminary analysis shared over the evaluation process helped inform policy analysis.
Management agrees with recommendation 1.
Employment Insurance sickness benefits are short-term income supports for workers on leave due to illness, injury or quarantine. They complement other measures available to support Canadians, including longer-term illness and disability, benefits offered through employer-sponsored group insurance plans, private coverage plans held by individuals and Canada Pension Plan long-term disability benefits, as well as federal, provincial and territorial programs, labour programs, and workers compensation. However, for those Canadians who do not have access to employer-paid sick leave or disability benefits, sickness benefits would act as their primary social safety net.
Sickness claimants need to obtain a medical certificate from a recognized medical professional with an expected return to work date, but the program does not collect information on the nature of the illness or injury. This approach protects Canadians’ privacy and improves processing efficiency. However, this approach results in a knowledge gap regarding the interaction between the type of medical condition and the use of sickness benefits.
The Department will leverage available data and explore and report on the feasibility of possible new data linkages to address some of the knowledge gaps related to the sickness benefits. Additional analysis could help the program better understand how workers facing different types of health situations. For example, how workers with acute illnesses or injuries, chronic or episodic conditions, critical illness or injury, or mental health, use the sickness benefits and other government supports.
Actions planned
1.1 Explore and report on the feasibility to build upon the data analysis from the EI sickness evaluation using additional years of Canada Revenue Agency (CRA) tax data to conduct analysis on post-claim income compared to pre-claim income levels by type of illness or injury.
Anticipated completion date: Summer 2021
1.2 Explore and report on the feasibility of other linking EI administrative data and other ESDC data sources.
Anticipated completion date: Summer 2021
Recommendation 2
Examine Employment Insurance regular claims with sickness spells to better understand the interaction between these benefit types.
Management agrees with recommendation 2.
The program offers temporary financial assistance to unemployed workers.
A person who cannot work because of illness, injury or quarantine, but who would otherwise be available to work, may be eligible to receive up to a maximum of 15 weeks of sickness benefits.
At times, workers leave their employment due to illness, in other words, their “reason for separation” is specified as illness; in other cases, an unemployed worker already collecting regular benefits may become temporarily unavailable to search for work due to illness. Understanding these combination benefits could offer valuable insights into improving service delivery.
Examining regular claims with sickness spells will allow for a better understanding of the interaction between these benefit types, and possibly provide some insight into individuals with sickness spells and their ability to access benefits.
In addition, as part of our continuous improvements to the EI system, we will use the insights and observations developed within this evaluation to inform the integrity analytical framework for the system, and for sickness benefits in particular, going forward.
Action planned
2.1 Analyze EI regular claims with sickness spells, to review the frequency of occurrence and trends of this combination of benefit types.
Anticipated completion date: March 2021
Annex A: Terminology
- Canada Pension Plan Disability (CPPD) benefits
- Designed to provide partial income replacement to eligible CPP contributors who are under age 65 with a severe and prolonged disability, as defined in the Canada Pension Plan (CPP) legislation.
- CPPD waiting period
- It takes approximately 120 days for a decision to be made from the date we receive your application and all the necessary documents.
- Eligible non-claimants
- All illness job separators who did not receive at least $1 in EI sickness benefit and had 600 hours of insurable employment during the previous 52-weeks.
- Employment income
- Employment income captured from T4 supplementary tax records on an annual basis.
- Illness job separators
- Individuals who are issued a record of employment (ROE) where the reason for separation is illness, injury, or quarantine. Specifically, individuals who experience a reduction in their normal weekly earnings by at least 40% due to illness, injury or quarantine.
- Medical certificate
- A form completed by a medical doctor or other medical professionals attesting to the claimant’s inability to work and stating the probable duration of the illness, injury or quarantine. To receive sickness benefits, claimants need to obtain a medical certificate, which they may be required to submit at a later date.
- Non-claimants
- All illness job separators who did not receive at least $1 in EI sickness benefit following their job separation due to illness or injury.
- Pure sickness claim
- A pure sickness claim is a claim for which only EI sickness benefits are paid during the benefit period.
- Sickness claim
- A sickness claim is any claim for which at least $1 was paid in sickness benefits during the benefit period, such as a pure sickness claim or a combination of claim.
- Sickness claimants
- Sickness claimants are individuals who received at least $1 in EI sickness benefits during the benefit period.
- Sickness combination claim
- A sickness combination claim is when other EI benefits are paid (for example regular, maternity, parental) within the same claim in which sickness benefits were received.
- Total income
- All income reported on the T1 tax return records on an annual basis.
Annex B: Evaluation questions
The following evaluation questions were approved at the February 2016 Performance Measurement and Evaluation Committee.
- Sick leave plans:
- in the context of the Canadian labour market, what are the characteristics of public and employer-sponsored paid sick leave/wage loss insurance plans?
- to what extent do employer-provided plans and public programs help workers transition back into the workforce?
- what are the best practices in other countries?
- What proportion of Canada’s unemployed are eligible for EI sickness benefits?
- What proportion of employees is covered by an employer paid sick leave plan or a wage loss insurance plan?
- Claims:
- what are some of the factors influencing the level of sickness claims?
- what are the impacts of the changes regarding the requirement to provide medical proof of incapacity?
- did the 2006 change regarding medical certificate requirement affect the likelihood of making a sickness claim?
- How many medical certificates are requested by Service Canada each year?
- Are claimants from regions with low unemployment (who are eligible for fewer weeks of regular EI) more likely to use EI sickness benefits?
- How sickness benefits are being used:
- what is the duration of sickness claims?
- how are sickness benefits being combined?
- how many claimants interrupt their claims for other EI benefits (for example parental, compassionate care) to access sick benefits?
- what is the exhaustion rate?
- to what extent are employers topping up EI sickness benefits via the SUB program?
- to what extent do claimants work while on claim?
- What is the overpayment rate for EI sickness benefits and what are the reasons for overpayment?
- How easy is it to obtain a medical certificate?
- What is the nature of the illnesses/injuries that lead to sickness claims?
- To what extent do workers who leave employment due to sickness/injury exhaust their employer paid sick leave/wage loss insurance before claiming EI sickness benefits?
- The post-claim period:
- what was the employment status post-claim?
- when did a return to work occur?
- what is the source of income post-claim?
- what, if any, supports were available to ease the transition back to work?
- To what extent firms provide paid sick leave/wage loss insurance:
- what are the characteristics of employer-sponsored paid sick leave or wage loss insurance plans?
- do the plans include measures that support the transition back to work?
Annex C: Lines of evidence
Key informant interviews
Key informant interviews were conducted with 42 employers from small, medium and large organizations in 2017 to collect information on their practices with respect to supporting employees that take a medical absence from work. Both employers that provide a sick leave plan to their employees and those that do not provide any such plans were consulted. More information on the interviewed employers can be found in Findings from the Employer Consultation for the Evaluation of Employment Insurance.
The sample of employers who were interviewed was derived from criteria developed by the Conference Board of Canada in 2013 (see Disability Management: Opportunities for Employer Action. The Conference Board of Canada).
Employment Insurance status vector administrative data, Canada Revenue Agency tax files, and Canada Pension Plan Disabilities files
The administrative data used for this evaluation included a 10% sample of all sickness claims established, from 2000 to 2016, which comes directly from the Status Vector file.
The Record of Employment (10% sample) was used to identify those individuals who had an illness separation but did not go on to claim EI Sickness (non-claimants).
Individual tax files from 2000 to 2016 (10% sample), such as the T1 and T4 were linked to the Status Vector and the Records of Employment to provide detailed earnings and income information for sickness claimants and non-claimants.
Canada Pension Plan Disability (CPPD) benefits files from 2000 to 2016 were linked to the Status Vector to provide information on the time between receiving sickness benefits and CPPD benefits.
Survey of workers
In 2018, R.A. Malatest & Associates Inc. conducted a survey on individuals who had experienced an illness or injury in 2016. The sample that was used for the survey was derived from Employment and Social Development Canada administrative data and provided to the contractor to conduct the survey.
In total, 2,214 individuals responded to the survey and provided consent to have their survey responses linked to the Status Vector, Records of Employment, and tax files T1 and T4. Of those who responded, 58% or 1,291 claimed EI sickness benefits while 42% or 923 did not claim sickness benefits, in other words, non-claimants did not receive at least $1 of sickness benefits.
Annex D: Data limitations
Key informant interviews
Overall, 42 employers were interviewed for this evaluation, which included:
- 15 small business with less than 50 employees
- 15 medium sized businesses with 50 to 499 employees, and
- 12 large businesses with 500 or more employees
It is recognized that the sample of employers interviewed does not reflect the portrait of employers in Canada (the majority of whom meet the definition of small business). Still, the information collected from interviewed employers is deemed useful and informative since it helps contextualize employers’ practices with respect to supporting employees that take a medical absence from work.
Status vector administrative data, CRA tax files, and CPPD files
There is close to a 2-year lag in CRA tax data which limited total income and employment income analysis to the years from 2000 to 2016. In addition, the benefit window for special benefits can span up to 104 weeks, so 2016 is the most recent year that was used to analyze claims that were combined with other benefits.
Although the total income variable used from the T1 file captures all income declared in a given calendar year including capital gains on investments, the tax files that were used in this evaluation did not include detailed information on all the types of income that were declared. Therefore, the evaluation was unable to identify if claimants or non-claimants were more likely to be using investment or savings income during their illness or injury.
Status Vector and CRA tax files did not contain any information on the types of illness or injury of an individual that led to a job separation. Therefore, all analysis on post-illness outcomes is limited by a lack of information on their illness or injury.
Employment in the post-separation period is captured from the T4 file by observing positive employment income during a calendar year. However, the weakness of this indicator is that it does not distinguish among employment spells of varying durations, but instead, treats all employment episodes equally.
The CPPD benefits cannot be linked tax files. Therefore, the cross-reference between CPPD data with T1 tax data was not performed to see if an individual had in fact received CPPD benefits. In addition, the exact date of payment for CPPD benefits cannot be determined. As such, 120 days was added to the date effective variable to estimate the duration of the waiting period.
Survey of workers
Respondents were not asked to verify the exact Record of Employment or their sickness claim that was associated with the illness or injury that they were providing responses to. It may be the case that the Record of Employment and/or EI sickness claim that we matched to was not correct.
The Survey of workers only asked respondents about their illness or injury that occurred in 2016. Given that 2016 is the most recent and available tax information, no post-claim analysis can be conducted for survey respondents their input took place in 2018. Trend analysis was unfeasible with only one year of information on illness or injury.
Although results from the Survey of workers were weighted to be regionally consistent with the target population of illness job separators, it is possible that those who were surveyed and provided responses were not a random sample of EI claimants and non-claimants. In fact, claimants who only collected sickness benefits were underrepresented in the sample, resulting in an oversample of claimants who combined sickness with regular benefits. However, it is not expected that the oversampling will impact the results significantly, since the number of respondents is sufficiently large to provide a good representation of their respective target population and their type of illnesses and injuries.
Annex E: Factors analysis methodology
Population
In order to assess the factors that affect the level of sickness claims, sickness claims were grouped based on the year, gender, age and province where they reside. The labour force population in each of the demographic groups was extracted from the Labour Force Survey from Statistics Canada’s CANSIM database. Claim-to-labour force population ratio was then derived for each subgroup, which provides a unique incidence of claiming for all subgroups of year, gender, age group and province.
Count model
Using the claim-to-labour force population ratio as the dependent variable, a log-linear regression model was fitted to the data using maximum likelihood by assuming a negative binomial distribution to estimate the effects of birth-cohort, gender, age, province and year on the claim-to-labour force population ratio.
The model specification allows for the age effect to vary between men and women, and for capturing the year effect in each of the 10 provinces. The figure A shows the result of the likelihood ratio test, based on which the negative binomial distribution was found most appropriate for the data.

Text description of figure A
The figure shows 3 curves representing the following distributions:
- the observed proportion in the data
- the estimates of the Negative Binomial model, and
- the estimates of the Poisson model
The curve of the negative binomial distribution is flattened compared to that of the Poisson distribution and is the closest to the observed proportion; The Binomial negative distribution seems to best suit the data.
Demographic prediction model
In order to assess the predicted effect of only demographic changes to EI sickness claims, the claim incidence of each cell in 2000 was chosen and assumed fixed as the baseline claim incidence, by which the number of labour force participants in each cell from 2001 to 2016 was multiplied to obtain the predicted number of claims.
Limitations
There are zero observations in some of the subgroups in a given year. Since the sample used in this study is 10% of the Status Vector database, the zero likelihood as the result of these “0”s may not reflect the reality and the incidence rate could be underestimated. However, these situations represent less than 1% of demographic groups and it occurs only in some calendar years. Thus, the effects of the demographic characteristics obtained from the regression should not be affected by this data limitation.
A full methodological note is available upon request.
Annex F: Survival analysis methodology
Population
The population used for the survival analysis included respondents to the Survey of workers who provided their consent to have their input linked to information from the Status Vector. The full population was used to analyze the return to work, while only claimants could be considered for the claim duration analysis.
Cox Proportional Hazards Model
All survival analysis is undertaken on a time to event time-scale. The model chosen known as the Cox Proportional Hazards Model. It is a semi-parametric model estimated under the assumption that covariates are multiplicatively related to the hazard (where the hazard function is the risk for a given time 𝑡 ≥ 𝑡0 of the event occurring).
The model effectively assumes that the likelihood for some event to occur is different between individuals with different characteristics, and that this difference is constantly proportional over the study period.
Claim duration analysis
Duration of claim is determined directly from the Status Vector, with duration given by the number of weeks in which benefits were received. Claimants who took the maximum 15 weeks of sickness benefits were considered not to have stopped claiming, and rather to have been censored.
Return to work analysis
The length of time before a return to work is based upon differences in the week variable of the start of a sick leave in the Status Vector, and the week in which a return to work was observed. The month of return to work was determined from the Survey of workers.
Limitations
The survey provides a much richer set of data than is available in the Status Vector database. However, the survey sample size is only 2,214 respondents, which means that some caution should be taken in the interpretation of results.
The survival model chosen has a disadvantage of not specifying expectation of the relative amount of “survival time” between individuals with various characteristics. This means that at no point can the data indicate that some group will experience a failure event some number of weeks earlier. For example, the model captures only proportional hazards between groups over time.
Further, the survey analysis has limitations due to the intrinsic uncertainty associated with linking survey results to administrative data. Specifically, the analysis of time before a return to work requires a separation date derived from the Record of Employment (ROE) to determine when the leave begins, while the end of the sick leave is determined by survey data indicating the month in which a return to work occurs. This issue is handled to the best extent possible by selectively choosing between possible ROEs for consistency between survey results and administrative data. However the process is imperfect and relies on accurate recall on the part of survey respondents of events which might have occurred over 2 years prior to them being surveyed.
A full methodological note is available upon request.
Annex G: Incremental impact methodology
Population
In order to assess the incremental impact of claiming sickness benefits, the comparison looked at those who received sickness benefits as the treatment group and those who were eligible or had 600 hours but did not receive the benefits as a comparison group.
The impact analysis is conducted for the 2011 cohort, which is comprised of those who had an illness job separation in 2011. Indicators for employment earnings and total income were obtained from T4 and T1 tax files for both groups over a period of 5 years post-illness separation (2012 to 2016).
Propensity score matching
To account for the fact that sickness benefits claimants and non-claimants are inherently different, especially in terms of income, a propensity score matching technique that is based on a logistic regression model was used to select non-claimants that resembled sickness claimants as closely as possible.
The logistic model was developed to predict the likelihood of claiming sickness benefits and incorporated over 150 variables to minimize inherent differences concerning the likelihood of claiming.
Examples of variables that were included:
- gender
- age
- marital status
- region
- industry
- receipt of worker’s compensation
- the percentage change in earnings in 2011 relative to 2010, and
- earnings in the past 5 years
Figures B and C show that after matching, both groups effectively had the same likelihood of claiming.

Text description of figure B
Figure B presents 2 curves illustrating the distributions of propensity scores before the matching for the treated group and the comparison group. The 2 distributions are quite different. The curve of propensity scores is more flattened for the treated group compared to the comparison group. The 2 groups do not have the same likelihood of claiming EI sickness benefits.

Text description of figure C
Figure C presents 2 curves illustrating the distributions of propensity scores after the matching for the treated group and the comparison group. The 2 curves are superimposed, hence the distributions match perfectly. The matching process was successful in minimizing inherent differences in the likelihood of claiming EI sickness benefits between the 2 groups.
Limitations
While this method helps us to attribute the impact of receiving sickness benefits on a claimant’s outcomes (employment earnings and total income), it is limited to what can be observed in the administrative data. For instance, the types and severity of illness or injury likely had an effect on the decision to claim sickness benefits following an illness job separation, however they cannot be measured with the available data.
A full methodological note is available upon request.
Annex H: Bibliography
- External sources
International comparisons:- France: https://www.internations.org/france-expats/guide/29458-social-security-taxation/sick-leave-and-disability-benefits-in-france-19289
- Germany: https://ec.europa.eu/social/main.jsp?catId=1111&langId=en&intPageId=4550
- United Kingdom: https://www.gov.uk/statutory-sick-pay
Thorpe, K. & Chénier, L. (2013). Disability Management: Opportunities for Employer Action. The Conference Board of Canada. Retrieved from: https://www.sunlife.ca/static/canada/Sponsor/About%20Group%20Benefits/Group%20benefits%20products%20and%20services/The%20Conversation/Disability/DisabilityManagement_SUNLIFE_EN.pdf
- Technical studies (available upon request):
ESDC (2017). Findings from the Employer Consultation for the Evaluation of Employment Insurance.
ESDC (2018). Descriptive Analysis of EI Sickness Claims: Study for the Evaluation of the Employment Insurance Sickness Benefit
ESDC (2018). Methodology note on sample weights for the Survey of Workers.
ESDC (2018). Methodology note on the Analysis of the Survey of Workers.
ESDC (2018). Methodology note on the Incremental Impact Analysis.
ESDC (2018). Methodology note on the Factors Analysis.
ESDC (2018). Preliminary results on the Survey of Workers. - Data sources:
Tax files. See Annexes C and D.
Employment Insurance Status Vector administrative data. See Annexes C and D.
Record of Employment data. See Annexes C and D.
R.A. Malatest & Associates (2018). Survey of Workers. See Annexes C and D.
Statistics Canada. Table 14-10-0018-01. Labour force characteristics by sex and detailed age group, annual (x 1,000)
Page details
- Date modified: